Nifty levels (for 18-04-2024) are given in the chart.Nifty levels (for 18-04-2024) are given in the chart.
NIFTY trade ideas


NSE SECTORWISE PERFORMACE AFTER 13 MARCH 2024Here is a sectorial analysis, after a sell off from 13 March 2024.
Please click on image to check which sectors shining.
All the Best.
This post is not a investment advice. It is for only educational and recreational purposes.

Sectorial Analysis NSE:INDIA After 13 March 2024Here is a sectorial performance after a sell off on 13 March 2024.

Mighty Nifty 50 rising wedge pattern Mighty nifty 50 rising wedge pattern
Time frame-Daily
Tomorrow weekly expiry so volatility on higher side
Max call Oi-22200
Max put oi-22000
So trade accordingly.

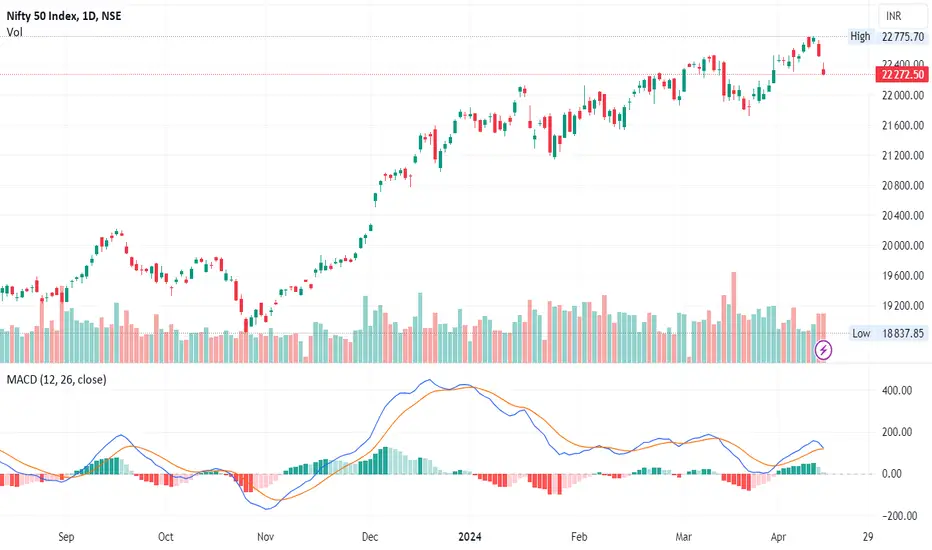
NIFTY DAILY - 16/4/2024Third gap down opening of Nifty50 due to global causes and ended lower for entire trading session.
Another 125 points down into third gap down (nearly 624 points drop in last 3 trading session).
Nifty has formed small body green candle with upper and lower shadows. MACD is giving Crossdown.
Nifty broken the support of 22242 so, further support will be near 21936 with resistance of 22214 level.
Today’s Advance Decline ratio of NIFTY50
Advance - 16
Decline - 34
FII Sell – 4468.09 crores
DII Buy + 2040.39 crores.
⚠️ Important: Always maintain your Risk & Reward Ratio.
✅Like and follow to never miss a new idea!✅
Disclaimer: I am not SEBI Registered Advisor. My posts are purely for training and educational purposes.
Eat🍜 Sleep😴 TradingView📈 Repeat 🔁
Happy learning with trading. Cheers!🥂

Market Outlook: Israel and Iran Conflict continues to haunt. After taking a drastic beating due to Israel and Iran conflict Nifty today has taken a support near Mother line (50 EMA). There is also a trend line support at the same place. If there is no bad news in next one or two days we might see a reversal in Nifty in favor of Bulls. In case there is some more bad news we may see bears tightening the grip over the market.
Right now main factors driving the market are global. One in global inflation and commodity prices (Specially metals/ Precious metals and crude oil) and Israel and Iran conflict. Local factors are firmly looking good and no changes seen.
If there is a full scale war the imp act will be Global and no market will remain insulated from the same. But India because of local factors and neutral stance (which might be challenged as well) will be the first or the fastest to bounce back.
Supports for Nifty are at 22113, 21722, 21145 and finally 20767.
Resistances for Nifty will be at 22214, 22306, 22421 and 22513.
Disclaimer: The Purpose of this analysis is purely for Education. Any decision to invest in shares of F&O should not be taken based on it. This is just to show you how technical analysis works.

NIFTY TREND AND SUPORTS THIS SUPPORT AND RESISTENCE ARE VERY IMP
TRED MINI STOPLOSS AND ENJOY TRADING JOURNEY

NIFTY- Intraday Levels - 16th April 2024If NIFTY sustain above 22 284 then 22 339 to 22 377 above this bullish then 22 426 to 22 486 then 22 606 to 22 666 above this more bullish
If NIFTY sustain below 22 191 then 22 105 then 22 061 to 22 017 then 21 947 (Strong level) then 21 912 to 21 887 then 21 832 to 21 788 then 21 664 to 21 639 or 21 639 below this more bearish.
Consider some buffer points in above levels.
Please do your due diligence before trading or investment.
**Disclaimer -
I am not a SEBI registered analyst or advisor. I does not represent or endorse the accuracy or reliability of any information, conversation, or content. Stock trading is inherently risky and the users agree to assume complete and full responsibility for the outcomes of all trading decisions that they make, including but not limited to loss of capital. None of these communications should be construed as an offer to buy or sell securities, nor advice to do so. The users understands and acknowledges that there is a very high risk involved in trading securities. By using this information, the user agrees that use of this information is entirely at their own risk.
Thank you.

Rising wedges in Nifty 50. Nifty 50 Index has formed rising wedges and a bearish divergence on 2 hourly chart.
Breakdown from 22620 levels may result in a significant correction in this index.
Entry: 22620
Stoploss: 22720
Targets: 22475, 22333, 22130.

NIFTY Monthly Positional VIew @16-04-2024NIFTY Monthly Positional VIew
Everything is Very Clear on Charts, Wait for the Best Opportunity,
Stay tune here for Next Update
Always Trade What You See not What You Feel........
"Be Fearful when others are Greedy and Greedy only when others are Fearful " - Warren Buffett
John Maynard Keynes said, “the markets can remain irrational longer than you can remain solvent.” So be cautious and flexible as market conditions evolve.
Than You Universe 🙏🙏🙏💐 Thanks to all my Teachers ....🙏🙏🙏💐

Market View: 16 Apr 24Market View: 16 Apr 24
1. Weakness in the global markets continues due to Middle-East crisis while oil and gold are making fresh highs.
2. FIIs + DIIs are reducing their long positions in Index Futures.
3. Despite DIIs buying more than FIIs in cash segment, market still ended the day at new weekly low.
4. It is expected that if market scales up some points during the day, fierce selling will start which will bring the market down again.
5. Keep watching Option Scalper chart to see when the price comes out of Consolidation zone.
6. Happy Trading.

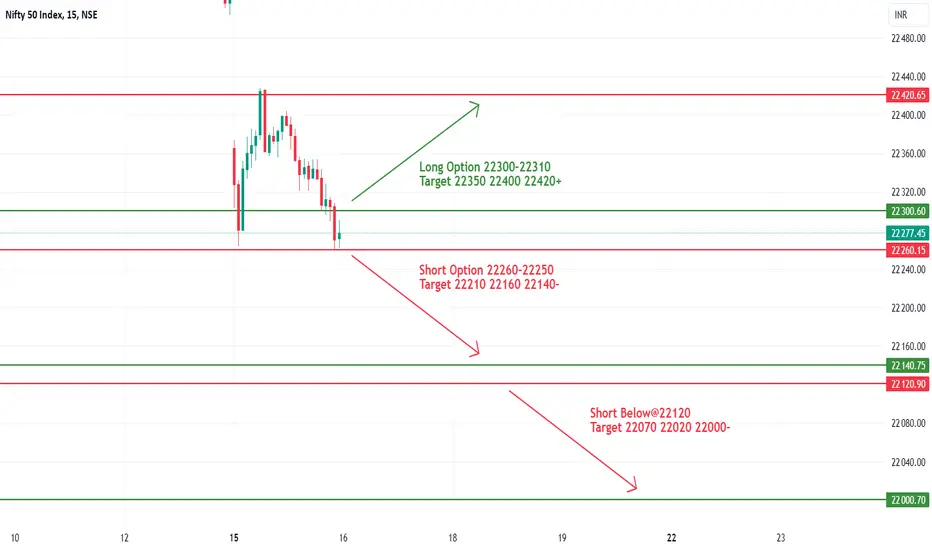
#NIFTY Intraday Support and Resistance Levels -16/04/2024Nifty will be gap down opening in today's session. After opening nifty start trading Below 22260 level and then possible downside rally up to 22140 & this rally can extend another 120 points if market gives breakdown 22120 level in today's session. in case nifty trades Above 22300 level then the upside target can go up to the 22420 level.
Market Outlook:Market Outlook:
The factors related to Israel and Iran Conflict will e the leading cause for market and moves rather than other local or Techincal factors for the next few days it seems. However the Support and Resistance levels seem to be as under.
Nifty Resistance: In case there is some positive news of tension related to conflict decreasing will be at 22424, 22534 and 22620.
Nifty Supports: In case there is further escalation in conflict which looks more likely will be at 22622, 22112(Major support from where Nifty can bounce), 22008, 21711.3. If 21711.3 is broken we can see the levels of 21149 or even 20753.
Shadow of the candle is negative and anyway Global factors specially Iran and Israel will be decisive force driving the Nifty for next few days it seems.

NIFTY: Trading Levels and Plan for 16-Apr-2024Scenario 1: Gap Up Opening (Above 22350)
If NIFTY opens with a gap up above 22350, watch for potential resistance near 22390. A rejection at this level could lead to a drop below 22340. Consider a short entry if prices start trading below 22340 with a stop loss at 22400. Targets for this downside move are 22245 – 22178. Expect a bounce within this range. However, sustained trading above 22390 could push prices higher towards 22445 – 22470 and potentially 22517 if above 22480.
Scenario 2: Flat Opening
In case of a flat opening, anticipate a drop towards 22245 – 22200 – 22178 levels. If prices recover and start trading above 22245, consider a buy trade with a stop loss at 22200. Upside targets would then be 22350 – 22390 – 22445. Conversely, if prices break below 22178 and sustain below 22160, expect a decline towards 22000 – 21950 – 21937.
Scenario 3: Gap Down Opening (Below 22200)
For a gap down opening below 22200, look for buying opportunities near 22180 with a stop loss at 22150. Targets for this upside move would be 22250 – 22350 – 22390. However, if prices fail to hold 22150, anticipate a drop towards 22000 – 21937.
Conclusion for NIFTY:
Keep a close eye on key levels and trade cautiously based on price action. Adapt strategies according to how prices behave around critical support and resistance levels.
Disclaimer:
Trading involves risk and these are speculative predictions. It's advisable to use these levels as a reference alongside your own analysis and risk management strategy.

NIFTY DAILY - 15/4/2024Nifty opens huge gap down due to global cause.
Another 250 points which is around 1% nifty was down(A market drop of nearly 500 points in just two days).
Nifty has formed red body candle with long upper shadow which indicates participants were selling from lower end and made days low that is 22259.
MACD is on urge of Crossdown.
Nifty broken the support of 22364 so, further support will be near 22242 with resistance of 22351 level.
Today’s Advance Decline ratio of NIFTY50
Advance - 6
Decline - 44
FII Sell – 3268 crores
DII Buy + 4762.93 crores.
⚠️ Important: Always maintain your Risk & Reward Ratio.
✅Like and follow to never miss a new idea!✅
Disclaimer: I am not SEBI Registered Advisor. My posts are purely for training and educational purposes.
Eat🍜 Sleep😴 TradingView📈 Repeat 🔁
Happy learning with trading. Cheers!🥂


NiftyCurrent Trade: Long Nifty at 22400-22500 with stop loss of 22239 and target of 23139
Next Trade (2): Short Nifty at 23200-23500 with stop loss of 23679 and target of 21609

Nifty50/ a correction or a crash ?The Elliott counts looks to be complete on Nifty50. There is expected a correction or crash nearby. D waves is a system that helps us to identify accurate Elliott count . This is not financial advise. do your own research before making an investment decision.

NIFTY S/R for 16/4/24Support and Resistance Levels: In technical analysis, support and resistance levels are significant price levels where buying or selling interest tends to be strong. They are identified based on previous price levels where the price has shown a tendency to reverse or find support.
Support levels are represented by the green line and green shade, indicating areas where buying interest may emerge to prevent further price decline.
Resistance levels are represented by the red line and red shade, indicating areas where selling pressure may arise to prevent further price increases. Traders often consider these levels as potential buying or selling opportunities.
Breakouts: Breakouts occur when the price convincingly moves above a resistance level (red shade) or below a support level (green shade). A bullish breakout above resistance suggests the potential for further price increases, while a bearish breakout below support suggests the potential for further price declines. Traders pay attention to these breakout signals as they may indicate the start of a new trend or significant price movement.
Disclosure: I am not SEBI registered. The information provided here is for learning purposes only and should not be interpreted as financial advice. It is important to consult with a qualified financial advisor before making any investment decisions. Tweets neither advice nor endorsement.

Nifty and Bank Nifty analysis for tomorrow, Tuesday. 15th AprilNifty and Bank Nifty analysis and trade plan for tomorrow, Tuesday. 15th April
Hello, my name is Rahul Bora, I am an intraday trader from Assam, every day I try to share my trade plan for next day, for Nifty and Bank Nifty based on Fibonacci levels and price action only. Whatever I share in these videos, are purely my personal opinion, and not a trade advice in any sense. Viewers are advised to take their trades based on self analysis and own risk taking capacity only.

Nifty Support&Resistance Levels for 12th April Friday.Nifty is in rising channel pattern now at top of the channel if 22800 rejects or a gap down opens and sustains below 22650 Nifty can see 22550-22500 levels.Market is overbought a dip and resumes uptrend in my view.
Support are 22650-22675,22550-22500,22420,22380.
Resistance are 22800,22870,22900,22950,23000.
Note:-Mentioned Support&Resistance levels can act as reversal points.
