Nifty 50: Namo NamahBuy on Rumour
Sell on News
Indian Markets are poised very interestingly for the June 4th Results.
NIFTY trade ideas

Trap!Looks like Nifty has walked straight into a spot marked with a big X like in the KGF2 movie. And is waiting to be shot down by bear cartel. This is the narrative that played out in my head.
Nifty could either consolidate OR fall from here.
On the contrary of Nifty Gaps up OR there is fresh buying in some heavy weights, good enough to make 22500 sellers run for cover, then we could see an unprecedented rally.

NIFTY TRADING LEVELS FOR 17-05-2024Explanation:
This is a very useful trading system. This means that you should not take a trade blindly, but rather that there is another confirmation to take the trade you can use this for perfect entry and perfect exit
This trading opportunity is based on volume, previous price, and price range , are included
Entry/Exit point's:
- It has very easy entry and exit points
- In this pair of lines with two colors are given (RED AND BLUE)
- In this the blue line is used to take long entry and the red line is used to take short entry (But it is all based on a more conformation from your trading plan)
Stop Loss/Take Profit:
Stop Loss
- According to this, if you take a long trade, its stop loss will be the red line just below ( A trade can exit either when the price crosses the red line or the 5 minute candlestick crosses the red line. (This can be done according to your preference) )
- A short entry should use the opposite rules to a long entry
Take Profit
-When you take a long entry according to the profit to be booked is on the next red line above. ( Or if there are other reasons, it can be a safe exit )
- Opposite rules for booking profit on long entry are to book profit on short trade. ( The blue line above is the stop loss of short entry )
Timeframe:
According to this, the time frame you should use while taking trades is 5 minutes time frames . (5 minute time frame works well in this)
Risk Disclaimer:
Trading carries significant risk and is not suitable for all traders. You may lose some or all of your capital in a matter of minutes or hours. Market conditions can change rapidly, and prices can move against you quickly. You may not always be able to exit at a favorable price, and you may be required to hold a position overnight, exposing yourself to additional risk. Day trading involves high risk, high leverage, and high stakes, and you should only trade with funds you can afford to lose. Please carefully consider your financial situation, risk tolerance, and trading objectives before engaging in day trading.
Engagement:
Share your insights, ask questions, and learn from others in the community. Whether you're a seasoned pro or just starting out, we're all in this together.
What's your take on the current market conditions? Which trading strategies are working for you? Let's discuss and help each other grow as traders!
Comment below and let's get the conversation started!
Original Content:
This trading setup is the result of my own innovation and expertise, and is not based on any publicly available information or third-party systems. It is a reflection of my dedication to developing a competitive edge in the markets.

#NIFTY Intraday Support and Resistance Levels -17/05/2024Nifty will be gap up opening in today's session. After opening nifty sustain above 22420 level and then possible upside rally up to 22540 level in today's session. in case nifty trades below 22370 level then the downside target can go up to the 22250 level.

NIFTY: Elections Expiry n ExitNifty, the price action perfectly fails around the supply zone and descends more than what we anticipated.
At one time it looked it would end much deeper and stronger, the two-way ferocity of the move for sure to unsettle the players of all kinds, save those who did nothing.
The up move has been from all counters and not limited to any, most importantly certain sector has bounced from the range low, certain sectors have broken the recent low and created near term double bottom for example the IT.
Markets absorbed the US Inflation data, also the expectation of rate cuts in Europe decelerate, on the margin impacting the dollar moves.
This morning Chinese data prints robust Industrial production, which can be positive for Stronger trade related economies like Australia and commodities. Retail sales slag but unemployment falls. Net, no further monetary or fiscal accommodation one can expect from China.
The growing concern, if any can turn out, the relative attraction of China Vs India, is that the reason FII selling, no one knows, but it remains a fact, markets are way too pessimistic on China, while on the broader trajectory we remain on the upside on the long run.
Not much of data, weekend, Monday holiday, ideally markets should be far lacklustre than seen, save a few counters here and there. Prepare for the month end expiry than anything else.
On the graph, the up-move has been sharp and thus a tint of bear bias left, but not enough to turn much deeper. The new range is tad higher 22230-22530

Remarkable Comeback Nifty but now faces Mid-channel resistance.Nifty recovered handsomely 349.85 points from the low of the day in the last hour against all frantic FII selling. This shows the power of DII and retail investors. Now Nifty faces a tough mid channel resistance 22438 which will take some doing to cross it. If Nifty manages to cross 22438 the next resistances will be at 22496, 22587, 22658, 22730 and 22801. If Nifty is not able to cross the Mid channel resistance the supports will be at 22298, 22215 and 22054. Nifty will be very weak below 22054. Shadow of the candle is looking neutral to negative but if FII jump into action (which unlikely) then frantic upside is possible. Volatility and peak tussle between FII and DII might continue.

NIFTY INTRADAY LEVELS FOR 17 MAY 2024BUY ABOVE - 22420
SL - 22350
TARGETS - 22470,22510,22550
SELL BELOW - 22350
SL - 22300
TARGETS - 22300,22230,22160
NO TRADE ZONE - 22350 to 22420
Previous Day High - 22420
Previous Day Low - 22060
Based on price action major support & resistance's are here, the red lines acts as resistances, the green lines acts as supports. If the price breaks the support/resistance, it will move to the next support/resistance line. White lines indicates previous day high & low, high acts as a resistance & low acts as a support for next day.
Trendlines are also significant to price action. If the price is above/below the trendlines, can expect an UP/DOWN with aggressive move.
Please NOTE: this levels are for intraday trading only.
Disclaimer - All information on this page is for educational purposes only,
we are not SEBI Registered, Please consult a SEBI registered financial advisor for your financial matters before investing And taking any decision. We are not responsible for any profit/loss you made.
Request your support and engagement by liking and commenting & follow to provide encouragement
HAPPY TRADING 👍

NIFTY Trading Plan: May 17th, 2024
Market Outlook: Following a volatile "dot-to-dot" session on Thursday, NIFTY may experience a pause in activity on Friday, May 17th. This plan outlines potential trading strategies based on various opening scenarios.
Trading Strategies:
Gap Up Opening:
Entry: If NIFTY opens above 22450 and finds support at 22435, consider a long trade.
Target 1: 22517 (potential resistance zone with sideways movement likely).
Target 2: If prices surge past 22530, an upward trend towards 22600-22608 is possible.
Contingency: If the opening surge fizzles and prices decline, look for support at 22331-22308. Consider entering a buy trade at these levels.
Flat Opening:
Entry: Initiate a long trade with support at 22334-22308.
Target: Aim for the initial range of 22435-22517.
Short Recommendation: No short positions are recommended for this scenario.
Gap Down Opening:
Entry: If NIFTY opens below 22300, identify a buying opportunity above 22308-22310.
Stop-Loss (SL): Place a stop-loss order at 22260 to manage risk.
Target: Look for price recovery towards 22400-22435-22517.
Short Caution: Avoid shorting unless prices definitively break below 22050 and sustain that level.
Conclusion:
This plan prioritizes buying opportunities across different opening scenarios. Short positions are generally discouraged unless specific lower support levels are breached. Remember, this is a guide, and market conditions can change rapidly. Adapt your strategy based on your risk tolerance and real-time market analysis.
Disclaimer: This information is for educational purposes only and should not be considered financial advice. Please consult with a qualified financial professional before making any investment decisions.

Nifty crash possibility People were waiting for market crash last week. Now after a joyous 300pts rally, market is loaded with long contracts, fantastic liquidity for institutions to accumulate short positions.
Tomorrow they will begin to let the market slide. 22300 to 22250 is crucial. Retailers failing to hold the market there will result is stoploss triggers and panic selling.
Candle stick, price action with respect to trendlines, behaviour of the trend, I see several indications for the beginning of a crash.

Daily market analysis tomorrow 17th MayDaily Show on NIFTY, BANKNIFTY, FINNIFTY and USDINR, where we try and predict the market direction for tomorrow by technical analysis, Open Interest (OI) data analysis, FII DII data analysis and much more. This show gives insights into the market and is especially useful if you are a beginner who has just started options trading and wants to learn how to trade using price action and other chart techniques.
Disclaimer: This is not an investment recommendation, advice, research report, or stock tip of any nature. We are doing this only to understand how to read derivative data and perform technical analysis. Strictly for educational purposes only.
#nifty50 #banknifty #nifty50prediction #usdinr #optionstradingstrategy #technicalanalysis #tradingforbeginners #niftyprediction #sharemarkettrading #marketpredictiontoday #priceaction #usdinrprediction #niftytechnicalanalysis #tradingchartanalysis #usdinrtradingstrategytomorrow #openinterest

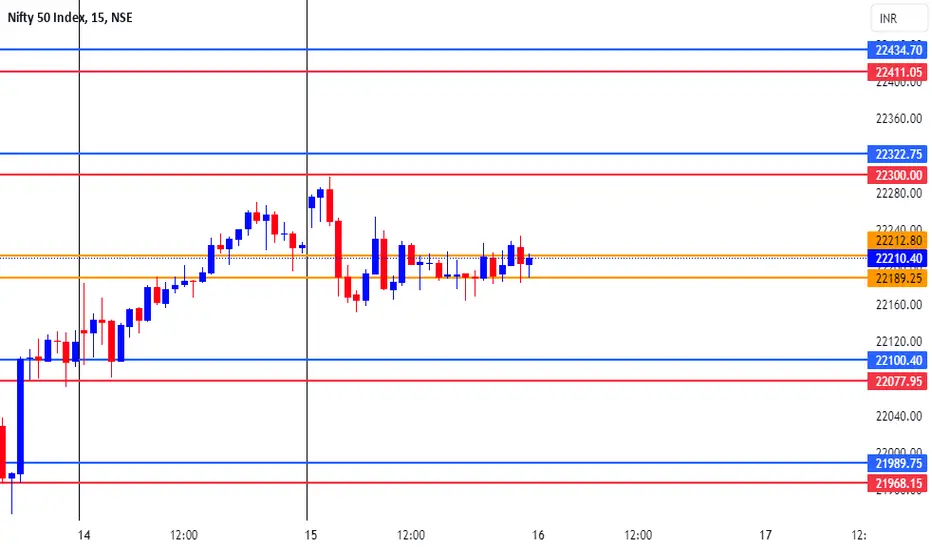
NIFTY DAILY - 16/5/2024Nifty opens with positive note but bears took the market to low of the day which is 22054 with almost -160 points, into last one hour’s bulls were trying to stretch their arms and took nifty to high of the day which is 22432 level with almost up by 203 points (+0.92%).
Nifty has formed bullish candle with long lower shadow which indicates participants were buying from day lower level.
Currently RSI is around 53.
Nifty has broken the resistance of 22273 and able to hold above 22400 so next resistance can be 22556 level with support of 22286 level.
Bank Nifty levels
Support – 47305 Resistance – 48110
Today’s Advance Decline ratio of NIFTY50
Advance - 38
Decline - 12
FII Sell – 776.49 crores
DII Buy + 2127.81 crores.
⚠️ Important: Always maintain your Risk & Reward Ratio.
✅Like and follow to never miss a new idea!✅
Disclaimer: I am not SEBI Registered Advisor. My posts are purely for training and educational purposes.
Eat🍜 Sleep😴 TradingView📈 Repeat 🔁
Happy learning with trading. Cheers!🥂

NIFTY S/R for 17/5/24Support and Resistance Levels: In technical analysis, support and resistance levels are significant price levels where buying or selling interest tends to be strong. They are identified based on previous price levels where the price has shown a tendency to reverse or find support.
Support levels are represented by the green line and green shade, indicating areas where buying interest may emerge to prevent further price decline.
Resistance levels are represented by the red line and red shade, indicating areas where selling pressure may arise to prevent further price increases. Traders often consider these levels as potential buying or selling opportunities.
Breakouts: Breakouts occur when the price convincingly moves above a resistance level (red shade) or below a support level (green shade). A bullish breakout above resistance suggests the potential for further price increases, while a bearish breakout below support suggests the potential for further price declines. Traders pay attention to these breakout signals as they may indicate the start of a new trend or significant price movement.
Disclosure: I am not SEBI registered. The information provided here is for learning purposes only and should not be interpreted as financial advice. It is important to consult with a qualified financial advisor before making any investment decisions. Tweets neither advice nor endorsement.

NIFTY BEAR SETUP WILL WORK?A break below 22300 would be good for a 240 points move off here with an invalidation point of 120 points giving a good 1:2 R:R setup

Nifty Nifty traded in 400 points.
India vix is 20.
Monthly PCR above 1 shows bulls are active.
Important support and resistance mark on chart.
Buy above 22350 sell 22150.

NIFTY- Intraday Levels - 15th May 2024*Major Levels only*
If NIFTY sustain above 22310 then 22342 then 22377 to 22393 above this bullish, then 22572 to 22604 then 22649 to 22666 above this more bullish
If NIFTY sustain below 22121 or 22105 then 22081 to 22049 below this bearish then 21849 to 21832 then 21819 to 21787 below this more bearish
Consider some buffer points in above levels.
Please do your due diligence before trading or investment.
**Disclaimer -
I am not a SEBI registered analyst or advisor. I does not represent or endorse the accuracy or reliability of any information, conversation, or content. Stock trading is inherently risky and the users agree to assume complete and full responsibility for the outcomes of all trading decisions that they make, including but not limited to loss of capital. None of these communications should be construed as an offer to buy or sell securities, nor advice to do so. The users understands and acknowledges that there is a very high risk involved in trading securities. By using this information, the user agrees that use of this information is entirely at their own risk.
Thank you.

Nifty - Expiry Ending 16th May 2024Nifty has broken down the channel and can go to much lower levels. But I will wait for the support near 21750 as shown in the chart plan. A breakdown will give target till 21000 and bounce will give target of 22400. I will not take a trade at any other point and will avoid taking trade if nifty does not work as per my plan. No rush to trade whether nifty suddenly goes 1000 points up or down. Only trade if it fits your plan. Thank you!
-------------------------------------------------------
INSIGHTS:
-------------------------------------------------------
As usual, I will keep sharing my insights which are based on my personal experience in trading.
1. Please stop watching foreign markets, it won't help but will corrupt your viewpoint and ultimately you will either lose an opportunity or make a loss.
2. Market will not keep taking SL again and again, it has to decide a trend after some time. But if it takes 2-3 SL, just stop and wait for another opportunity.
3. In case you have 2-3 SL hits, immediately stop looking at market, leave your computer, watch some movies or go some place with family or do any other leisure activities, but just get the market out of your head, believe me it helps a lot.
4. If there is a SL, DO NOT THINK TWICE, JUST EXIT, IT IS JUST 20-30 POINTS, you will be getting 100 - 300 points in another trade if you simply take SL this time without thinking twice. But if you show ego to market or think that let me watch for some time, you will definitely regret it. Sometimes you may be right, but that will be just pure luck and gambling.
5. Trade with long term view point, even if you are initiating an intraday, have a weekly viewpoint, so that you will have conviction to either carry forward or just exit if you are not convinced.
-------------------------------------------------------

NIFTY BOUNCES from the ASTRA LineWe have been holding the LONG position (CE) from our entry on 14th morning.
The price saw a downward movement today exactly touching the Risological Astra line and taking a bounce back upwards.
Market has overall bullish sentiments especially considering the fact that the election results are nearing and this bullish momentum could be a hidden bullish divergence that we are going to see the next day after the election result.
BJP wins = Market Bullish
INDI Alliance wins = Market Crash
So, big moves are coming soon in the market. Hold your breath, homies!

Why am I still not bullish in Nifty and Bank NiftyYup, I am still not bullish. Watch this video to understand my analysis of the pre-opening chart of Nifty and Bank Nifty.
#Nifty #Banknifty

NIFTY TRADING LEVELS FOR 16-05-2024Explanation:
This is a very useful trading system. This means that you should not take a trade blindly, but rather that there is another confirmation to take the trade you can use this for perfect entry and perfect exit
This trading opportunity is based on volume, previous price, and price range , are included
Entry/Exit point's:
- It has very easy entry and exit points
- In this pair of lines with two colors are given (RED AND BLUE)
- In this the blue line is used to take long entry and the red line is used to take short entry (But it is all based on a more conformation from your trading plan)
Stop Loss/Take Profit:
Stop Loss
- According to this, if you take a long trade, its stop loss will be the red line just below ( A trade can exit either when the price crosses the red line or the 5 minute candlestick crosses the red line. (This can be done according to your preference) )
- A short entry should use the opposite rules to a long entry
Take Profit
-When you take a long entry according to the profit to be booked is on the next red line above. ( Or if there are other reasons, it can be a safe exit )
- Opposite rules for booking profit on long entry are to book profit on short trade. ( The blue line above is the stop loss of short entry )
Timeframe:
According to this, the time frame you should use while taking trades is 5 minutes time frames . (5 minute time frame works well in this)
Risk Disclaimer:
Trading carries significant risk and is not suitable for all traders. You may lose some or all of your capital in a matter of minutes or hours. Market conditions can change rapidly, and prices can move against you quickly. You may not always be able to exit at a favorable price, and you may be required to hold a position overnight, exposing yourself to additional risk. Day trading involves high risk, high leverage, and high stakes, and you should only trade with funds you can afford to lose. Please carefully consider your financial situation, risk tolerance, and trading objectives before engaging in day trading.
Engagement:
Share your insights, ask questions, and learn from others in the community. Whether you're a seasoned pro or just starting out, we're all in this together.
What's your take on the current market conditions? Which trading strategies are working for you? Let's discuss and help each other grow as traders!
Comment below and let's get the conversation started!
Original Content:
This trading setup is the result of my own innovation and expertise, and is not based on any publicly available information or third-party systems. It is a reflection of my dedication to developing a competitive edge in the markets.
NIFTY: Cues Overseas, Woes Local!After large fall, three days of up move, classical corrective move that ensured yesterday. One may say negligible, but it still provided near 140 points move from high to low.
The much-anticipated Inflation data out, it is tad below expectations. What is interesting is markets will do what they like, irrespective what data suggests as long as data is within the periphery.
The inflation is above 3% near three years, the real interest rates are still accommodative, don't expect FED to rush and cut rates. 2024 is a slow fade as we navigate.
With commodities of all sorts showing raring to the upside, the job of inflation management is not going to be easy, prepare for stagflation, a win win for all. Higher nominal prices are a sure shot of tax mop up, which in turn aids to bridge the interest rate gap.
The trade deficit data comes out, the exports are anything but worrying. Finally, it is hitting our shores, the total dependency is on domestic. So, watch out those sectors that are weak in their exports.
With the festival of democratic elections still on, markets may not take one side breach as yet. The WPI inflation also higher, SBI raises deposit rates.
From the technical stand point 22330-380 are the supply zone and any raise expected to face hurdle while the 22130 is holding the support thus large range of 22130-22330, inclined the failure of rise to the top than otherwise. Cluster of Moving averages dotted horizontal lines and sloping supply lines ideally should hold the force of up move, FII's continue to be sellers and DII might take todays rise as an opportunity to lighten.
Supports 22150-22130-22080
Supply 22280-22330-22365

Nifty Analysis Nifty analysis for positional trading
stocks specific analysis for positional trading

NIFTY Trading Plan for 16-May-2024
This trading plan outlines potential entry and exit points for NIFTY based on different opening scenarios on May 16th, 2024. Remember, this is for informational purposes only and should not be considered financial advice.
Opening Scenarios:
1. Gap Up Opening Above 22,300
Long Entry: If the price sustains above 22,310, consider a long trade with a stop-loss (SL) at 22,260 and targets of 22,400-22,435.
Short Entry: If the price fails to hold above 22,300 and falls below 22,224 within the first hour, consider a short trade with an SL at 22,270 and targets of 22,129-22,101 and 22,086.
2. Flat Opening
Long Entry: If the price opens flat and trades lower, then sustains below 22,170 for the first hour, consider a short trade with an SL above 22,270 and targets of 22,101-22,050.
Conversely, if the price opens flat and trades higher, then sustains above 22,250 after the first hour, consider a long trade with an SL at 22,210 and targets of 22,300-22,370 and 22,435.
3. Gap Down Opening Below 22,150
Long Entry: Look for a long entry opportunity near 22,129-22,101 with an SL of 22,080 and targets of 22,300-22,350.
Short Entry: If the price falls and sustains below 22,140, this level (22,140) could become a good buying opportunity due to the favorable risk-reward ratio.
Conclusion:
This plan provides a framework for potential entry and exit points based on different opening scenarios. Remember, the market is dynamic, and these are just possibilities. Always conduct your own research and analysis before making any trading decisions.
Disclaimer:
Trading involves inherent risks. This information is not financial advice and should not be interpreted as such.
Additionally, here are some general trading tips to consider:
Manage your risk: Always use stop-loss orders to limit potential losses.
Don't chase trades: If you miss an entry point, don't try to force a trade later.
Stay disciplined: Stick to your trading plan and avoid emotional decisions.

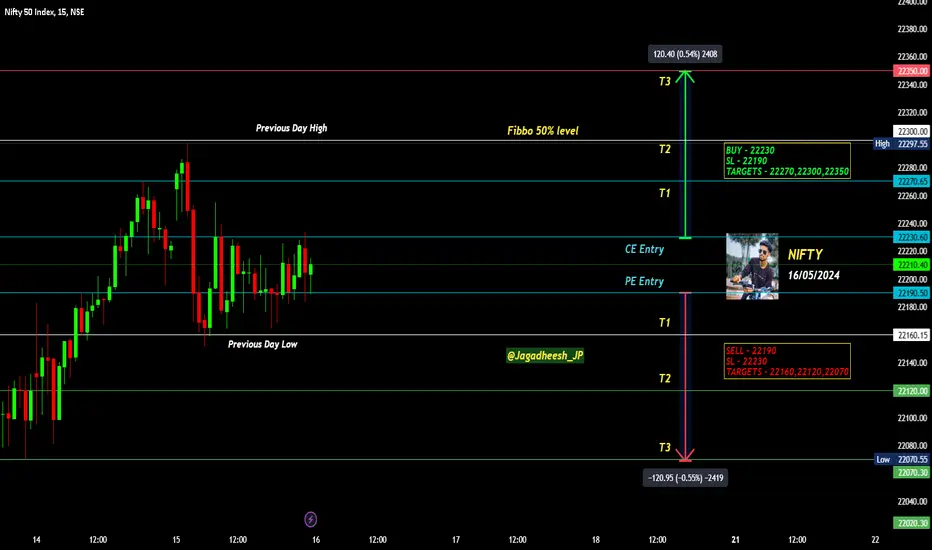
NIFTY INTRADAY LEVELS FOR 16 MAY 2024BUY ABOVE - 22230
SL - 22190
TARGETS - 22270,22300,22350
SELL BELOW - 22190
SL - 22230
TARGETS - 22160,22120,22070
NO TRADE ZONE - 22190 to 22230
Previous Day High - 22300
Previous Day Low - 22160
Based on price action major support & resistance's are here, the red lines acts as resistances, the green lines acts as supports. If the price breaks the support/resistance, it will move to the next support/resistance line. White lines indicates previous day high & low, high acts as a resistance & low acts as a support for next day.
Trendlines are also significant to price action. If the price is above/below the trendlines, can expect an UP/DOWN with aggressive move.
Please NOTE: this levels are for intraday trading only.
Disclaimer - All information on this page is for educational purposes only,
we are not SEBI Registered, Please consult a SEBI registered financial advisor for your financial matters before investing And taking any decision. We are not responsible for any profit/loss you made.
Request your support and engagement by liking and commenting & follow to provide encouragement
HAPPY TRADING 👍