NIFTY trade ideas

NIFTY Trading Levels and Plan for 03-04-2024:
If the NIFTY index opens with a gap up above 22500 and manages to sustain, it may encounter resistance around 22547 – 22568. A breakthrough above this range could potentially drive prices to new highs around 22600 – 22626. Conversely, breaking below the lower range of this resistance zone might trigger profit booking, leading prices down to levels of 22458, 22400, and 22350.
In the event of a flat opening, a potential downward movement may occur within the range of 22498 – 22464, with possible extensions down to 22381-22367. Below 22350, further decline could be expected towards 22339 – 22320. This range could act as support for a reversal, presenting a buying opportunity with a stop loss at 22270 and targets at 22400 – 22450- 22500. Should prices sustain above 22500 after a flat opening, they may target levels of 22547 – 22568- 22600 – 22626.
On a gap down opening below 22400, traders might consider a buying opportunity near 22320 – 22300, with a stop loss below 22270 and initial targets at 22380 – 22400 – 22450. However, failing to hold support at 22270 could lead to a sharp drop towards 22197 – 22100.
Disclaimer: The trading levels and plan provided above are based on technical analysis and market observations. Traders should conduct their own research and analysis or consult a financial advisor before making any trading decisions.

Nifty levels (for 02-04-2024)Nifty levels (for 02-04-2024)
Key factors:
I use 2 hour's period. As per my research, Nifty is smoothened only in this period. So, tomorrow I expect Nifty will oscillate (consolidate) up to 11 am. Afterwards, it will give the trend direction.

NIFTY DAILY - 2/4/2024Nifty open flat and made days high 22497 level buy didn’t sustain that level.
Index has formed another Doji candle on the daily chart at the top of the market which indicates thug of war between buyers and sellers as today’s closing was near the opening levels.
So, further levels for nifty will be 22336 will work as support level and 22520 will work as resistance level.
Today’s Advance Decline ratio of NIFTY50
Advance - 28
Decline - 22
FII Sell – 1622.69 crore
DII Buy + 1952.72 crore.
⚠️ Important: Always maintain your Risk & Reward Ratio.
✅Like and follow to never miss a new idea!✅
Disclaimer: I am not SEBI Registered Advisor. My posts are purely for training and educational purposes.
Eat🍜 Sleep😴 TradingView📈 Repeat 🔁
Happy New Financial Year 🚀
Happy learning with trading. Cheers!🥂

Daily market analysis for Tuesday 3rd AprilDaily Show on NIFTY, BANKNIFTY, FINNIFTY and USDINR, where we try and predict the market direction for tomorrow by technical analysis, Open Interest (OI) data analysis, FII DII data analysis and much more. This show gives insights into the market and is especially useful if you are a beginner who has just started options trading and wants to learn how to trade using price action and other chart techniques.
Disclaimer: This is not an investment recommendation, advice, research report, or stock tip of any nature. We are doing this only to understand how to read derivative data and perform technical analysis. Strictly for educational purposes only.
#nifty50 #banknifty #nifty50prediction #usdinr #optionstradingstrategy #technicalanalysis #tradingforbeginners #niftyprediction #sharemarkettrading #niftytomorrow #marketpredictiontoday #priceaction #usdinrprediction #niftytechnicalanalysis #tradingchartanalysis #usdinrtradingstrategytomorrow #openinterest

Nifty 50- April ViewNIFTY 50-
This Channel is intact. Monthly Resistances are 22700 & 23000. Current month CPR is wide, hence as per theory, index should test the CPR and move Higher till R1. if it is extremely bullish then R2.
Pull back will test moving average as well. I definitely buy Nifty @ 22200 with a SL.
How to Trade this Range in April.
22250 CE- 1 Lot- Buy
22700 CE- 2 Lot- Sell
22000 PE- 1 Lot- Sell
Break Even @ Expiry- 22256, 23144 (Lower Level is @ Pivot) If Nifty closes below Pivot I will close this trade.
Margin required 1.65 Lacs (Max profit 22k)
Disclaimer
The information and publications are not meant to be, and do not constitute, financial, investment, trading, or other types of advice or recommendations supplied or endorsed by Me.

Nifty 50- March UpdateNifty is Trading in a Range. Likely to trade in a range.
All Sectors are at all time high except IT, FMCG, NIFTY BANK.
I am Cautious in this Month.
How to trade this Range in March?
22600 CE - 1 Lot-Buy
23000 CE - 2 Lot-Sell
21500 PE - 1 Lot Sell
Break Even @ expiry - 21500 - 23400 (Lower level is near Jan close)
Margin Required- 1.5 Lacs (Max Profit - 20k (bullish expiry))
Disclaimer
The information and publications are not meant to be, and do not constitute, financial, investment, trading, or other types of advice or recommendations supplied or endorsed by Me.

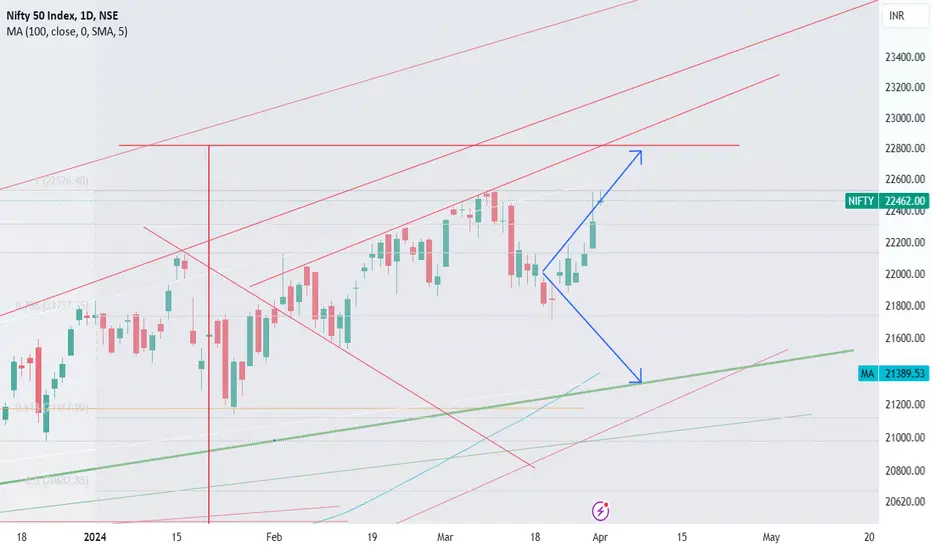
Nifty looks exhausted, Fake breakout and then fall approx 10%Current structure of Nifty looks like sooner or later it is ready for a cool down. Based on current chart pattern I think of 2 possibilities in near future.

NIFTY- Intraday Levels - 1st April 2024** Level for Index -
If NIFTY sustain above 22326 then 22410 to 22418 then 22459 then 22516 then 22547 to 22590 above this more bullish.
If NIFTY sustain below 22326 then 22272 to 22242 then 22135 then 22075 then 22026 to 21989 below this more bearish.
Consider some buffer points in above levels.
Please do your due diligence before trading or investment.
**Disclaimer -
I am not a SEBI registered analyst or advisor. I does not represent or endorse the accuracy or reliability of any information, conversation, or content. Stock trading is inherently risky and the users agree to assume complete and full responsibility for the outcomes of all trading decisions that they make, including but not limited to loss of capital. None of these communications should be construed as an offer to buy or sell securities, nor advice to do so. The users understands and acknowledges that there is a very high risk involved in trading securities. By using this information, the user agrees that use of this information is entirely at their own risk.
Thank you.

NIFTY S/R for 3/2/24Support and Resistance Levels: In technical analysis, support and resistance levels are significant price levels where buying or selling interest tends to be strong. They are identified based on previous price levels where the price has shown a tendency to reverse or find support.
Support levels are represented by the green line and green shade, indicating areas where buying interest may emerge to prevent further price decline.
Resistance levels are represented by the red line and red shade, indicating areas where selling pressure may arise to prevent further price increases. Traders often consider these levels as potential buying or selling opportunities.
Breakouts: Breakouts occur when the price convincingly moves above a resistance level (red shade) or below a support level (green shade). A bullish breakout above resistance suggests the potential for further price increases, while a bearish breakout below support suggests the potential for further price declines. Traders pay attention to these breakout signals as they may indicate the start of a new trend or significant price movement.
Disclosure: I am not SEBI registered. The information provided here is for learning purposes only and should not be interpreted as financial advice. It is important to consult with a qualified financial advisor before making any investment decisions. Tweets neither advice nor endorsement.

Nifty Trend State along with Trend Strength !As the downside was detected on 11 march , strength started to buildup from 13th for bearish move .. and downside ended on 20th march , though the trend has been shifted to upside yet no strength is seen in upside rally along with negative divergence . Expecting a upside move tp trap buyers and then might see downside rally again !

Nifty and Bank Nifty analysis for tomorrow, Wednesday. 3rd AprilNifty and Bank Nifty analysis and trade plan for tomorrow, Wednesday. 3rd April
Hello, my name is Rahul Bora, I am an intraday trader from Assam, every day I try to share my trade plan for next day, for Nifty and Bank Nifty based on Fibonacci levels and price action only. Whatever I share in these videos, are purely my personal opinion, and not a trade advice in any sense. Viewers are advised to take their trades based on self analysis and own risk taking capacity only.

NIFTY INTRADAY IMPORTANT LEVELSAttention dear Traders!
Before you dive into the exhilarating world of trading, where fortunes are made and lost faster than you can say 'bull and bear', remember this: I am not your financial guru, wizard, or psychic hotline. My advice should be taken with a grain (or shaker) of salt, as I'm not a licensed financial advisor
Trading is like riding a rollercoaster blindfolded. It's thrilling, but you never know when you'll hit a loop-the-loop. The stock market is as predictable as a cat on catnip, and past performance is about as reliable as a weather forecast in the Bermuda Triangle. So, don your financial life jacket, do your own homework, and maybe even chat with a real human financial advisor.
Remember,Trading with your money is serious business, but it's okay to chuckle as you read this.

#NIFTY Intraday Support and Resistance Levels -02/04/2024Nifty will be gap up opening in today's session. After opening nifty sustain above 22500 level and then possible upside rally up to 22620 level in today's session. in case nifty trades below 22440 level then the downside target can go up to the 22320 level.

Nifty in a mild resistance zone after making a new ATH. Nifty in a mild resistance zone after making a new ATH. After making a new ATH at 22529.95. As it did not close successfully above the previous all time high that is 22526 it has become a mild resistance. Momentum is good for it to make a new ATH tomorrow but the resistance may act again if it is not a gap up opening above the same level. In case of Nifty not able to cross and close above the hurdle the supports will be at 22434 and 22350. 22214 to 22252 is a strong support zone as of now. Resistance zone will be 22500 to 22529. If that resistance is successfully taken down the next resistance will be near 22597, 22690 and finally 22787. Shadow of the candle is looking neutral but the momentum can be helpful.

Nifty Short , Medium & Long Term View- 02-Apr-24 to 05-Apr-24Nifty Short, Medium & Long Term View- 02-Apr-24 to 05-Apr-24
Nifty closed at 22462 on 01-Apr-24 (22096 on 22-Mar-24) and touched low & high of 21893 & 22517
RSI and stochastics levels have improved last week (61% & 92% Respectively).
Market was volatile in the month of March and in the end of the month started to increase.
Market touched new high on 01-Apr-24 (22522).
Refer to detailed comments in the bottom on market and election outcome.
Nifty IT 35042 (35188) - Nifty IT marginally decreased. To continue hold and buy on dips. Nifty IT touched 20 days before new high (38550) and started falling. Major support at 34918 /34000. Can add more at 33288 with Target 40000.
Nifty bank 47578 (46863) -To continue buy on dips. As expected Nifty Bank increased in the last 2 weeks. It is nearing the initial Target 48618 (All time high).
support is at 44598 if breaks major support at 43650 ( Fib Support). Purchase on Dips.
Nifty 22462- Short & medium term (Neutral)
Nifty moved up in the last week touched new high 22522. As mentioned for the past three weeks, Fibonacci extended resistance ( target) is near to 22819 which is the % of difference between Oct21 Peak -Jun22 Low from Oct 21 peak. nifty next target 22819 (Fib Resistance)/23000.
Short term Support - 21900, 21721 (Mar Low)
Medium term Support at 21554 (Fib Support),21300, 20877 Fib Support as shown in the chart.20225 (prev high), 20000 ( Fib Resistance)
Long Term
Market expected range bound between 23300 ( Trend Line Resistance till May 2024) to 19500 expected in 2024.
Q3 results are average except bank & Nbfc stocks, further up move will have target of 23150 ( Trend Line), 23500 ( Fib Resistance). Market Awaiting for the Q4 results to take a cue.
Comments :
Positive Lok Sabha Election result expectation, Global trend helped sustaining the market above 22000.
Recent Electoral bonds, CAA implementation news couldnt make the market down as market is confident that current govt will win more than halfway mark, continue govt post election without any additional support of other parties so that govt can be confident enough to take decisions.
Hence market is in good buy whenever there is a dip. Post Elections, only way Market will start grow higher by reduction of interest rate by RBI on a staggered manner till it reaches 5%. US fed rate reduction also expected from Jun/ Sep 2024. Market may correct if any global news till 19500 as there is strong multiple fib support in this range.
Earlier last 2-3 months, purchasing/holding Nifty IT at lower levels proved effective as the Nifty IT index as it moved up by 20%. Nifty IT posted flat or negative results in Q3. Nifty IT touched new high on 16-Feb-24 (38477). Target 40000.
Similarly despite nifty bank results for Q3 were good as expected, Nifty Bank index was down by 10% last three-Four weeks. Nifty Bank Index was suggested to buy two weeks before. Nifty Bank in nearing the target provided (48600). Nifty Bank Stocks / Bank Index can be purchased whenever it falls down. HDFC bank is now in buyable range, can be further bought if it further dips for Medium to Long Term. Continue to buy on dips.
As expected, stocks other than Banks have posted mixed results. Market can any time expected to turn volatile till elections in 2024 (Apr-May). Company Earning per share (EPS) are near to maximum level, expected policy / budgetary push to move up further in 2024. Individual stock pick will be the key in 2024.
Nifty view for April 1st weekNifty tomorrow - Apr 2: On Daily Nifty formed a Bearish Evening star pattern. For Long it needs to Open Gap Up above 22,525 (ATH). For Flat / Gap Down opening Nifty will come down slightly to take support at 22,330 and then Bounce. Remember I am still BULLISH on Nifty. the Bearish signal is only for Intraday or 1-2 days matter. Either it should bounce tomorrow itself or recover and create fresh ATH before Friday for sure

NIFTY Trading Analysis and Strategy for April 2, 2024
Gap-Up Opening:
In the event of a gap-up opening above 22500, sustaining above 22507 could propel prices towards 22551. At this juncture, a short position can be considered targeting levels around 22478-22450. However, if prices persist above 22551, an extension towards 22602 becomes plausible.
Flat Opening:
Should prices open flat, resistance is anticipated in the 22478-22507 range, potentially leading to a decline towards 22412-22402 and subsequently 22376-22365. Here, a buying opportunity may arise. Conversely, sustaining above 22507 could signal further upside momentum, targeting levels at 22551, 22602, and possibly 22700.
Gap-Down Opening:
In the scenario of a gap-down opening below 22400, a buying opportunity may emerge near 22376-22350, with a stop loss at 22320, targeting levels of 22469, 22478, and 22507. However, if prices persist below 22320, a downside continuation towards 22200 - 22198 is conceivable.

NIFTY DAILY - 1/4/2024Third winning strike of bulls and Nifty hit records high which is 22529 level.
Nifty open with a gap up but there was some profit booking from top.
Nifty has formed Gravestone Doji candle on daily chart.
(Tomorrow nifty should remain positive for bullish momentum or else we may see bearish sentiments into the market – personal opinion).
MACD is giving Bullish Crossover. So, further levels for nifty will be 22336 will work as support level and 22520 will work as resistance level.
Today’s Advance Decline ratio of NIFTY50
Advance - 31
Decline - 18
FII Sell – 522.30 crore
DII Buy + 1208.42 crore.
⚠️ Important: Always maintain your Risk & Reward Ratio.
✅Like and follow to never miss a new idea!✅
Disclaimer: I am not SEBI Registered Advisor. My posts are purely for training and educational purposes.
Eat🍜 Sleep😴 TradingView📈 Repeat 🔁
Happy learning with trading. Cheers!🥂

Daily market analysis for Tuesday 2nd AprilDaily Show on NIFTY, BANKNIFTY, FINNIFTY and USDINR, where we try and predict the market direction for tomorrow by technical analysis, Open Interest (OI) data analysis, FII DII data analysis and much more. This show gives insights into the market and is especially useful if you are a beginner who has just started options trading and wants to learn how to trade using price action and other chart techniques.
Disclaimer: This is not an investment recommendation, advice, research report, or stock tip of any nature. We are doing this only to understand how to read derivative data and perform technical analysis. Strictly for educational purposes only.
#nifty50 #banknifty #nifty50prediction #usdinr #optionstradingstrategy #technicalanalysis #tradingforbeginners #niftyprediction #sharemarkettrading #niftytomorrow #marketpredictiontoday #priceaction #usdinrprediction #niftytechnicalanalysis #tradingchartanalysis #usdinrtradingstrategytomorrow #openinterest

Nifty view for 02/04/2024Nifty has been showing some strength now. Expecting it to continue moving up until it takes out the previous ATH and make a new one. It can test the marked Demand zone ( 22195 - 22088 ) and then move up to take the ATH too.

NIFTY S/R for 2/4/24Support and Resistance Levels: In technical analysis, support and resistance levels are significant price levels where buying or selling interest tends to be strong. They are identified based on previous price levels where the price has shown a tendency to reverse or find support.
Support levels are represented by the green line and green shade, indicating areas where buying interest may emerge to prevent further price decline.
Resistance levels are represented by the red line and red shade, indicating areas where selling pressure may arise to prevent further price increases. Traders often consider these levels as potential buying or selling opportunities.
Breakouts: Breakouts occur when the price convincingly moves above a resistance level (red shade) or below a support level (green shade). A bullish breakout above resistance suggests the potential for further price increases, while a bearish breakout below support suggests the potential for further price declines. Traders pay attention to these breakout signals as they may indicate the start of a new trend or significant price movement.
Disclosure: I am not SEBI registered. The information provided here is for learning purposes only and should not be interpreted as financial advice. It is important to consult with a qualified financial advisor before making any investment decisions. Tweets neither advice nor endorsement.

Nifty at Important Supply zone! Nifty (TF : 4H)
Despite the volatile session, nifty still manage to finds it's way for new ATH!
- It's currently at immediate supply zone, where crossing and sustaining above 22550 will open gate for 22900 - 23000.
- While at the lower side, 22260 - 22340 is immediate support zone! Brea and sustain will invite aggressive selling which may lead nifty lower towards 22000- 22050
On #Weekly TF, Nifty sustain above 22700 - 22800, may even lead towards 23500 / 24000 📈
Strong Weekly Support @ 21700 - 21750. Any weekly close, it may tumbled towards 21000 and lower 📉
