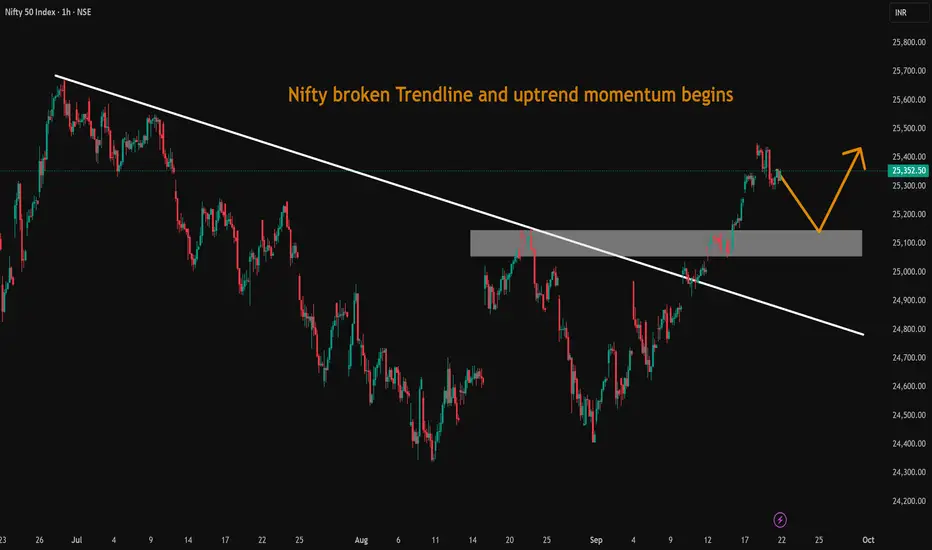
Nifty broken Trendline and uptrend momentum beginsNifty broken Trendline and uptrend momentum begins.
NIFTY trade ideas

Nifty 50 : Crossed an important resistance level of 25300Nifty 50 : After a Buy signal was triggered just few sessions back ,it crossed an important resistance level of 25300 today. Hoping to close it above it . Next resistance is at 25600.
( Not a Buy / Sell Recommendation
Do your own due diligence ,Market is subject to risks, This is my own view and for learning only .)

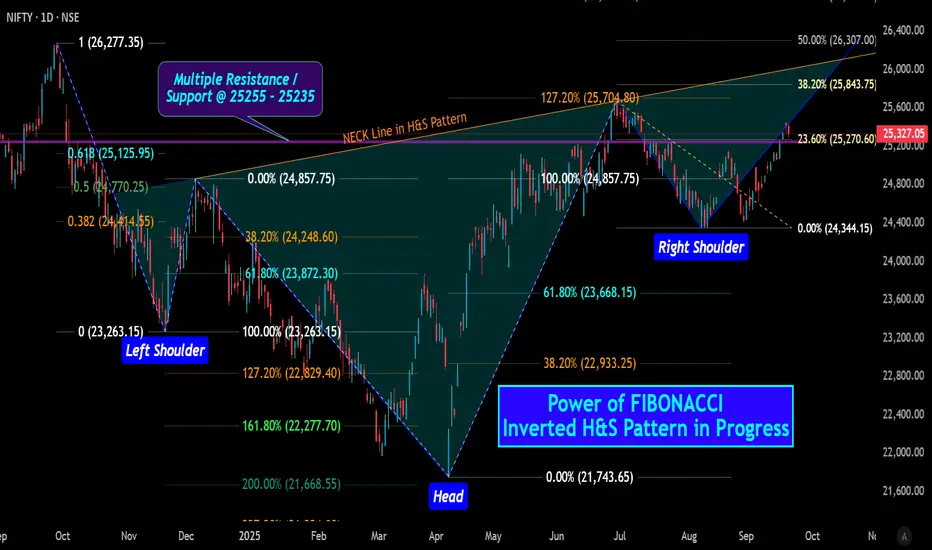
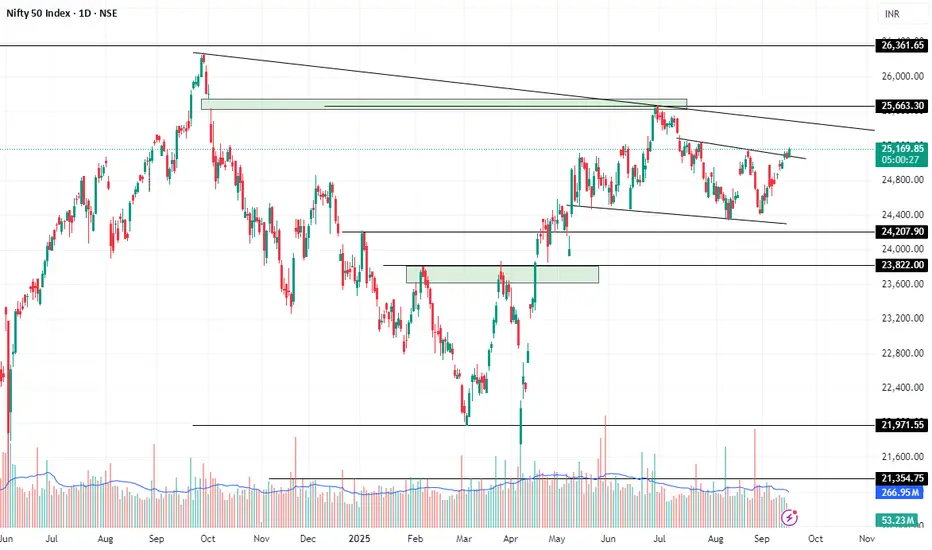
NIFTY: Power of FIBONACCI Inverted H&S Pattern in ProgressNIFTY: Power of FIBONACCI Inverted H&S Pattern in Progress
Overview of Nifty 50 Support and Resistance
After Closing September 19, 2025, the Nifty 50 index is in a strong medium- to long-term uptrend, although it has shown some signs of consolidation and profit-booking in the recent sessions . The bullish sentiment remains largely intact. Though SEBI Registered market analysts are advising a "buy-on-dips" strategy But I am not 100% AGREE with them .
Key Resistance Levels
25,435 - 25,549 : This is the most immediate and crucial resistance zone. The index has faced selling pressure around these levels, and a decisive break above this range is necessary to resume the upward momentum. A sustained move beyond this point is expected to trigger a fresh rally.
25,714.50 [ /b]: If the index successfully breaks past the 25,550 mark, this is the next significant resistance level and a potential short-term target.
25850 - 25928 : If the index successfully breaks past the 25,714 mark, this is the next significant resistance level and a potential mid-term target.
26,029 : This is near a major psychological (i.e 26000) resistance level. A strong and sustained move above 25,928 could pave the way for a rally toward this landmark.
26244 : This is Last resistance level (near all time High i.e 26277) before Creating New All Time High. A strong and sustained move above 26,029 could pave the way for a rally toward this landmark.
Key Support Levels
25,255 to 25,235 : This is the immediate and strong support zone. The index has found buying interest at these levels, and a hold above this range is a positive signal. This area is considered a key level to watch for potential buying opportunities (if Slips may touch 25214)on short-term pullbacks.
25,118 - 25041 : This area, which around coincides with the 20-day Exponential Moving Average (EMA) and key Fibonacci retracement level, is a major support. A break below this level could indicate a more significant correction.
24,970 to 24,714 : These are strong support zones that, in the event of a deeper correction, are likely to attract significant buying interest. Any decline towards these levels is widely seen as a valuable entry point for long-term investors. Though 24810 may resist the Fall.
# " Intraday &WEEKLY Levels" will be published later
Use any Momentum Indicator / Oscillator or as you "USED to" to Take entry.
📢 Disclaimer
I am not a SEBI-registered financial adviser.
The information, views, and ideas shared here are purely for educational and informational purposes only. They are not intended as investment advice or a recommendation to buy, sell, or hold any financial instruments.
Trading and investing in the stock market involves risk, and you should do your own research and analysis. You are solely responsible for any decisions made based on this research.
"As HARD EARNED MONEY IS YOUR's, So DECISION SHOULD HAVE TO BE YOUR's".
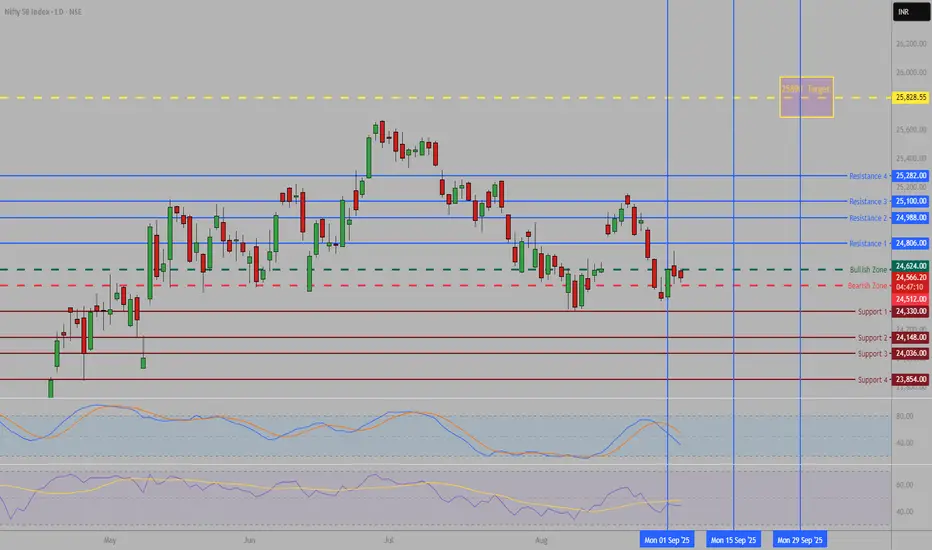
Nifty levels - Sep 18, 2025Nifty support and resistance levels are valuable tools for making informed trading decisions, specifically when combined with the analysis of 5-minute timeframe candlesticks and VWAP. By closely monitoring these levels and observing the price movements within this timeframe, traders can enhance the accuracy of their entry and exit points. It is important to bear in mind that support and resistance levels are not fixed, and they can change over time as market conditions evolve.
The dashed lines on the chart indicate the reaction levels, serving as additional points of significance to consider. Furthermore, take note of the response at the levels of the High, Low, and Close values from the day prior.
We hope you find this information beneficial in your trading endeavors.
* If you found the idea appealing, kindly tap the Boost icon located below the chart. We encourage you to share your thoughts and comments regarding it.
Wishing you success in your trading activities!

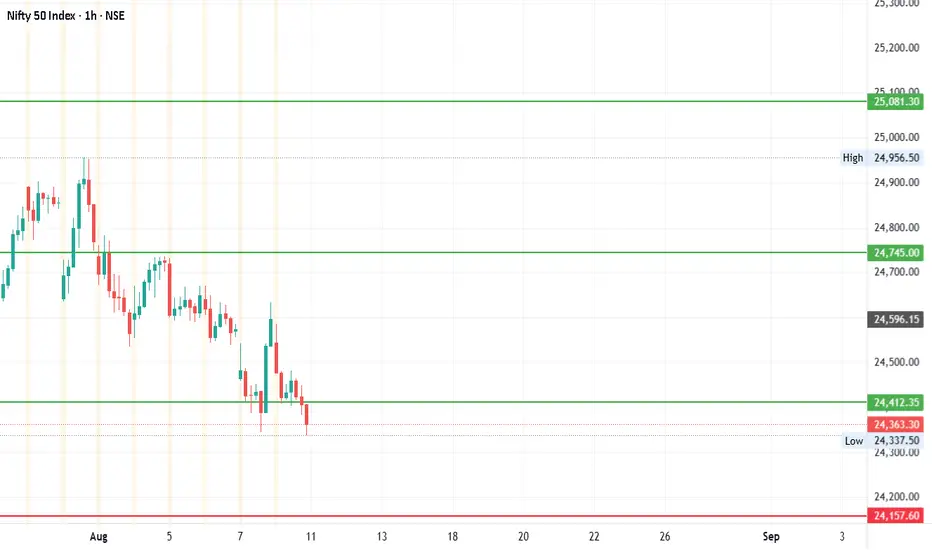
#Nifty - Levels for Aug 2025 Date: 09-08-2025
Nifty Current Price: 24363.3
Pivot Point: 24746 Support: 24412 Resistance: 25081
Upside Targets:
| Target | Price |
| ----------- | ---------|
| 🎯 Target 1 | ₹25335 |
| 🎯 Target 2 | ₹25589 |
| 🎯 Target 3 | ₹25905 |
| 🎯 Target 4 | ₹26221 |
Downside Targets:
| Target | Price |
| ----------- | ---------|
| 🎯 Target 1 | ₹24158 |
| 🎯 Target 2 | ₹23903 |
| 🎯 Target 3 | ₹23587 |
| 🎯 Target 4 | ₹23271 |
#TradingView #Nifty #BankNifty #DJI #NDQ #SENSEX #DAX #USOIL #GOLD #SILVER
#BHEL #HUDCO #LT #LTF #ABB #DIXON #SIEMENS #BALKRISIND #MRF #DIVISLAB
#MARUTI #HAL #SHREECEM #JSWSTEEL #MPHASIS #NATIONALUM #BALRAMCHIN #TRIVENI
#USDINR #EURUSD #USDJPY #NIFTY_MID_SELECT #CNXFINANCE
#SOLANA #ETHEREUM #BTCUSD #MATICUSDT #XRPUSDT
#Crypto #Bitcoin #BTC #CryptoTA #TradingView #PivotPoints #SupportResistance
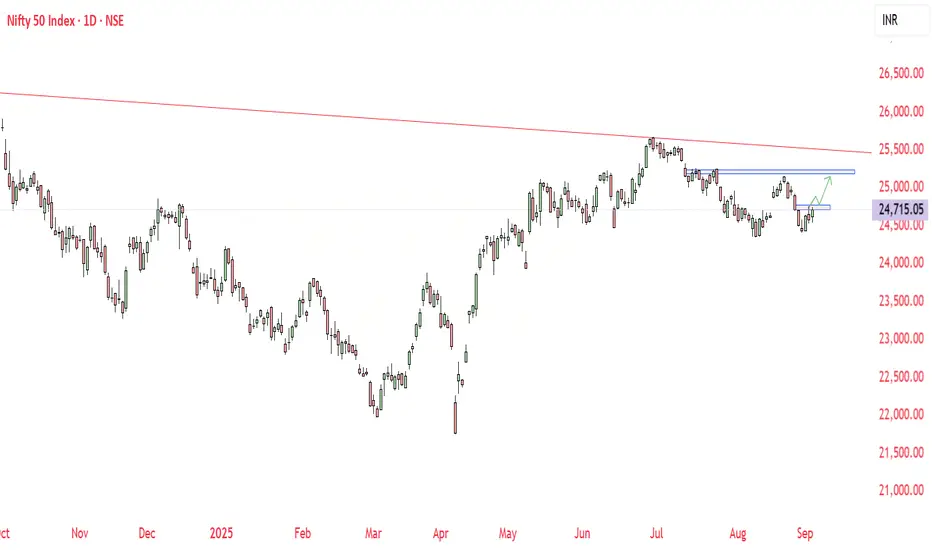
PERFECT CUP & HANDLE IN NIFTYNifty is making one of the strongest bullish pattern that is cup & handle .
major breakout level @ 25,700
internal breakout occurs @ 25,200
one can go long after confirmation of breakout from 25,700
also one can go long with less risk @ breakout of 25,200
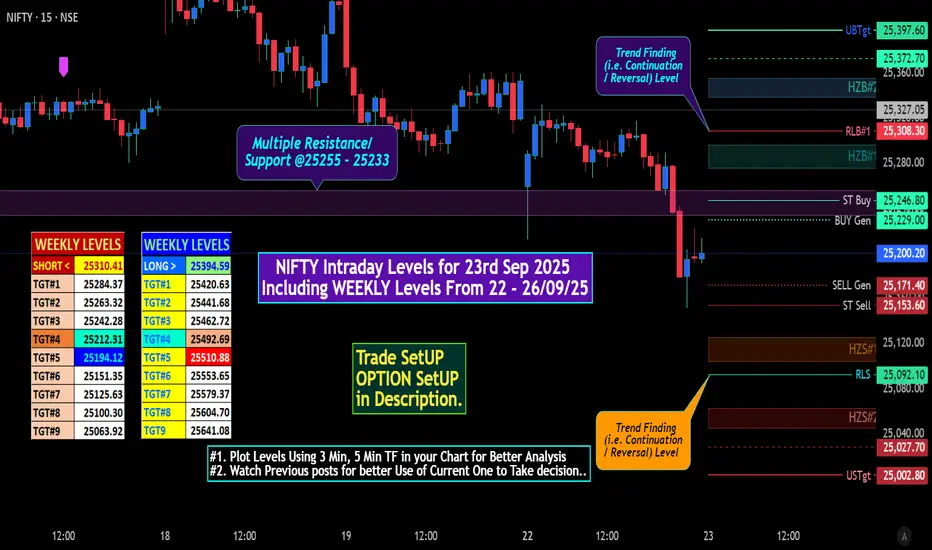
NIFTY Intraday Levels for 23rd Sep 2025NIFTY Intraday Levels for 23rd Sep 2025
Key Takeaways:
• Immediate Action: Watch the 25,154 - 25,308 range. The breakout/breakdown from this band will dictate the next immediate move.
• Warning Sign: The lower high at ~25,331.7 is the most significant technical red flag for the short-term bullish trend.
• Critical Level: 25,028 is the line in the sand for bulls. Holding it is crucial to maintain the positive structure.
Market View
Intraday View (For the next session)
• View: Neutral / Range-bound. BIAS: Cautious / Neutral to Bearish.
• Scenario 1 (Bullish) : A sustained move above 25,245- 25255 could trigger a short-covering rally towards 25,400.372. (In between some levels plotted in Chart)
• Scenario 2 (Bearish) : Break below the key support of 25,172 - 25154 could lead to a decline towards the strong support zone of 25,092-25,027.
• Strategy: Trade the range (buy near 25,092 support, sell near 25,305 resistance) with strict stop-losses. Wait for a breakout from this range for a directional move.
Iron Butterfly ( Most Suitable for Expiry )
• Sell ATM: 25,200 CE & 25,200 PE
• Buy OTM: 25,250 CE & 25,150 PE
• Max Profit: Premium received (works best if Nifty expires between 25,170-25,230)
• Ideal for: Low volatility, range-bound expiry day
* All levels mentioned on NIFTY spot Basis.
** Try to publish NIFTY Future with More OPTION Strategy.
# "WEEKLY Levels" mentioned in BOX format.
^^^^^^^ Plot Levels Using 3 Min, 5 Min Time frame in your Chart for Better Analysis ^^^^^^^
L#1: If the candle crossed & stays above the “Buy Gen”, it is treated / considered as Bullish bias.
L#2: Possibility / Probability of REVERSAL near RLB#1 & UBTgt
L#3: If the candle stays above “Sell Gen” but below “Buy Gen”, it is treated / considered as Sidewise. Aggressive Traders can take Long position near “Sell Gen” either retesting or crossed from Below & vice-versa i.e. can take Short position near “Buy Gen” either retesting or crossed downward from Above.
L#4: If the candle crossed & stays below the “Sell Gen”, it is treated / considered a Bearish bias.
L#5: Possibility / Probability of REVERSAL near RLS#1 & USTgt
HZB (Buy side) & HZS (Sell side) => Hurdle Zone,
*** Specialty of “HZB#1, HZB#2 HZS#1 & HZS#2” is Sidewise (behaviour in Nature)
Rest Plotted and Mentioned on Chart
Color code Used:
Green =. Positive bias.
Red =. Negative bias.
RED in Between Green means Trend Finder / Momentum Change
/ CYCLE Change and Vice Versa.
Notice One thing: HOW LEVELS are Working.
Use any Momentum Indicator / Oscillator or as you "USED to" to Take entry.
📢 Disclaimer
I am not a SEBI-registered financial adviser.
The information, views, and ideas shared here are purely for educational and informational purposes only. They are not intended as investment advice or a recommendation to buy, sell, or hold any financial instruments.
Trading and investing in the stock market involves risk, and you should do your own research and analysis. You are solely responsible for any decisions made based on this research.
"As HARD EARNED MONEY IS YOUR's, So DECISION SHOULD HAVE TO BE YOUR's".
Do Comment if helpful
Nifty Analysis EOD – September 18, 2025 – Thursday🟢 Nifty Analysis EOD – September 18, 2025 – Thursday 🔴
Gap-Up Test, Triangle Breakdown, and Sharp Recovery
🗞 Nifty Summary
Nifty opened with a 111-point gap-up at 25,441, right near our target zone of 25,460. The first 10 minutes formed an IB range of 55 points, and for the next 3 hours the index consolidated inside this band, shaping a symmetrical triangle pattern. (Refer to the 5 min Chart)
At 12:30 PM, the triangle broke down, and within 30 minutes its pattern target was achieved. In this move, Nifty not only filled the opening gap but also broke below R1 and PDH. At that stage, PDC, CPR, and the previous day’s resistance zone at 25,340 acted as strong support.
From there, a sudden 100-point sharp recovery pulled the index back to the mid-point of the earlier triangle. Nifty closed at 25,420, just 28 points below the day’s high.
📌 Yesterday’s note said:
Bulls face resistance at 25,340, breakout above it could open 25,460+ ✅ (tested in gap-up).
Sideways consolidation may happen ✅ (saw 3+ hours).
Pullback for gap-filling likely ✅ (done by mid-session).
📌 Yesterday’s note end:
👉 What wasn’t expected: the late-session sharp recovery, which shows bulls are still alive but lack strength to break new highs decisively. Tomorrow’s session becomes a litmus test for bulls — they must cross today’s high and close above 25,450 to keep momentum intact.
🛡 5 Min Intraday Chart with Levels
📉 Daily Time Frame Chart with Intraday Levels
🕯 Daily Candle Breakdown
Open: 25,441.05
High: 25,448.95
Low: 25,329.75
Close: 25,423.60
Change: +93.35 (+0.37%)
🏗️ Structure Breakdown
Red candle (Close < Open), yet index closed higher vs yesterday’s close.
Body: ~17.45 points (small).
Upper wick: ~7.90 points.
Lower wick: ~93.85 points (long).
Close is slightly below open but far above the day’s low → strong intraday recovery.
📚 Interpretation
Opened strong, extended slightly to 25,449, then fell to 25,330.
Buyers defended support and absorbed selling pressure, pulling back to 25,420.
Despite closing red, the candle reflects bullish undertone with demand at lower levels.
🕯Candle Type
Hammer-like candle → long lower shadow, small real body near the high. Suggests support defence and dip-buying strength.
📉📈 Short-Term View – September 19, 2025
Support: 25,330 (today’s low).
Resistance: 25,445–25,450 (today’s high).
👉 Sustaining above 25,330 keeps the bullish structure intact.
👉 Breakout above 25,450 could open doors to 25,535–25,550.
🛡 5 Min Intraday Chart
⚔️ Gladiator Strategy Update
ATR: 160.98
IB Range: 55.15 → Medium
Market Structure: ImBalanced
Trade Highlights:
12:30 PM – Short Trigger → Target Achieved (R:R = 1:3.59)
📌 Support & Resistance Levels
Resistance Zones:
25,460
25,500 (Psychological)
25,535
Support Zones:
25,385
25,340
25,307 ~ 25,290
25,275 ~ 25,260 (Previous Day Low & Gap)
💡 Final Thoughts
The day perfectly tested the upper target, retraced for gap fill, and rebounded sharply. Bulls showed resilience but need confirmation. Tomorrow is key: above 25,450 = continuation; below 25,330 = weakness resurfaces.
📖 “Markets often test your conviction by shaking you out before the real move begins.”
✏️ Disclaimer
This is just my personal viewpoint. Always consult your financial advisor before taking any action.

Nifty still in uptrendSo far Nifty is still in the uptrend channel.....The time to be bearish would be below 21600, so far its buy on dips, It could reach 29000 and above soon.....However, keep your positions small and if you're an investor, remember you're investing at the highs....be quick to take profits and keep ur profits as cash....When that rug pull comes, your favorite stocks will be available at discount....use the cash then....trade safe people....cheers

DIAMOND TOP - NIFTY 50NIFTY 50 is forming similar to Diamond top pattern.
( pattern drawn in blue line )
which is rarest and strongest bearish pattern
break below 24,350 will confirm down trend

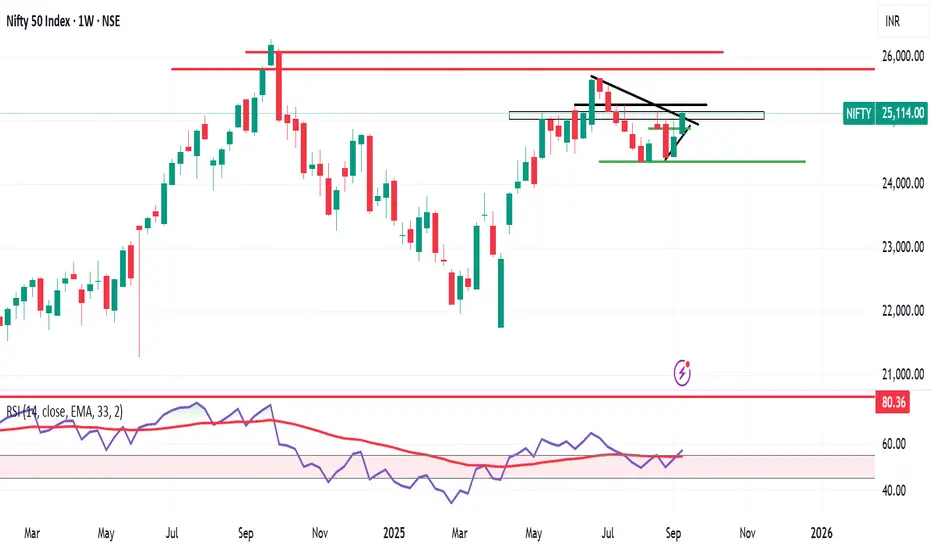
Nifty trying to inch back into Bullish territoryNifty has done a good job so far in the last 2 weeks to inch back towards bullish territory. This was the second week where we saw a fantastic Green candle. We saw Nifty close above an important Fibonacci resistance of 24994 at 25114.
The Next major Fibonacci resistances are at 25152 which is very near and 25378 which might also look relatively nearby. Once we get a closing above these 2 levels the next targets for Nifty will be at 25669, 26044 and 26529. Let us see if Nifty momentum takes us above 25152 or 25378 within next week.
If the resistance stops nifty growth the supports for Nifty will be at Fibonacci levels of 24994, 24804, 24645 (next strong Fibonacci support). Final support for Nifty before it falls back into bearish zone will be at 24337. Mother line support of 50 Weeks EMA is at 24144.
Shadow of the candle looks positive as of now and RSI is also slowly getting into the Bullish zone. Currently the RSI of Weekly chart is 56.99 which is very conducive for further progress.
Disclaimer: The above information is provided for educational purpose, analysis and paper trading only. Please don't treat this as a buy or sell recommendation for the stock or index. The Techno-Funda analysis is based on data that is more than 3 months old. Supports and Resistances are determined by historic past peaks and Valley in the chart. Many other indicators and patterns like EMA, RSI, MACD, Volumes, Fibonacci, parallel channel etc. use historic data which is 3 months or older cyclical points. There is no guarantee they will work in future as markets are highly volatile and swings in prices are also due to macro and micro factors based on actions taken by the company as well as region and global events. Equity investment is subject to risks. I or my clients or family members might have positions in the stocks that we mention in our educational posts. We will not be responsible for any Profit or loss that may occur due to any financial decision taken based on any data provided in this message. Do consult your investment advisor before taking any financial decisions. Stop losses should be an important part of any investment in equity.

H1B VISA FEE ISSUE TO HAUNT NIFTY ??? WEEKLY ANALYSISNifty is trading above an important resistance zone of 25000-25150. Even then, we can expect a dip towards 25000-25150 as now it will work as an important support zone due to the H1B visa fiasco . But more or less, the chart is not indicating bearishness, and we can expect Nifty to bounce back from lows and continue the upside momentum .
All levels are marked in the chart posted .

Harmonic Patterns In NIFTYHarmonic patterns are advanced technical analysis tools used in trading to identify potential price reversals or continuations in financial markets, including indices like the NIFTY 50 (the benchmark index of the National Stock Exchange of India). These patterns are based on Fibonacci ratios (e.g., 0.618, 0.786, 1.272, 1.618) and form specific geometric structures across price swings, helping traders predict key levels for entries, stops, and targets. They are particularly popular among swing and position traders for their precision in volatile markets like NIFTY, which is influenced by domestic and global factors such as economic data, corporate earnings, and geopolitical events.
Key Harmonic Patterns and Their Relevance to NIFTY
Harmonic patterns typically consist of four points (X, A, B, C, D) representing price swings. Here's a brief overview of the most common ones, with examples of how they've appeared in NIFTY or related indices recently:
AB = 0.618
XA; BC = 0.382-0.886
Seen in NIFTY's D charts .TARGET AROUND 25500-25521

Nifty Analysis EOD – September 16, 2025 – Tuesday🟢 Nifty Analysis EOD – September 16, 2025 – Tuesday 🔴
Powerful Breakout to New Highs – Bulls Taking Control
🗞 Nifty Summary
Nifty began the day with a 15-point gap up, then climbed steadily and strongly upward from the first tick. Every key level respected the price movement, with pauses followed by decisive breakthroughs:
Crossed 25115 (PDH), 25140, and 25160 levels smoothly.
Marked a day high of 25181.85 within just 45 minutes.
After a ~2-hour consolidation in a narrow ~25-point range, Nifty broke the Current Day High (CDH) and marked a new high at 25,203. Though crossing 25200 was tough for a while, 25150 support came to the rescue. From there, a fresh rally pushed the index to our expected target level of 25,240.
As noted earlier, 25240 acted as strong resistance, visible in multiple 5-minute candle shadows. The day ended near the high, signaling strong bullish conviction.
📊 The total range today was 190 points, compared to the 172-point average range of the Gladiator Indicator → indicating expansion after recent contraction.
✅ Today’s close is the highest closing since July 11, 2025, and above the previous swing high (July 23, 2025 close).
👉 For tomorrow:
If Nifty gaps up above the 25240 ~ 25260 resistance zone and sustains, it could aim for 25300 ~ 25340 and 25385.
If it opens within today’s range, expect a possible retest of 25165 ~ 25140, with 25115 as strong support — a possible zone for long reversal trades.
Initial Balance (IB) will be key to plan trades and view tomorrow.
🛡 5 Min Intraday Chart with Levels
📉 Daily Time Frame Chart with Intraday Levels
🕯 Daily Candle Breakdown
Open: 25,073.60
High: 25,261.40
Low: 25,070.45
Close: 25,239.10
Change: +169.90 (+0.68%)
🏗️ Structure Breakdown
Green candle (Close > Open)
Body: ~165.50 points (strong, wide body)
Upper wick: ~22.30 points
Lower wick: ~3.15 points (almost no tail)
Strong close near day high → clear sign of intraday momentum.
📚 Interpretation
Buyers fully controlled the session from the start, defending 25,070.
Broke above 25,140 resistance (last week’s ceiling) with confidence.
Closing near the high shows high conviction buying and likely short-covering.
🕯Candle Type
Bullish Marubozu type → Signals decisive breakout with strong buying pressure.
📉📈 Short-Term View – September 17, 2025
Support: 25,140–25,150 (key floor now)
Resistance: 25,260–25,290 (today’s high zone)
👉 Key Insight:
The multi-day sideways consolidation (24,940–25,140) has ended.
Today’s strong green Marubozu confirms bullish breakout.
Bulls are now clearly in charge, aiming next for 25,340–25,385, provided they sustain above 25,140.
🛡 5 Min Intraday Chart
⚔️ Gladiator Strategy Update
ATR: 172.09
IB Range: 87.4 → Medium
Market Structure: Balanced
Trade Highlights:
9:20 AM – Long Trigger → Target Hit (R:R - 1:2.68)
📌 Support & Resistance Levels
Resistance Zones:
25240
25290 ~ 25307
25340 ~ 25385
Support Zones:
25165 ~ 25140
25115
25085 ~ 25070
💡 Final Thoughts
Today’s textbook inside bar breakout shows that bulls have the upper hand now. The next few sessions will decide if momentum will carry toward 25,300+ or if profit-taking sets in.
📖 “Momentum favors the brave. Keep an eye on the key levels and trade with discipline.”
✏️ Disclaimer
This is just my personal viewpoint. Always consult your financial advisor before taking any action.

Weekly Market Outlook – Nifty, BankNifty & S&P 500Nifty ended the week on a positive note, closing at 25,327 – up 213 points from last week’s close. This week’s price action was once again perfectly aligned with my projected range of 25,500 – 24,700, making a high of 25,448 and a low of 25,048.
Nifty Outlook for Next Week:
I expect Nifty to trade within 25,700 – 24,900. A break below 24,900 could open the doors towards 24,600 / 24,400.
Sector Strength Check:
Looking at the monthly time frame, none of the major indices look particularly strong right now. On the weekly chart, strength is visible only in selective sectors like Consumption, FMCG, Metals, and a few Auto stocks.
⚠️ Caution: Until we see strength coming back in at least 3–4 major indices, it’s better to stay selective and avoid aggressive long positions.
BankNifty Analysis:
BankNifty has staged a sharp V-shaped recovery, but I am not fully convinced with this move.
Support to watch: 55,000 – a break below this can take it down to 54,700 / 54,600.
Resistance to watch: Above this week’s high of 55,835, it can test 56,000 / 56,400.
Expected Range: 56,400 – 54,550
India VIX Alert:
India VIX is currently near its support zone, which signals possible volatility ahead – so stay cautious.
Global Markets – S&P 500:
S&P 500 once again gave an all-time high close at 6,671 (+80 points WoW).
Breakout Levels: Above 6,671, we could see 6,689 / 6,780 / 6,930 / 6,959 (key level).
Investors holding long positions should keep a trailing SL at 6,450 to protect profits.

NIFTYKey Takeaways / Trade Points
Long-term supports: 19,152 – 21,071 (HTF).
Medium-term supports: 23,404 – 24,578 (MTF).
Immediate / intraday demand zone: 25,038–25,116 (ITF).
Bias: Fully bullish across all timeframes → pullbacks into any of these demand zones could be considered as potential buy zones.
Watch levels:
Above 25,089 → continuation of current trend likely.
Below 25,038 → intraday demand breaks, could trigger a deeper pullback.
🔹 Core Trade Setup
Parameter Value Interpretation
Entry-1 25,140 Entry near immediate demand zone (matches ITF demand 25,038–25,116).
Stop Loss (SL) 25,038 Below intraday demand to reduce false breakdowns.
Risk 102 pts Difference between entry and SL.
Reward 749 pts Potential profit to target.
Target as per Entry 25,889 Profit-taking level; aligns with the next resistance zone.
RR (Risk:Reward) 7.34:1 Excellent RR ratio — high edge trade.
🔹 Market Context
Last High: 25,153 (just above entry, meaning breakout is possible).
Last Low: 24,404 (major swing low).
Point Var: 749 (matches your reward).
🔹 Gann Levels
Gann Point High: 23,452
Gann Point Low: 23,273
These are deep support levels (long-term pivot areas). Price staying above these confirms the bullish bias.
🔹 Quick View
Bias: Strongly bullish across all timeframes.
Preferred Action: Buy dips near 25,100–25,140 with SL at 25,038, targeting 25,889.
Upside Potential: Next resistance zone ~25,900+.
🔹 Execution Tips
Entry Confirmation: Watch for reversal candles or high-volume buying near 25,100–25,140 zone before entering.
Partial Booking: Consider taking partial profits around 25,600–25,700 to lock gains.
Trailing SL: Once price crosses 25,400–25,500, move SL to breakeven to protect profits.

NIFTY 50 - Weekend ViewNifty may see 25200 this weekend, looking at US tariff relief on India. Just an technical view.
Overall Nifty 50 making lower highs since it made ATH. Not much upside seen, it may do 25200 then again we may see reverse.
Do your own research before taking any trade. This chart is only for educational purpose.
April Cycle correction could have endedNSE:NIFTY Suggest the April cycle correction could have already ended. And as far as 24300 levels stays intact we could see more rally inching higer, selling is a big no. ANY PANIC IS A BUY

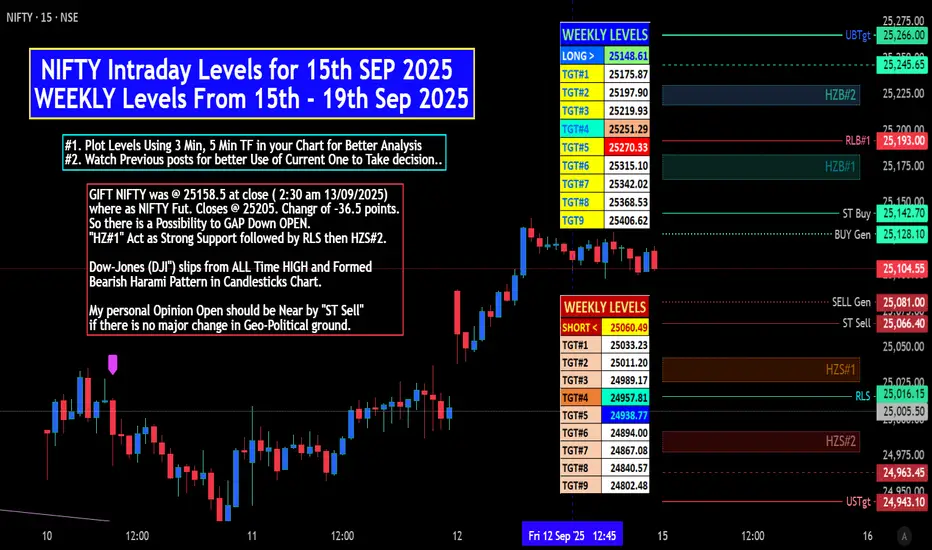
NIFTY Intraday Levels for 15/09/2025 WEEKLY Levels 15-19 Sep 25MARKET VIEW:
GIFT NIFTY was @ 25158.5 at close ( 2:30 am 13/09/2025)
where as NIFTY Fut. Closes @ 25205 . Change of -36.5 points .
So there is a Possibility to GAP Down OPEN.
"HZ#1" Act as Strong Support followed by RLS then HZS#2.
Some indicator & also Oscillators Shows Limited steam is LEFT.
Dow-Jones (DJI") slips from ALL Time HIGH and Formed
Bearish Harami Pattern in Candlesticks Chart.
My personal Opinion Open should be Near by "ST Sell"
if there is no major change in Geo-Political ground.
NIFTY Intraday Levels for 15th SEP 2025
WEEKLY Levels From 15th - 19th Sep 2025
# "WEEKLY Levels" mentioned in BOX format.
^^^^^^^ Plot Levels Using 3 Min, 5 Min Time frame in your Chart for Better Analysis ^^^^^^^
L#1: If the candle crossed & stays above the “Buy Gen”, it is treated / considered as Bullish bias.
L#4: Possibility / Probability of REVERSAL near RLB#1 & UBTgt
L#2: If the candle stays above “Sell Gen” but below “Buy Gen”, it is treated / considered as Sidewise. Aggressive Traders can take Long position near “Sell Gen” either retesting or crossed from Below & vice-versa i.e. can take Short position near “Buy Gen” either retesting or crossed downward from Above.
L#3: If the candle crossed & stays below the “Sell Gen”, it is treated / considered a Bearish bias.
L#4: Possibility / Probability of REVERSAL near RLS#1 & USTgt
HZB (Buy side) & HZS (Sell side) => Hurdle Zone,
*** Specialty of “HZB#1, HZB#2 HZS#1 & HZS#2” is Sidewise (behaviour in Nature)
Rest Plotted and Mentioned on Chart
Color code Used:
Green =. Positive bias.
Red =. Negative bias.
RED in Between Green means Trend Finder / Momentum Change
/ CYCLE Change and Vice Versa.
Notice One thing: HOW LEVELS are Working.
Use any Momentum Indicator / Oscillator or as you "USED to" to Take entry.
📢 Disclaimer
I am not a SEBI-registered financial adviser.
The information, views, and ideas shared here are purely for educational and informational purposes only. They are not intended as investment advice or a recommendation to buy, sell, or hold any financial instruments.
Trading and investing in the stock market involves risk, and you should do your own research and analysis. You are solely responsible for any decisions made based on this research.
"As HARD EARNED MONEY IS YOUR's, So DECISION SHOULD HAVE TO BE YOUR's".
Nifty Weekly Market Outlook – Bulls on the ChargeNifty closed the week at 25,114 (+373 points 📈),
with a high of 25,139 and low of 24,751.
As I mentioned last week, Nifty once again played perfectly within my range of 25,100 – 24,300.
Now, we are standing at a critical resistance zone of 25,200 – 25,300 – exactly where the market started its downward journey after 21st Aug 2025.
🔑 Key Levels to Watch for Next Week
✅ Bullish Scenario:
If Nifty sustains above 25,250, we may see a strong move towards 25,500 / 25,600.
❌ Bearish Scenario:
A break below Friday’s low of 25,038 could invite bears back and take Nifty down to 24,700 or even lower.
💡 Pro Tip for Investors
Those waiting for a dip to invest might get a chance around 18th / 19th September.
But remember – waiting too long often means missing the rally!
✅ Action Plan:
📋 Keep a list of fundamentally strong stocks ready.
📉 If Nifty corrects towards 24,200 / 24,000, start buying in SIP mode – don’t wait for the “perfect bottom.”
🌎 S&P 500 Update
S&P 500 closed at 6,584 (+100 points), finally touching the crucial Fib level of 6,568.
📈 Above 6,568: Rally towards 6,959 could start.
🔒 Trailing SL: Move your stop-loss to 6,430 to lock profits and protect gains.
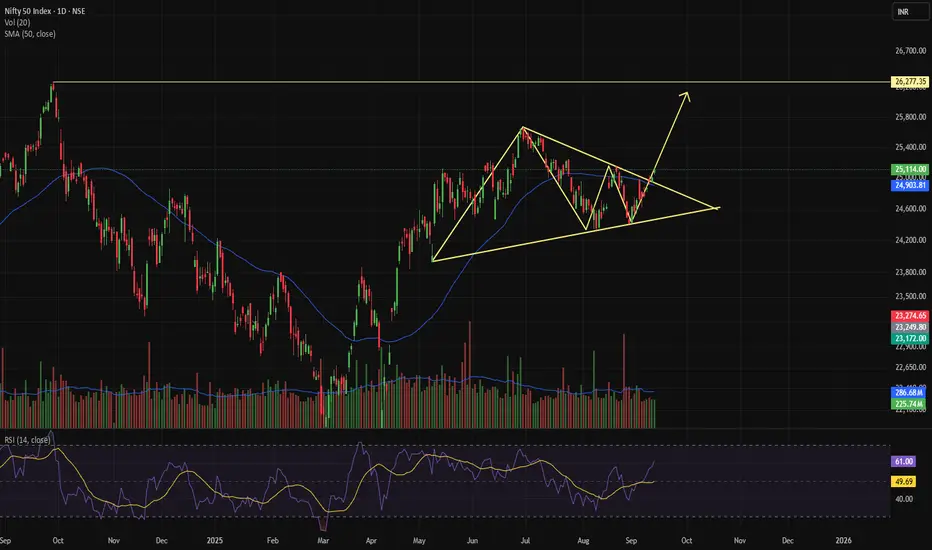
NIFTY- READY FOR UP MOVE CONFIRMATION OF TRIANGLE PATTERNThe daily candle closed above the triangle pattern, indicating a potential upward move, and the RSI index is currently at a value of 61. The first target may be the 25,650 level, while the second target could be the 26,250 level. The market is also finding support at the 50 DSMA, which reinforces the triangle pattern.
Nifty September TDX Levels -Please refer to these levels for Trend guidance.
Once you are familiar with them, transition to hourly charts for decision-making.