Nifty Holds Above 25K, Market Drivers Signal More UpsideNifty’s winning streak hit eight sessions, closing above psychological 25,000 mark as global optimism and strong domestic cues kept the rally alive.
Technical View
● The index has registered a fresh breakout above the trendline resistance, pointing toward renewed bullish momentum.
Key Levels to Watch
● Immediate resistance is seen around 25,200–25,300, while a stronger hurdle lies at 25,500–25,600.
● Support has shifted higher to 25,000–24,900, keeping the short-term outlook positive.
Market Drivers
● Global cues: Hopes of a US Fed rate cut and progress on the India–US trade deal have lifted market sentiment.
● Domestic macros: India’s economy looks strong with solid financial stability, steady GDP growth, and easing inflation.
● Consumer demand: Spending is expected to rise sharply after September 22, especially in automobiles and consumer durables, which could boost markets in the near term.
● Policy & earnings: Market mood is supported by GST reforms, easier monetary policy, and positive earnings expectations for the second half of FY26.
Strategic View
● The overall market trend is expected to stay positive. Traders should follow a buy-on-dips strategy with strict stop-losses. As long as Nifty holds above support, it can gradually move higher in the coming sessions.
NIFTY trade ideas

NIFTY - BULLISH Nifty is forming Bullish pattern on Daily chart with rising MACD bullish crossover and W pattern looks active now...
Stoploss 24700 Closing Basis
Target: 25700 26100
Nifty 50 price is consolidating in narrow zoneNifty 50 price is consolidating in narrow zone. Fundamentals are now US Tarrif hope driven with new diplomatic developments.

Nifty -- Ready to take off, or still a bait for buyers?Based on my analysis of the price action and RSI, W pattern formation is about to completed which may take the prices back to ATH.
RSI is moving swiftly and ready to move ahead the previous pivot. Also, price is above key EMA's.
Little support from BNF should kickstart the rally.
I will keep updating the chart with further analysis.
Nifty series #1.

Nifty levels - Sep 15, 2025Nifty support and resistance levels are valuable tools for making informed trading decisions, specifically when combined with the analysis of 5-minute timeframe candlesticks and VWAP. By closely monitoring these levels and observing the price movements within this timeframe, traders can enhance the accuracy of their entry and exit points. It is important to bear in mind that support and resistance levels are not fixed, and they can change over time as market conditions evolve.
The dashed lines on the chart indicate the reaction levels, serving as additional points of significance to consider. Furthermore, take note of the response at the levels of the High, Low, and Close values from the day prior.
We hope you find this information beneficial in your trading endeavors.
* If you found the idea appealing, kindly tap the Boost icon located below the chart. We encourage you to share your thoughts and comments regarding it.
Wishing you success in your trading activities!
Globalization vs. Deglobalization Debate in the World MarketUnderstanding Globalization
Globalization can be defined as the process of increasing interdependence and interconnectedness among countries in economic, political, cultural, and technological dimensions. In markets, it primarily manifests as:
Free Trade Expansion – Removal of tariffs, quotas, and trade restrictions.
Global Supply Chains – Companies outsourcing production to countries with cost advantages.
Cross-Border Investments – Growth of foreign direct investment (FDI) and multinational corporations (MNCs).
Financial Integration – Capital moving across borders through stock markets, banks, and investment funds.
Technology & Communication – Internet and digitalization connecting producers, consumers, and investors worldwide.
Globalization surged after the Cold War (1990s onward), when liberalization and deregulation policies spread across emerging markets. Institutions like the World Trade Organization (WTO), International Monetary Fund (IMF), and World Bank promoted cross-border economic integration. The rise of China as the world’s factory, India’s IT revolution, and global consumer brands like Apple, Toyota, and Samsung are products of globalization.
Understanding Deglobalization
Deglobalization refers to the deliberate reduction of interdependence between nations in trade, investment, and financial flows. Instead of expanding global linkages, countries adopt policies that bring economic activities closer to home. It manifests as:
Trade Protectionism – Tariffs, quotas, and restrictions on imports.
National Industrial Policies – Encouraging domestic manufacturing (e.g., “Make in India,” “America First”).
Supply Chain Re-shoring – Companies moving production back to home countries or nearby regions.
Geopolitical Rivalries – Economic sanctions, tech wars, and restricted access to markets.
Financial Decoupling – Limiting cross-border capital exposure to reduce vulnerability.
Deglobalization does not imply complete isolation but rather a recalibration of global connections. It gained momentum post-2008 financial crisis, accelerated during COVID-19 when countries realized the risks of overdependence on global supply chains, and strengthened further with geopolitical conflicts like the Russia-Ukraine war.
Historical Evolution of Globalization & Deglobalization
The globalization-deglobalization cycle is not entirely new.
First Wave of Globalization (1870–1914): Fueled by industrial revolution, railroads, shipping, and colonialism. Trade flourished until World War I disrupted global markets.
First Wave of Deglobalization (1914–1945): Wars, the Great Depression, and protectionist policies (e.g., Smoot-Hawley Tariff in the US) restricted global trade.
Second Wave of Globalization (1945–1980s): Post-WWII reconstruction, Bretton Woods system, and the spread of liberal economic policies.
Third Wave of Globalization (1990–2008): Collapse of the Soviet Union, rise of China, internet boom, global outsourcing, and trade liberalization.
Second Wave of Deglobalization (2008–Present): Financial crises, populism, technological nationalism, environmental concerns, and supply chain reconfiguration.
Thus, globalization and deglobalization are not absolute opposites but phases of world economic history.
Globalization: Benefits and Challenges
Benefits:
Economic Growth: Expanding markets allow countries to specialize and scale production.
Lower Costs: Outsourcing and supply chains reduce production costs for consumers.
Innovation & Technology Transfer: Global collaboration accelerates knowledge sharing.
Access to Capital: Emerging economies benefit from FDI and portfolio investments.
Cultural Exchange: Travel, media, and education foster cross-cultural connections.
Challenges:
Job Displacement: Outsourcing leads to unemployment in high-cost economies.
Income Inequality: Benefits unevenly distributed between nations and social groups.
Environmental Damage: Global supply chains increase carbon emissions.
Financial Vulnerability: Global crises spread rapidly (2008, 2020).
Cultural Homogenization: Local cultures risk being overshadowed by global brands.
Deglobalization: Benefits and Challenges
Benefits:
Domestic Industry Protection: Safeguards jobs and industries from global shocks.
Supply Chain Resilience: Reduces vulnerability to disruptions.
National Security: Greater control over critical industries (food, energy, defense).
Environmental Gains: Local production may cut transport-related emissions.
Balanced Global Order: Prevents excessive dependence on a few countries (e.g., China).
Challenges:
Higher Costs: Localized production increases consumer prices.
Reduced Innovation: Less collaboration slows technological progress.
Market Fragmentation: Trade restrictions reduce efficiency of global systems.
Risk of Retaliation: Trade wars harm exporters and global supply chains.
Slower Global Growth: Reduced trade and capital flows hinder overall prosperity.
Impact on World Markets
Trade Volumes: WTO data shows slowing global trade growth since 2015.
Stock Markets: Globalization increases correlation across markets; deglobalization creates divergence.
Commodities: Oil, gas, and food supplies disrupted by geopolitical tensions.
Currencies: Dollar dominance challenged by yuan, euro, and alternative payment systems (de-dollarization debates).
Corporate Strategies: Multinationals now adopt “China+1” strategy to diversify manufacturing bases.
Future Outlook: Convergence or Divergence?
Not the End of Globalization: Rather than collapse, globalization is restructuring.
Selective Deglobalization: Nations are decoupling in strategic sectors (defense, tech, energy) while still integrating in consumer goods and services.
Regionalization: Global supply chains are evolving into regional blocs (USMCA, EU, RCEP).
Digital Globalization: Data, AI, and digital finance will shape future trade flows.
Sustainable Globalization: Green energy, climate agreements, and ESG investments may form a new framework.
Conclusion
The globalization vs. deglobalization debate is not about one force replacing the other but about how the balance shifts over time. Globalization brought unprecedented prosperity, technological progress, and interconnectedness, but it also exposed vulnerabilities such as inequality, overdependence, and fragility of global systems. Deglobalization responds to these weaknesses, yet it risks reversing gains made over decades.
In reality, the world is likely moving toward a hybrid model—“re-globalization” or “regional globalization”—where countries remain interconnected but with greater safeguards, diversification, and focus on self-reliance. The future world market will not be flat, as Thomas Friedman once wrote, but rather fragmented yet interconnected, shaped by geopolitics, technology, and sustainability imperatives.
#NIFTY Intraday Support and Resistance Levels - 10/09/2025Nifty is expected to witness a gap up opening, continuing its momentum within the broader consolidation zone. The index has been trading in a tight range, and today’s levels will be crucial to determine the intraday direction.
On the upside, if Nifty sustains above 24,700–24,750, buying momentum could push it towards 24,850, 24,900, and 24,950+. A breakout above 25,050 would signal strong bullish sentiment, opening the way for further targets at 25,150, 25,200, and 25,250+.
On the downside, weakness may come into play if Nifty slips below 24,950–24,900. This could trigger a reversal towards 24,850, 24,800, and 24,750 levels. A break below 24,700 may extend the fall with deeper downside possibilities.
Overall, Nifty remains in a consolidation phase, and traders should focus on the breakout levels for clear intraday opportunities. A disciplined approach with strict stop-losses will be key in managing volatility around these zones.


NIFTY: Intraday & SWING Levels (NIFTY50 Spot) for 12th SEP 2025As of Now GIFT NIFTY. DJI, NASDAQ,are in +ve Bias
So there is a Possibility to GAP up OPEN.
"RL#1" Act as Strong Resistance followed by "HZ#2".
My personal Opinion Open should be Near "RL#1"
if there is no major change in Geo-Political ground.
Though as per rule i have to mention either "Long" Or "Short" and another one is "Neutral"
But I think tomorrow MKT will be Long to Short basis with big Range.
NIFTY: Intraday & SWING Levels (NIFTY50 Spot ) for 12th SEP 2025
^^^^^^^ Plot Levels Using 3 Min, 5 Min Time frame in your Chart for Better Analysis ^^^^^^^
L#1: If the candle crossed & stays above the “Buy Gen”, it is treated / considered as Bullish bias.
L#2: If the candle stays above “Sell Gen” but below “Buy Gen”, it is treated / considered as Sidewise. Aggressive Traders can take Long position near “Sell Gen” either retesting or crossed from Below & vice-versa i.e. can take Short position near “Buy Gen” either retesting or crossed downward from Above.
L#3: If the candle crossed & stays below the “Sell Gen”, it is treated / considered a Bearish bias.
L#4: Possibility / Probability of REVERSAL near RL#1 & UTgt
HZ => Hurdle Zone, Specialty of “HZ#1 & HZ#2” is Sidewise (behaviour in Nature)
Rest Plotted and Mentioned on Chart
Color code Used:
Green =. Positive bias.
Red =. Negative bias.
RED in Between Green means Trend Finder / Momentum Change
/ CYCLE Change and Vice Versa.
Notice One thing: HOW LEVELS are Working.
Use any Momentum Indicator / Oscillator or as you "USED to" to Take entry.
📢 Disclaimer
I am not a SEBI-registered financial adviser.
The information, views, and ideas shared here are purely for educational and informational purposes only. They are not intended as investment advice or a recommendation to buy, sell, or hold any financial instruments.
Please consult with your financial advisor before making any trading or investment decisions
Trading and investing in the stock market involves risk, and you should do your own research and analysis. You are solely responsible for any decisions made based on this research.
Nifty analysis for 11.September.2025Market forming Triangle pattern and made a Spinning top at resistance level. If the market closes above the marked resistance level then we can see a big move in future. Otherwise market will fall into the triangle pattern still support line of the pattern.

Nifty levels - Sep 12, 2025Nifty support and resistance levels are valuable tools for making informed trading decisions, specifically when combined with the analysis of 5-minute timeframe candlesticks and VWAP. By closely monitoring these levels and observing the price movements within this timeframe, traders can enhance the accuracy of their entry and exit points. It is important to bear in mind that support and resistance levels are not fixed, and they can change over time as market conditions evolve.
The dashed lines on the chart indicate the reaction levels, serving as additional points of significance to consider. Furthermore, take note of the response at the levels of the High, Low, and Close values from the day prior.
We hope you find this information beneficial in your trading endeavors.
* If you found the idea appealing, kindly tap the Boost icon located below the chart. We encourage you to share your thoughts and comments regarding it.
Wishing you success in your trading activities!

Nifty Analysis EOD – September 12, 2025 – Friday 🟢 Nifty Analysis EOD – September 12, 2025 – Friday 🔴
Momentum Building – Eyes Set on 25,240 Next
🗞 Nifty Summary
Nifty began the session with a strong 80-point gap-up, right at our first target level. A sudden retracement of 50 points found support at the previous two days' high (25,038), which became the day’s low.
From there, the index climbed gradually yet confidently toward the resistance zone of 25,085 ~ 25,095, where it paused briefly. After the breakout, a sharp move pushed the index to our second target of 25,140, marking the day’s high at 25,139.45 — just 16 points shy of the Inside Bar Pattern target.
Following this intraday expansion, the index cooled off and retraced toward the 25,085 ~ 25,095 zone, settling into a small consolidation range between 25,100 ~ 25,125. The day ended at 25,104.55 on a very positive note.
Overall, today’s session fulfilled our expectations.
👉 Tomorrow, a sustained breakout above 25,140 ~ 25,160 may open the door toward the powerful supply and resistance zone of 25,240.
🛡 5 Min Intraday Chart with Levels
📉 Daily Time Frame Chart with Intraday Levels
🕯 Daily Candle Breakdown
Open: 25,074.45
High: 25,139.45
Low: 25,038.05
Close: 25,114.00
Change: +108.50 (+0.43%)
🏗️ Structure Breakdown
Green candle (Close > Open).
Body: ~39.55 points → moderate.
Upper wick: ~25.45 points.
Lower wick: ~36.40 points.
Balanced intraday action with attempts from both bulls and bears, but closed firmly higher.
📚 Interpretation
Buyers defended 25,038–25,040 support zone consistently.
Price moved above 25,100, though sellers capped near 25,140.
The candle reflects controlled bullishness with gradual accumulation, not a runaway rally.
🕯Candle Type
Balanced bullish candle / small-bodied bullish bar → shows steady buying interest.
📉📈 Short-Term View – September 12, 2025
Support: 25,040 (defended strongly for the 4th session).
Resistance: 25,140 (fresh rejection zone).
👉 Key Insight:
The market is forming a tight upward channel with bulls gradually pushing, but sellers remain active near resistance.
Sustaining above 25,140 will be crucial to target 25,240.
📊 Context over last 3 sessions (September 4–8):
Market is holding 24,940–25,040 as a strong floor.
Each session shows a higher close → steady buying pressure accumulating.
🛡 5 Min Intraday Chart
⚔️ Gladiator Strategy Update
ATR: 178.76
IB Range: 51.7 → Medium
Market Structure: ImBalanced
Trade Highlights:
10:00 AM – Long Trigger → Target Hit (R:R - 1:2.5)
📌 Support & Resistance Levels
Resistance Zones:
25,140 ~ 25,160
25,240
Support Zones:
25,085
25,035
25,000 ~ 24,975
24,940
💡 Final Thoughts
Today’s action reflects a healthy consolidation phase with bullish undertones. Bulls are preparing for a potential breakout, while sellers defend the upper band. The next session’s ability to sustain above 25,140–25,160 will be a clear momentum trigger.
📖 “Patience in accumulation today builds strength for tomorrow’s breakout.”
✏️ Disclaimer
This is just my personal viewpoint. Always consult your financial advisor before taking any action.

Nifty 50 : Buy Triggered Nifty 50 : Buy Triggered
Important resistance levels : 25300 /25700
( Not a Buy / Sell Recommendation
Do your own due diligence ,Market is subject to risks, This is my own view and for learning only .)

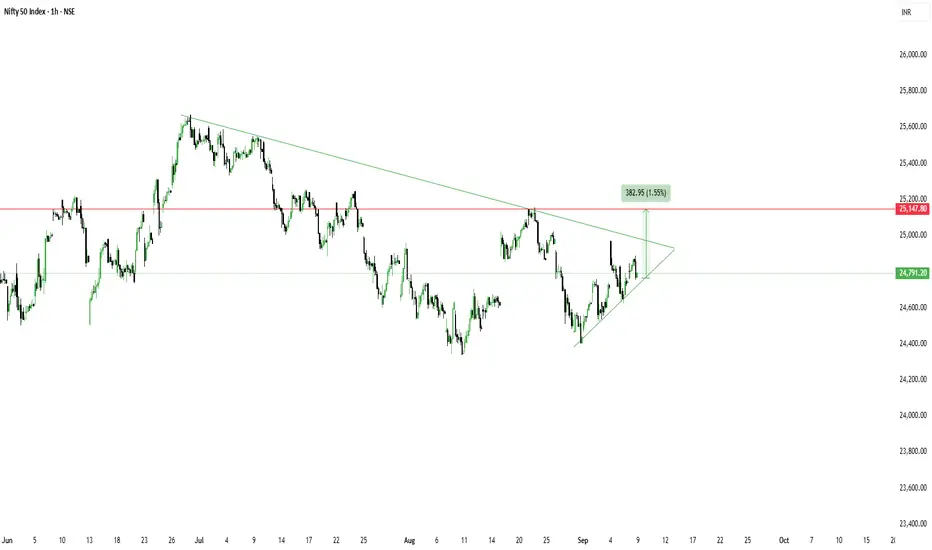
Good Closing By Nifty On Hourly ChartNifty has finally closed above the Mother and Father resistance line on the hourly chart. We have tried to draw the Fibonacci retracement based on recent movements of Nifty which can be seen in the chart. We can clearly see the places from where Nifty found resistance recently where Fibonacci lines and places where Nifty took support where also Fibonacci lines.
To know more about Fibonacci retracement and use them for trading/investing you can read my book THE HAPPY CANDLES WAY TO WEALTH CREATION. In this book you can also know more about Trend lines, Supports, Resistances, Mother line and Father line and to draw the same on your chart and for learning Techo-Funda analysis read my Book THE HAPPY CANDLES WAY TO WEALTH CREATION. Heart of the book is my Mother, Father and Small child theory which makes investment easy for those who understand it an use it in their analysis. The book is available on Amazon and will help you in your investing journey whether you are a seasoned investor or a new beginner. The chapters in the book are mostly standalone. The book is rated 4.8/5 on Amazon. It is a value for money book priced at Rs.349/- (Delivery charges extra as charged by Amazon).
Now the next Fibonacci level resistances for Nifty will be at: 24994(Tough Trend line resistnace and Fibonacci resistance, 25152, 25378 and 25669. Above 25669 closing the major Bull run can begin which can take Nifty towards 26K+ levels indicated in the chart.
Mother line and Father line are both supports as of now these are at 24760 and 24783. So the zone between 24760 and 24783 becomes a very strong support zone.
Fibonacci supports for Nifty will be at: 24645 and 24337. A closing below 24337 will create a bear grip on the market which can drag if further downwards.
As of now the shadow of the candles is looking positive and green in colour.
Disclaimer: The above information is provided for educational purpose, analysis and paper trading only. Please don't treat this as a buy or sell recommendation for the stock or index. The Techno-Funda analysis is based on data that is more than 3 months old. Supports and Resistances are determined by historic past peaks and Valley in the chart. Many other indicators and patterns like EMA, RSI, MACD, Volumes, Fibonacci, parallel channel etc. use historic data which is 3 months or older cyclical points. There is no guarantee they will work in future as markets are highly volatile and swings in prices are also due to macro and micro factors based on actions taken by the company as well as region and global events. Equity investment is subject to risks. I or my clients or family members might have positions in the stocks that we mention in our educational posts. We will not be responsible for any Profit or loss that may occur due to any financial decision taken based on any data provided in this message. Do consult your investment advisor before taking any financial decisions. Stop losses should be an important part of any investment in equity.

NIFTY BREACHED TRIANGLE PATTERNDaily candle of nifty successfully breached the triangle pattern. 15-minute candle is trading between 24915 to 25035 level since last two days and closed above a trend line with support of VWAP and RSI is also showing strength. A sustainable closing above 25035 level will give buy for intraday position as well as for Positional trade.

Nifty levels - Sep 11, 2025Nifty support and resistance levels are valuable tools for making informed trading decisions, specifically when combined with the analysis of 5-minute timeframe candlesticks and VWAP. By closely monitoring these levels and observing the price movements within this timeframe, traders can enhance the accuracy of their entry and exit points. It is important to bear in mind that support and resistance levels are not fixed, and they can change over time as market conditions evolve.
The dashed lines on the chart indicate the reaction levels, serving as additional points of significance to consider. Furthermore, take note of the response at the levels of the High, Low, and Close values from the day prior.
We hope you find this information beneficial in your trading endeavors.
* If you found the idea appealing, kindly tap the Boost icon located below the chart. We encourage you to share your thoughts and comments regarding it.
Wishing you success in your trading activities!

Nifty approaching near term resistance. NSE:NIFTY is approaching a near term resistance.
Key levels to watch are
25,000 - 25200,
25,600 and the strongest rejection at 26,400.
Short term there might be an upside move, however, correction waves are pointing in the downward directions.

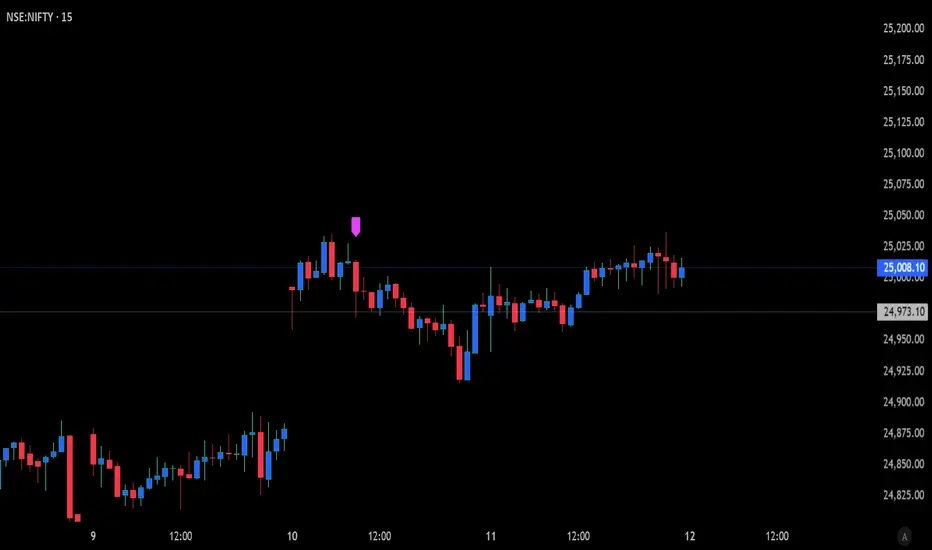
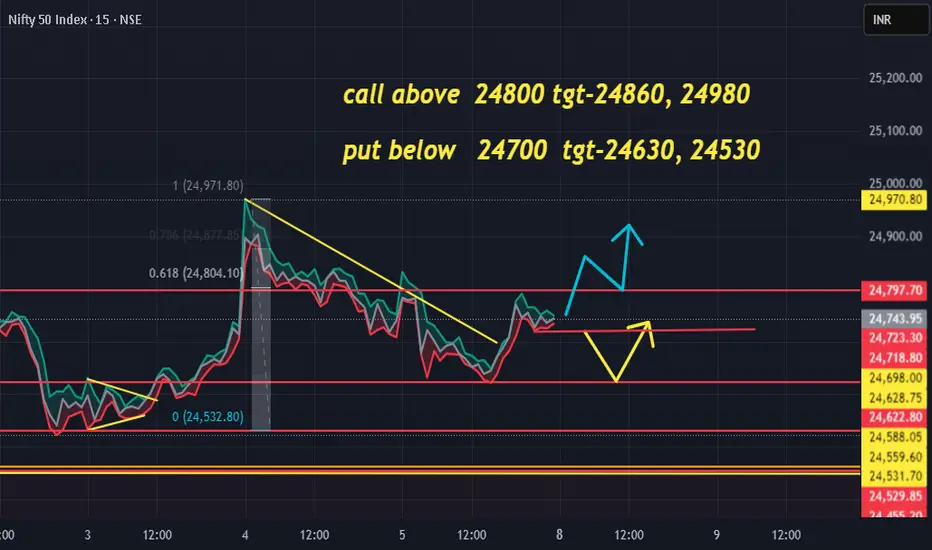
nifty setup for 10/09/202524800-24700 no trading zone
dear retailers dont trade between above zone and avoid from trape .
call above 24800 tgt-24860, 24980
gap up and break below 24700 than go for it
put below 24700 tgt-24630, 24530
major gap down than wait
for confirmation 24630 act as a resistance and possible to reverse for tgt 24700.
More bulls added in Nifty today..keep loadingSo once again Nifty tried to sustain above 24800 but failed. And that’s why we saw another round of Sell-On-Rise.
I’ve been repeating this – until we get a weekly closing above this level, we need to stay cautious and avoid opening any aggressive positions in Nifty.
But today an interesting thing happened – Nifty’s Pivot has moved up to 24803 and PP is 0.12%.
1. Retail index has picked up.
2. Sellers’ volume was higher by 3M.
3. Momentum is up.
4. Trend turned more positive.
5. Market breadth is also positive.
So overall my view remains bullish. But data suggests that tomorrow neither options nor stocks will give big moves. So we can expect a sideway day with bullish tone intact.
Only those stocks with high momentum and relative strength will move – and I’ll focus on trading exactly those.
Support for tomorrow is at 24777 and resistance at 24850.
On the sector side, Metals need to be on the radar tomorrow.
NSE:BANKNIFTY trend is a bit weak, but in coming days it may get a push. A proper move will only come above 54700.
As I said clearly today – it was a day for options trades. And options performed much better than equities.
I traded NSE:MOTHERSON call options today – it gave a massive 90%+ move. Entry was a bit late but still booked good profit.
Second trade was in NSE:NIFTY options for 23rd September expiry, which I am still holding.
My other trades that performed well today:
NSE:IOLCP – +15.35%
NSE:MOBIKWIK – +10.77%
NSE:KIOCL – +4.88%, went up to +8% intraday
📊 Levels at a glance:
Nifty Pivot: 24803
Support: 24777
Resistance: 24850
Pivot Percentile: 0.12%
Bias: Bullish but cautious until 24800+ weekly close
BankNifty Support: 53500
BankNifty Resistance: 54700 (break = momentum)
Trend: Weak but possible push in coming days
Sectors on Radar: Metals, high momentum + relative strength stocks
That’s all for today. Take care and have a profitable tomorrow.
#Nifty #StockToWatch
Nifty Analysis EOD – September 8, 2025 – Monday🟢 Nifty Analysis EOD – September 8, 2025 – Monday 🔴
Shooting Star Signals – Bulls vs Bears Tug-of-War Continues
🗞 Nifty Summary
Nifty opened with a 58-point gap-up, briefly surged another 28 points in the first minute, then slipped 73 points lower, nearly filling the gap. It found support and bounced back, rallying toward the PDH and resistance zone at 24,835 ~ 24,845, where it faced rejection and marked the day high at 24,845.7.
Support at 24,785 (previous resistance turned support) held well. Later, bulls attempted to break PDH and resistance again and succeeded temporarily. However, a long-term trendline held firm and ultimately broke. That breakout attempt turned into a false breakout, and strong selling pressure erased all intraday gains. The index closed near the day’s low at 24,773.15, just 32 points higher than the prior close.
The last 3 consecutive red candles, each with marginal gains, reflect ongoing selling pressure at higher levels.
🛡 5 Min Intraday Chart with Levels
📉 Daily Time Frame Chart with Intraday Levels
🕯 Daily Candle Breakdown
Open: 24,802.60
High: 24,885.50
Low: 24,751.55
Close: 24,773.15
Change: +32.15 (+0.13%)
🏗️ Structure Breakdown
Red candle (Close < Open).
Body: 29.45 points → small body (indecision).
Upper wick: 82.90 points → long upper wick indicates strong rejection.
Lower wick: 21.60 points → short.
📚 Interpretation
The market opened higher and attempted to sustain at highs but was met with strong supply near 24,880.
Selling pressure dominated, pushing the price back toward the lows.
Long upper wick signals profit-booking and bearish hesitation.
🕯Candle Type
Shooting Star / Inverted Hammer (bearish context) → suggests resistance and inability to extend bullish momentum.
🔍 Short-Term View – September 9, 2025
Resistance: 24,895 – 24,910 (strong supply zone).
Support: 24,750 (today’s defended level), then 24,620.
👉 Bias Direction:
Failure to cross 24,880 may lead to renewed weakness.
A close below 24,750 could drag the index quickly toward 24,620.
🚩 Current Market Sentiment:
A tug-of-war:
Bulls defending 24,620–24,650.
Bears defending 24,880–24,980.
A decisive breakout from this range will determine the next directional move.
🛡 5 Min Intraday Chart
⚔️ Gladiator Strategy Update
ATR: 204.9
IB Range: 87.2 → Medium
Market Structure: Balanced
Trade Highlights:
12:35 AM – Long Trigger → SL Hit
📌 Support & Resistance Levels
Resistance Zones:
24,785
24,835 ~ 24,845
24,895 ~ 24,910
24,975 ~ 25,004
Support Zones:
24,685
24,657
24,630 ~ 24,620
24,540 ~ 24,525
💡 Final Thoughts
Today’s Shooting Star reflects a clear bearish bias at higher levels. Despite small gains, the inability to sustain above 24,880 highlights selling pressure. Until bulls reclaim 24,880–24,910 convincingly, expect continued sideways to bearish action.
📖 “When resistance holds, strength is tested, and only time reveals the winner.”
✏️ Disclaimer
This is just my personal viewpoint. Always consult your financial advisor before taking any action.

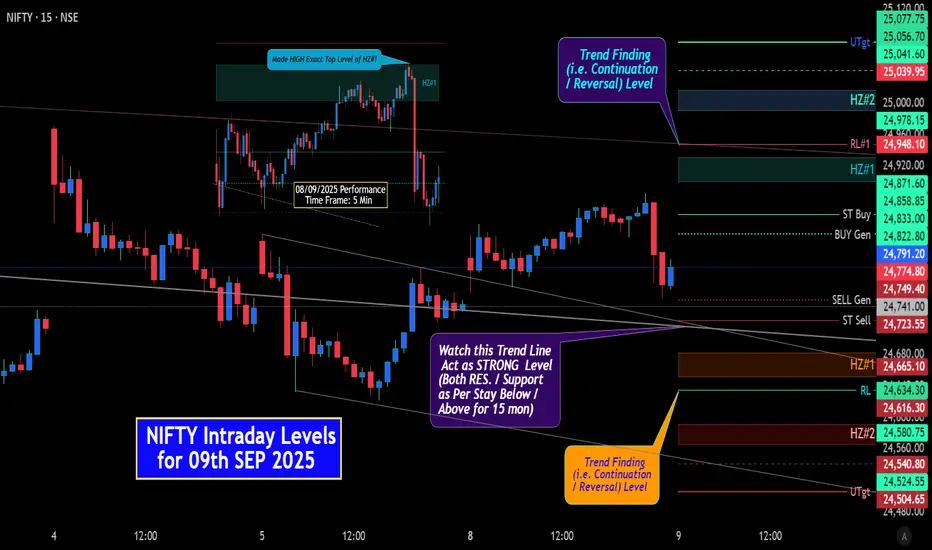
NIFTY: Intraday Levels for 09th SEP 2025NIFTY: Intraday Levels for 09th SEP 2025
^^^^^^^ Plot Levels Using 3 Min, 5 Min Time frame in your Chart for Better Analysis ^^^^^^^
L#1: If the candle crossed & stays above the “Buy Gen”, it is treated / considered as Bullish bias.
L#2: If the candle stays above “Sell Gen” but below “Buy Gen”, it is treated / considered as Sidewise. Aggressive Traders can take Long position near “Sell Gen” either retesting or crossed from Below & vice-versa i.e. can take Short position near “Buy Gen” either retesting or crossed downward from Above.
L#3: If the candle crossed & stays below the “Sell Gen”, it is treated / considered a Bearish bias.
L#4: Possibility / Probability of REVERSAL near RL#1 & UTgt
HZ => Hurdle Zone, Specialty of “HZ#1 & HZ#2” is Sidewise (behaviour in Nature)
Rest Plotted and Mentioned on Chart
Color code Used:
Green =. Positive bias.
Red =. Negative bias.
RED in Between Green means Trend Finder / Momentum Change
/ CYCLE Change and Vice Versa.
Notice One thing: HOW LEVELS are Working.
Use any Momentum Indicator / Oscillator or as you "USED to" to Take entry.
📢 Disclaimer
I am not a SEBI-registered financial adviser.
The information, views, and ideas shared here are purely for educational and informational purposes only. They are not intended as investment advice or a recommendation to buy, sell, or hold any financial instruments.
Please consult with your financial advisor before making any trading or investment decisions
Trading and investing in the stock market involves risk, and you should do your own research and analysis. You are solely responsible for any decisions made based on this research.
nifty setup for 22/sep/2025past setup was hit .
now 25360-25280
market still stuck in this range .
retailers be careful dont getting trapped .
gap down than wait for level
25200 below buy put tgt -25100/25035.
if market near 25280 than also go for put ,
dont try for call side.
second half after 1 pm. possible recovery of market is only 10-20%
so focus on only 25280,25200 level traders .

Global IPO trends & SME listings1. Brief history — how we got here
IPOs historically follow cycles tied to macro liquidity, investor sentiment, and policy. The mid-2010s saw steady IPO activity, disrupted dramatically in 2020 by COVID-19; markets recovered in 2021 with a surge in tech and growth listings. 2022–2023 brought market corrections: higher interest rates, equity de-rating for growth assets, and legislative/regulatory shocks in key jurisdictions (China, EU regulatory changes). By late-2023 and into 2024, a combination of easing lulls in some markets, fresh corporate readiness, and improved public market reception produced a recovery in 2024 and a stronger H1 2025, with proceeds and listing counts rising year-over-year in many datasets. Global consultancies and market trackers reported this lift in IPO volume and proceeds in H1 2025 compared with H1 2024.
2. The numbers — volume, proceeds and notable metrics (2023–H1 2025)
Key empirical takeaways from market trackers and advisory firms:
Overall rebound: Several major reports recorded a meaningful rebound in H1 2025 versus H1 2024, both in number of listings and aggregate proceeds — an increase in global proceeds in the order of mid-teens percent for the first half of 2025.
Listings count: Different trackers report slightly different counts (methodologies vary — inclusion/exclusion of SPACs, smaller exchanges), but the trend is broadly consistent: 2024 saw more IPOs than 2023, and 2025 continued that momentum. Renaissance Capital and other IPO trackers show dozens to a few hundreds of IPOs in 2025 depending on inclusion rules.
SPACs and alternatives: SPAC activity — after a lull in 2021–2022 — resurfaced in 2024 and into 2025, contributing materially to total IPO counts and providing a revived route for some issuers. Reports indicate SPACs accounted for a significant share of IPO activity in early-to-mid 2025.
3. Structural shifts reshaping global IPO markets
3.1 Cross-border listings and jurisdictional choice
A striking trend in 2024–2025 is increasing cross-border activity: more issuers are choosing to list outside their home jurisdiction. The U.S. regained strong pull for many high-growth companies (including non-U.S. issuers), driven by deep liquidity pools, active institutional appetites, and better aftermarket performance in certain sectors. Advisory reports in 2025 document record cross-border listings with a large proportion choosing the U.S. as destination.
Drivers:
Liquidity and valuation premia: U.S. and certain developed exchanges still offer higher valuations and deeper institutional demand for large growth names.
Regulatory clarity or flexibility: Some markets provide disclosure frameworks attractive to growth companies (or conversely, some home markets face regulatory headwinds that push issuers abroad).
Strategic investor access: Listings in a target market can bring strategic investors, research coverage, and credibility within that investor base.
3.2 Return of alternative listing routes: SPACs, direct listings, and IPO hybrids
After the SPAC boom and subsequent regulatory scrutiny, SPAC issuance cooled but revived with a “new generation” that is more selective and better structured. Direct listings remain an option for certain capital-rich companies seeking liquidity without a traditional roadshow. Both alternatives change timing, cost and governance dynamics of going public and have become a permanent part of the capital-raising toolkit.
3.3 Bifurcation: mega-deals vs. SME venues
Large, high-value deals (megafirms, big privatizations, resource spin-outs) dominate headline proceeds, while separate ecosystems of SME or “growth market” exchanges (AIM, TSX Venture, BSE SME, Nasdaq First North, ChiNext, STAR Market derivatives) provide tailored listing regimes for smaller issuers. The result is a two-tiered market: a handful of large capital raisings plus a broad base of smaller listings, often on specialized SME platforms. The OECD and exchanges’ research stress the importance of SME markets in sustaining job creation and innovation.
4. Regional dynamics — how different markets are behaving
United States
The U.S. equity market remains magnetically attractive for large growth and tech names: deep pools of institutional capital, active aftermarket trading, and robust underwriting capacity. Q2 2025 saw a rise in the number of U.S. IPOs compared with the previous year, though proceeds per deal varied; aftermarket performance in several 2025 IPOs added confidence for issuers. At the same time, regulatory scrutiny (e.g., around disclosures and SPAC post-dealmaking) continues to influence structures.
Hong Kong & Mainland China
Hong Kong regained momentum as a listing hub—particularly for resource and state-linked listings—benefiting from several large issuances in 2025. Mainland China’s reforms and new issuance windows for certain domestic sectors (STAR/ChiNext) continue to create localized IPO activity. The Zijin Gold HK IPO in September 2025 exemplifies Hong Kong’s ability to host very large resource and strategic listings.
Europe & UK
European IPO activity improved, helped by AIM-style venues for growth firms and regional regulatory efforts to encourage listings. Europe also sees a concerted policy push (OECD, exchanges) to strengthen SME access to public markets. Fragmentation across multiple national exchanges, however, remains a challenge for pooled liquidity.
India and other emerging markets
India’s primary market has been notably active at the SME and mainboard level, spurred by domestic savings, retail participation, and state support for IPO pipelines. Local SME segments (BSE SME, NSE Emerge) offer lower cost and scaled compliance to help smaller issuers list. Emerging markets frequently oscillate between domestic demand surges and capital flight during global risk episodes. Recent Indian weeks showed dozens of new SME and mainboard offers crowding the pipeline, indicating robust local issuance appetite.
5. SME listings: design, purpose and global models
SME listing segments are not smaller copies of main markets — they’re intentionally designed to lower entry costs, provide simpler compliance, and sequence growth. Key features include:
Lower minimum capital/float thresholds and reduced free-float requirements.
Streamlined disclosure and ongoing reporting, often calibrated to firm size and investor sophistication.
Investor protection tradeoffs: more disclosure leniency can increase risk-return variability; many SME venues require more active retail education or specialist market makers to maintain liquidity.
Support services: mentorship programs, fast-track delisting safeguards, and post-listing support such as investor outreach and sustainability guidance.
Major SME market examples: AIM (London), Nasdaq First North (Nordics), BSE SME (India), TSX Venture/CSE (Canada), ChiNext (China). OECD and UN SSE (Sustainable Stock Exchanges) initiatives increasingly recommend exchanges offer sustainability guidance to SMEs to future-proof growth and attract ESG-minded capital.
6. Why SME listings matter (economic and financial rationales)
Capital access for growth: SMEs often lack scale for institutional private rounds or high-cost bank financing — a public listing can supply growth capital and an acquisition currency (listed shares).
Price discovery & signaling: Public markets provide transparent valuation benchmarks that can aid subsequent capital raises or exits.
Market discipline & governance: Listing brings governance upgrades that can improve managers’ incentives and access to professional networks.
Local economic development: SME listings can anchor local ecosystems, create jobs, and increase tax bases — a reason regulators promote SME markets. OECD analysis emphasizes this public-good aspect.
7. Demand side: who is buying IPOs today?
Institutional investors: Long-only funds, hedge funds and sovereign wealth funds participate in larger deals; they increasingly demand strong governance credentials, clear path to profitability, and defensible competitive positions.
Retail investors: Remain a crucial source of demand for SMEs and many mainboard deals, especially where allocation rules favor retail participation (notably in India). Retail interest can create short-term pricing momentum but also volatility.
Cornerstone & long-term investors: For very large listings (e.g., resource or infrastructure spin-outs), cornerstone investors anchor deals and signal confidence — examples in 2025 include large cornerstone allocations to major institutional investors.
8. Sector dynamics — who’s going public?
Technology & AI-enabled firms: Renewed interest in tech, especially AI infrastructure and enterprise AI plays, as investors seek exposure to transformative productivity gains.
Energy and resources: With commodity price cycles and strategic national interests, energy/resource listings (including miners and renewables) have been prominent, especially where projects require capital for expansion. The Zijin Gold listing is an example of a resource IPO that tapped strong appetite.
Financial services and fintech: Continued listings as fintechs mature and pursue scale.
Healthcare & biotech: Ongoing pipeline as research hits commercial inflection points and capital needs become public market-sized.
Sector mix varies by region: e.g., Asia has substantial resource and industrial deals in some periods, while the U.S. attracts high-growth tech and healthcare companies.
Conclusion
The global IPO market in 2024–H1 2025 is not merely recovering — it is evolving. Cross-border flows, alternative listing structures (SPACs/direct listings), renewed investor appetite for certain sectors, and a robust ecosystem of SME listing venues combine to make the public markets a more versatile but also more complex place. For issuers, investors and policymakers, the main task is to match strategies to market structure: pick the right venue, be operationally ready, and design investor engagement that reflects the realities of modern capital markets. Exchanges that successfully scaffold SME access — by combining reduced barriers, investor protection, and active post-listing support — will unlock substantial long-term economic value.