NIFTY: Intraday Levels for 08th SEP 2025 (NIFTY50 Spot)NIFTY50 SPOT: Intraday Levels for 08th SEP 2025
^^^^^^^ Plot Levels Using 3 Min, 5 Min Time frame in your Chart for Better Analysis ^^^^^^^
L#1: If the candle crossed & stays above the “Buy Gen”, it is treated / considered as Bullish bias.
L#2: If the candle stays above “Sell Gen” but below “Buy Gen”, it is treated / considered as Sidewise. Aggressive Traders can take Long position near “Sell Gen” either retesting or crossed from Below & vice-versa i.e. can take Short position near “Buy Gen” either retesting or crossed downward from Above.
L#3: If the candle crossed & stays below the “Sell Gen”, it is treated / considered a Bearish bias.
L#4: Possibility / Probability of REVERSAL near RL#1 & UTgt
HZ => Hurdle Zone, Specialty of “HZ#1 & HZ#2” is Sidewise (behaviour in Nature)
Rest Plotted and Mentioned on Chart
Color code Used:
Green =. Positive bias.
Red =. Negative bias.
RED in Between Green means Trend Finder / Momentum Change
/ CYCLE Change and Vice Versa.
Notice One thing: HOW LEVELS are Working.
Use any Momentum Indicator / Oscillator or as you "USED to" to Take entry.
📢 Disclaimer
I am not a SEBI-registered financial adviser.
The information, views, and ideas shared here are purely for educational and informational purposes only. They are not intended as investment advice or a recommendation to buy, sell, or hold any financial instruments.
Please consult with your financial advisor before making any trading or investment decisions
Trading and investing in the stock market involves risk, and you should do your own research and analysis. You are solely responsible for any decisions made based on this research.
NIFTY trade ideas
#NIFTY Intraday Support and Resistance Levels - 10/09/2025Nifty is expected to witness a gap up opening, continuing its momentum within the broader consolidation zone. The index has been trading in a tight range, and today’s levels will be crucial to determine the intraday direction.
On the upside, if Nifty sustains above 24,700–24,750, buying momentum could push it towards 24,850, 24,900, and 24,950+. A breakout above 25,050 would signal strong bullish sentiment, opening the way for further targets at 25,150, 25,200, and 25,250+.
On the downside, weakness may come into play if Nifty slips below 24,950–24,900. This could trigger a reversal towards 24,850, 24,800, and 24,750 levels. A break below 24,700 may extend the fall with deeper downside possibilities.
Overall, Nifty remains in a consolidation phase, and traders should focus on the breakout levels for clear intraday opportunities. A disciplined approach with strict stop-losses will be key in managing volatility around these zones.

Find trading level with plan in nifty indexMarket treat Completely sideways but we have to find opportunity at any condition. We can wait for our level (price). It is clear that at this time two lower high is available in chart. Big player try to gain the liquidity.
NIFTY50 Technical Update🔹 NIFTY has formed a W-Pattern, indicating it is currently in accumulation mode.
📍 Key Levels to Watch:
First Stop: 25,027
Major Support: 24,891 (Daily basis)
⚠️ If 24,891 breaks, then possible downside targets are:
➡️ 24,154
➡️ 23,865
➡️ 22,915
🐂 Stay alert for trend confirmation.
🐻 Manage risk wisely.
🔖 #Nifty50 #Nifty #StockMarketIndia #StockMarketNews #MarketUpdate #IndianStockMarket #NSE #Sensex #BullAndBear #TradingSignals #TechnicalAnalysis #StockMarketTrends #BuySellSignals #StockTrading
get more updates @ #𝗧𝗿𝘂𝗲𝗗𝗶𝗿𝗲𝗰𝘁𝗶𝗼𝗻𝘀𝟭

24 sep 2025 Nifty50 kye level
🔑 Key Levels (24-09-2025)
25,480 → Above 10m closing → Shot Cover Level (Bearish cover zone)
25,328 → Above 10m hold CE by Entry Level / Below 10m hold PE by Risky Zone
25,230 → Positive Trade View वर / Negative Trade View खाली
25,120 → Opening आधार (S1 CE Buy level / R1 PE Buy level)
25,018 → CE Buy by Level / PE Sell by Level
24,920 → CE Buy Safe Zone level
24,880 → Below 10m Unwinding level (Strong bearish)

Nifty Analysis EOD – September 23, 2025 – Tuesday🟢 Nifty Analysis EOD – September 23, 2025 – Tuesday 🔴
Expiry Day Drama – Two-Sided Moves, Tug of War Continues
🗞 Nifty Summary
Nifty opened with a 43-point gap up right at the strong resistance of 25,240, but selling pressure quickly kicked in. Within the first 30 minutes, the index fell 140 points from the high to test the crucial support at 25,115.
From there, a descending triangle pattern formed. Breakdown was triggered at 11:00 AM, but the next support at 25,085 came to the rescue. This 25,085–25,115 zone acted as a base, and once 25,115 was reclaimed, Nifty surged 108 points back to PDC. After a brief pause, the rally extended toward the day’s high, but the CPR Zone, CDO, CDH, and strong 25,240 resistance halted the move. Sellers pushed the index back below mean and PDC, closing at 25,169.50.
👉 Overall, expiry day was a roller coaster —
Great for option buyers with two-sided moves, but also tough to handle both sides that saw traps.
Tough for option sellers as both sides move on expiry day, too hot to handle.
Another spinning top–like candle emerged, reflecting the tug of war. With range expansion already visible, the next session may cool down into a narrower range, provided today’s high or low holds.
🛡 5 Min Intraday Chart with Levels
📉 Daily Time Frame Chart with Intraday Levels
🕯 Daily Candle Breakdown
Open: 25,209.00
High: 25,261.90
Low: 25,084.65
Close: 25,169.50
Change: −32.85 (−0.13%)
🏗️ Structure Breakdown
Small red candle (Close < Open).
Body: ~39.5 points → small body, indecision.
Range: ~177.25 points → wide swings.
Upper wick: ~52.90 points → rejection at 25,260.
Lower wick: ~84.85 points → buyers active at 25,085.
Close near lower-mid of the range.
📚 Interpretation
Opened at resistance → sellers took control early.
Buyers held 25,085–25,115, creating a base.
Rally attempts were capped at 25,240 resistance.
Close shows market still in tug of war, with sellers slightly ahead.
🕯Candle Type
Spinning Top → indecision but weak bias.
📉📈 Short-Term View – September 24, 2025
Resistance Zone: 25,250–25,340 → repeated selling here.
Support Zone: 25,085–25,115 → defended again today.
Break below 25,085 → downside to 25,048 / 25,000 / 24,990.
Bullish continuation only above 25,260–25,340.
👉 3-Day Context (19th → 23rd Sept)
19th Sept: Bearish rejection candle from ~25,420.
22nd Sept: Strong rejection near 25,330, weak close at 25,202.
23rd Sept: Spinning Top at 25,170 → hesitation, indecision, tilt bearish.
👉 The sequence shows distribution pressure building.
📌 Conclusion:
Nifty is losing bullish momentum as sellers hold 25,250–25,450 firmly, while bulls are desperately defending 25,080–25,150. Until one side gives way, expect volatile but range-bound trade. The bias leans toward a short-term correction unless bulls reclaim 25,330+ convincingly.
🛡 5 Min Intraday Chart
⚔️ Gladiator Strategy Update
ATR: 162.87
IB Range: 140.8 → Big
Market Structure: Imbalanced
Trade Highlights:
09:20 → Short Trade ✅ Target Achieved (R:R = 1:2)
11:10 → Short Trade ❌ SL Hit
12:25 → Long Trade ✅ Target Achieved (R:R = 1:3.63)
📌 Support & Resistance Levels
Resistance Zones:
25,240
25,290 ~ 25,307
25,340 ~ 25,385
25,425 ~ 25,460
Support Zones:
25,165 ~ 25,140
25,115
25,085
25,045
25,000 ~ 24,990
💡 Final Thoughts
The market played both sides on expiry day, rewarding nimble traders and punishing late movers. Key battle zone remains 25,085–25,150 vs. 25,250–25,340. Whoever wins this zone will dictate the next directional leg.
📖 “A range is the battlefield — breakout is the victory.”
✏️ Disclaimer
This is just my personal viewpoint. Always consult your financial advisor before taking any action.

Nifty Analysis EOD – September 22, 2025 – Monday🟢 Nifty Analysis EOD – September 22, 2025 – Monday 🔴
Gap-Down, Whipsaw, and Late-Session Breakdown
🗞 Nifty Summary
Nifty opened with a 93-point gap down at 25,240, right at our support level, but slipped another 48 points to test 25,212, marking the day’s low. A sharp 120-point recovery followed, filling the gap within 35 minutes.
For most of the session, price action stayed muted in a 54-point range (25320–25267) near PDL and S1, reflecting indecision. However, the late second half brought a sharp sell-off as 25,240 broke, sending Nifty to test 25,165 before a minor bounce. The index closed at 25,202.35, just above the day’s low.
👉 Overall, the session was rough:
Morning = Bulls dominated with recovery.
Midday = Both sides in a stalemate.
Late = Bears seized control with a decisive breakdown.
🛡 5 Min Intraday Chart with Levels
📉 Daily Time Frame Chart with Intraday Levels
🕯 Daily Candle Breakdown
Open: 25,238.10
High: 25,331.70
Low: 25,151.05
Close: 25,202.35
Change: −124.70 (−0.49%)
🏗️ Structure Breakdown
Red candle (Close < Open).
Body: ~35.75 points (small vs. range).
Range: ~180.65 points (high intraday volatility).
Upper wick: ~93.60 points (rejection near 25,331).
Lower wick: ~51.30 points (buyers tried to defend near 25,150).
Closed near the day’s low → bears ended in control.
📚 Interpretation
Nifty tested 25,331 early but supply kicked in hard.
Selling dragged price to 25,151 before buyers attempted defense.
Recovery attempts failed near 25,200 → sellers controlled late trade.
🕯Candle Type
Resembles an Inverted Hammer / Shooting Star–like red candle, with strong upper rejection.
📉📈 Short-Term View – September 23, 2025
Resistance Zone: 25,320–25,350 (tested, rejected).
Support Zone: 25,150–25,200 (buyers active intraday, but weak close).
Break below 25,150 → could extend fall toward 25,050–25,000.
Upside strength only if 25,330+ is reclaimed.
📌 Conclusion: Recent sessions are showing distribution signs after a strong rally. Bulls are holding 25,150–25,200, but repeated failures near 25,330–25,450 hint at a short-term pullback unless reclaimed.
🛡 5 Min Intraday Chart
⚔️ Gladiator Strategy Update
ATR: 161.28
IB Range: 120.10 → Medium
Market Structure: Imbalanced
Trade Highlights:
11:15 Short Trade → ❌ SL Hit
13:20 Short Trade → ✅ Target Achieved (R:R = 1:2)
📌 Support & Resistance Levels
Resistance Zones:
25,240
25,290 ~ 25,307
25,340 ~ 25,385
25,425 ~ 25,460
Support Zones:
25,165 ~ 25,140
25,115
25,085
25,045
25,000 ~ 24,990
💡 Final Thoughts
The index danced in all directions today but closed with bears firmly ahead. Buyers are still defending 25,150–25,200, but cracks are visible.
👉 Watch 25,150 carefully — losing this could open the gates toward 25,000.
📖 “Markets don’t move in straight lines — they trap, test, and only then trend.”
✏️ Disclaimer
This is just my personal viewpoint. Always consult your financial advisor before taking any action.

Global IPO trends & SME listings1. Brief history — how we got here
IPOs historically follow cycles tied to macro liquidity, investor sentiment, and policy. The mid-2010s saw steady IPO activity, disrupted dramatically in 2020 by COVID-19; markets recovered in 2021 with a surge in tech and growth listings. 2022–2023 brought market corrections: higher interest rates, equity de-rating for growth assets, and legislative/regulatory shocks in key jurisdictions (China, EU regulatory changes). By late-2023 and into 2024, a combination of easing lulls in some markets, fresh corporate readiness, and improved public market reception produced a recovery in 2024 and a stronger H1 2025, with proceeds and listing counts rising year-over-year in many datasets. Global consultancies and market trackers reported this lift in IPO volume and proceeds in H1 2025 compared with H1 2024.
2. The numbers — volume, proceeds and notable metrics (2023–H1 2025)
Key empirical takeaways from market trackers and advisory firms:
Overall rebound: Several major reports recorded a meaningful rebound in H1 2025 versus H1 2024, both in number of listings and aggregate proceeds — an increase in global proceeds in the order of mid-teens percent for the first half of 2025.
Listings count: Different trackers report slightly different counts (methodologies vary — inclusion/exclusion of SPACs, smaller exchanges), but the trend is broadly consistent: 2024 saw more IPOs than 2023, and 2025 continued that momentum. Renaissance Capital and other IPO trackers show dozens to a few hundreds of IPOs in 2025 depending on inclusion rules.
SPACs and alternatives: SPAC activity — after a lull in 2021–2022 — resurfaced in 2024 and into 2025, contributing materially to total IPO counts and providing a revived route for some issuers. Reports indicate SPACs accounted for a significant share of IPO activity in early-to-mid 2025.
3. Structural shifts reshaping global IPO markets
3.1 Cross-border listings and jurisdictional choice
A striking trend in 2024–2025 is increasing cross-border activity: more issuers are choosing to list outside their home jurisdiction. The U.S. regained strong pull for many high-growth companies (including non-U.S. issuers), driven by deep liquidity pools, active institutional appetites, and better aftermarket performance in certain sectors. Advisory reports in 2025 document record cross-border listings with a large proportion choosing the U.S. as destination.
Drivers:
Liquidity and valuation premia: U.S. and certain developed exchanges still offer higher valuations and deeper institutional demand for large growth names.
Regulatory clarity or flexibility: Some markets provide disclosure frameworks attractive to growth companies (or conversely, some home markets face regulatory headwinds that push issuers abroad).
Strategic investor access: Listings in a target market can bring strategic investors, research coverage, and credibility within that investor base.
3.2 Return of alternative listing routes: SPACs, direct listings, and IPO hybrids
After the SPAC boom and subsequent regulatory scrutiny, SPAC issuance cooled but revived with a “new generation” that is more selective and better structured. Direct listings remain an option for certain capital-rich companies seeking liquidity without a traditional roadshow. Both alternatives change timing, cost and governance dynamics of going public and have become a permanent part of the capital-raising toolkit.
3.3 Bifurcation: mega-deals vs. SME venues
Large, high-value deals (megafirms, big privatizations, resource spin-outs) dominate headline proceeds, while separate ecosystems of SME or “growth market” exchanges (AIM, TSX Venture, BSE SME, Nasdaq First North, ChiNext, STAR Market derivatives) provide tailored listing regimes for smaller issuers. The result is a two-tiered market: a handful of large capital raisings plus a broad base of smaller listings, often on specialized SME platforms. The OECD and exchanges’ research stress the importance of SME markets in sustaining job creation and innovation.
4. Regional dynamics — how different markets are behaving
United States
The U.S. equity market remains magnetically attractive for large growth and tech names: deep pools of institutional capital, active aftermarket trading, and robust underwriting capacity. Q2 2025 saw a rise in the number of U.S. IPOs compared with the previous year, though proceeds per deal varied; aftermarket performance in several 2025 IPOs added confidence for issuers. At the same time, regulatory scrutiny (e.g., around disclosures and SPAC post-dealmaking) continues to influence structures.
Hong Kong & Mainland China
Hong Kong regained momentum as a listing hub—particularly for resource and state-linked listings—benefiting from several large issuances in 2025. Mainland China’s reforms and new issuance windows for certain domestic sectors (STAR/ChiNext) continue to create localized IPO activity. The Zijin Gold HK IPO in September 2025 exemplifies Hong Kong’s ability to host very large resource and strategic listings.
Europe & UK
European IPO activity improved, helped by AIM-style venues for growth firms and regional regulatory efforts to encourage listings. Europe also sees a concerted policy push (OECD, exchanges) to strengthen SME access to public markets. Fragmentation across multiple national exchanges, however, remains a challenge for pooled liquidity.
India and other emerging markets
India’s primary market has been notably active at the SME and mainboard level, spurred by domestic savings, retail participation, and state support for IPO pipelines. Local SME segments (BSE SME, NSE Emerge) offer lower cost and scaled compliance to help smaller issuers list. Emerging markets frequently oscillate between domestic demand surges and capital flight during global risk episodes. Recent Indian weeks showed dozens of new SME and mainboard offers crowding the pipeline, indicating robust local issuance appetite.
5. SME listings: design, purpose and global models
SME listing segments are not smaller copies of main markets — they’re intentionally designed to lower entry costs, provide simpler compliance, and sequence growth. Key features include:
Lower minimum capital/float thresholds and reduced free-float requirements.
Streamlined disclosure and ongoing reporting, often calibrated to firm size and investor sophistication.
Investor protection tradeoffs: more disclosure leniency can increase risk-return variability; many SME venues require more active retail education or specialist market makers to maintain liquidity.
Support services: mentorship programs, fast-track delisting safeguards, and post-listing support such as investor outreach and sustainability guidance.
Major SME market examples: AIM (London), Nasdaq First North (Nordics), BSE SME (India), TSX Venture/CSE (Canada), ChiNext (China). OECD and UN SSE (Sustainable Stock Exchanges) initiatives increasingly recommend exchanges offer sustainability guidance to SMEs to future-proof growth and attract ESG-minded capital.
6. Why SME listings matter (economic and financial rationales)
Capital access for growth: SMEs often lack scale for institutional private rounds or high-cost bank financing — a public listing can supply growth capital and an acquisition currency (listed shares).
Price discovery & signaling: Public markets provide transparent valuation benchmarks that can aid subsequent capital raises or exits.
Market discipline & governance: Listing brings governance upgrades that can improve managers’ incentives and access to professional networks.
Local economic development: SME listings can anchor local ecosystems, create jobs, and increase tax bases — a reason regulators promote SME markets. OECD analysis emphasizes this public-good aspect.
7. Demand side: who is buying IPOs today?
Institutional investors: Long-only funds, hedge funds and sovereign wealth funds participate in larger deals; they increasingly demand strong governance credentials, clear path to profitability, and defensible competitive positions.
Retail investors: Remain a crucial source of demand for SMEs and many mainboard deals, especially where allocation rules favor retail participation (notably in India). Retail interest can create short-term pricing momentum but also volatility.
Cornerstone & long-term investors: For very large listings (e.g., resource or infrastructure spin-outs), cornerstone investors anchor deals and signal confidence — examples in 2025 include large cornerstone allocations to major institutional investors.
8. Sector dynamics — who’s going public?
Technology & AI-enabled firms: Renewed interest in tech, especially AI infrastructure and enterprise AI plays, as investors seek exposure to transformative productivity gains.
Energy and resources: With commodity price cycles and strategic national interests, energy/resource listings (including miners and renewables) have been prominent, especially where projects require capital for expansion. The Zijin Gold listing is an example of a resource IPO that tapped strong appetite.
Financial services and fintech: Continued listings as fintechs mature and pursue scale.
Healthcare & biotech: Ongoing pipeline as research hits commercial inflection points and capital needs become public market-sized.
Sector mix varies by region: e.g., Asia has substantial resource and industrial deals in some periods, while the U.S. attracts high-growth tech and healthcare companies.
Conclusion
The global IPO market in 2024–H1 2025 is not merely recovering — it is evolving. Cross-border flows, alternative listing structures (SPACs/direct listings), renewed investor appetite for certain sectors, and a robust ecosystem of SME listing venues combine to make the public markets a more versatile but also more complex place. For issuers, investors and policymakers, the main task is to match strategies to market structure: pick the right venue, be operationally ready, and design investor engagement that reflects the realities of modern capital markets. Exchanges that successfully scaffold SME access — by combining reduced barriers, investor protection, and active post-listing support — will unlock substantial long-term economic value.
NIFTY Intra & Swing Levels for 22nd Sep 2025 Onwards.• Overall Uptrend: The Nifty 50 has been in a sustained uptrend for most of September 2025. It has recovered significantly from a late-August low and has been making a series of higher highs and higher lows. Though there is PAUSE (but without Confirmation) on last trading Day as Pattern Breaks from " H-H - H-L" to "Lower HIGH - Lower LOW"
• Recent Volatility: On September 19th, the market saw a slight decline, snapping a three-day winning streak. This indicates some profit-booking at higher levels and a potential for short-term consolidation or volatility.
• Underlying Strength: The overall technical setup remains bullish, supported by positive momentum indicators and strong domestic institutional investor (DII) buying. The market is trading above its key moving averages, reinforcing the positive sentiment.
In summary, the trend for the Nifty 50 in September 2025 is bullish, despite a recent minor pullback.
Implied Volatility (IV)
Implied Volatility (IV) is a crucial metric for option traders as it reflects the market's expectation of future price swings. A higher IV suggests greater expected volatility, while a lower IV suggests a more stable price outlook.
• Nifty 50:
o The India VIX, which measures the implied volatility of Nifty 50 options, closed up slightly at 9.9675 on Friday, September 19, 2025 (On 18/09/2025 closing was 9.885), But recovered from month LOW 9.3975
o The 30-day IV for the Nifty 50 is around 12.3. This is a relatively low reading, suggesting measured optimism and a general lack of fear in the market.
So to Create Fear What Institutions do................. Wait & See.
# "WEEKLY Levels" mentioned in BOX format.
^^^^^^^ Plot Levels Using 3 Min, 5 Min Time frame in your Chart for Better Analysis ^^^^^^^
L#1: If the candle crossed & stays above the “Buy Gen”, it is treated / considered as Bullish bias.
L#2: Possibility / Probability of REVERSAL near RLB#1 & UBTgt
L#3: If the candle stays above “Sell Gen” but below “Buy Gen”, it is treated / considered as Sidewise. Aggressive Traders can take Long position near “Sell Gen” either retesting or crossed from Below & vice-versa i.e. can take Short position near “Buy Gen” either retesting or crossed downward from Above.
L#4: If the candle crossed & stays below the “Sell Gen”, it is treated / considered a Bearish bias.
L#5: Possibility / Probability of REVERSAL near RLS#1 & USTgt
HZB (Buy side) & HZS (Sell side) => Hurdle Zone,
*** Specialty of “HZB#1, HZB#2 HZS#1 & HZS#2” is Sidewise (behaviour in Nature)
Rest Plotted and Mentioned on Chart
Color code Used:
Green =. Positive bias.
Red =. Negative bias.
RED in Between Green means Trend Finder / Momentum Change
/ CYCLE Change and Vice Versa.
Notice One thing: HOW LEVELS are Working.
Use any Momentum Indicator / Oscillator or as you "USED to" to Take entry.
📢 Disclaimer
I am not a SEBI-registered financial adviser.
The information, views, and ideas shared here are purely for educational and informational purposes only. They are not intended as investment advice or a recommendation to buy, sell, or hold any financial instruments.
Trading and investing in the stock market involves risk, and you should do your own research and analysis. You are solely responsible for any decisions made based on this research.
"As HARD EARNED MONEY IS YOUR's, So DECISION SHOULD HAVE TO BE YOUR's".
DO COMMENT FOR BETTERMENT OF POST.

Gold as a Safe HavenWhy Global Investors Turn to Gold During Market Uncertainty
1. The Concept of a Safe Haven
A safe haven is an investment that retains or increases its value during periods of financial market stress or economic instability. Such assets offer investors protection against volatility, uncertainty, and systemic risks. Typical safe havens include:
Gold – A tangible store of value.
U.S. Treasury Bonds – Backed by the U.S. government.
Swiss Franc – A stable currency often seen as a hedge against global turmoil.
Japanese Yen – Another defensive currency.
Among these, gold stands out because it has both intrinsic value and historical precedent. Unlike currencies, which are tied to governments and central banks, gold is independent of political promises. Unlike corporate bonds or stocks, it doesn’t rely on business performance. This makes gold universally attractive as a hedge in uncertain times.
2. Historical Significance of Gold
To understand gold’s safe haven status, it is essential to trace its history:
a) Gold as Money
For thousands of years, gold served as money. From the Lydians minting the first gold coins in the 7th century BCE to the widespread use of gold coins across empires, gold became synonymous with value.
b) The Gold Standard
In the 19th and early 20th centuries, most economies adhered to the gold standard, where currencies were directly backed by gold. This system provided monetary stability, limiting inflation because money supply was tied to gold reserves.
c) End of the Gold Standard
In 1971, the U.S. under President Nixon abandoned the gold standard, ending the Bretton Woods system. Currencies became “fiat” (backed by government decree rather than physical assets). Despite this, gold’s importance didn’t vanish—it simply shifted from being official money to being a key hedge and investment asset.
d) Gold During Crises
Throughout history, gold prices have surged during crises:
During the Great Depression of the 1930s, gold was hoarded as banks collapsed.
In the 1970s, oil shocks and inflation pushed gold prices to record highs.
During the 2008 Global Financial Crisis, gold soared while equities collapsed.
In the COVID-19 pandemic (2020), gold hit record highs as markets plunged.
3. Why Investors Turn to Gold During Market Uncertainty
There are several reasons why gold is considered a safe haven:
a) Scarcity and Limited Supply
Gold cannot be created at will. Unlike paper money, central banks cannot print gold. Mining new gold is expensive and time-consuming, meaning supply growth is limited. This scarcity supports its long-term value.
b) Universal Acceptance
Gold is universally recognized across cultures and borders. Whether in Asia, Europe, Africa, or the Americas, gold carries intrinsic appeal. In times of crisis, this universal acceptance makes gold highly liquid and tradable.
c) Inflation Hedge
Gold is often seen as a hedge against inflation. When central banks print excessive money or when the purchasing power of currencies declines, gold tends to rise in value. For instance, in the 1970s, U.S. inflation soared, and so did gold prices.
d) Protection Against Currency Depreciation
When a country’s currency weakens, investors often shift to gold. For example, during the Eurozone debt crisis, European investors moved capital into gold to avoid potential currency collapses.
e) Store of Value in Geopolitical Turmoil
Wars, political instability, or trade tensions often trigger a flight to gold. During the Russia-Ukraine war (2022), investors flocked to gold, fearing disruptions in global trade and energy supplies.
f) Low Correlation with Other Assets
Gold has a low or even negative correlation with assets like equities and bonds. This means when markets fall, gold often rises, making it an excellent diversification tool in a portfolio.
4. Case Studies of Gold as a Safe Haven
a) The 2008 Financial Crisis
The collapse of Lehman Brothers and subsequent market meltdown saw investors rushing to gold. Between 2007 and 2011, gold prices nearly doubled, reaching $1,900 per ounce in 2011.
b) The COVID-19 Pandemic (2020)
As global markets crashed in March 2020, gold initially dipped due to liquidity demands but soon rallied to record highs above $2,000 per ounce by August 2020.
c) Inflationary Pressures (2021–2023)
With central banks printing trillions in stimulus, inflation spiked worldwide. Gold again acted as a hedge, maintaining strong demand despite rising interest rates.
5. How Investors Use Gold
Investors have multiple ways to gain exposure to gold:
Physical Gold – Bars, coins, jewelry (traditional and safe but involves storage costs).
Gold ETFs – Exchange-traded funds like SPDR Gold Trust (GLD) allow easy trading.
Gold Futures & Options – For traders seeking leveraged exposure.
Gold Mining Stocks – Companies engaged in gold production often benefit from rising prices.
Central Bank Reserves – Nations hold gold reserves as insurance against currency crises.
6. The Psychology of Gold Investment
Gold is not just a financial asset—it is deeply tied to human psychology. In uncertain times, people want something tangible and timeless. Unlike digital assets or government bonds, gold provides a sense of security rooted in thousands of years of human experience. This psychological factor explains why, even in modern times, gold demand rises sharply during market panic.
Conclusion
Gold’s enduring reputation as a safe haven asset stems from its scarcity, universal acceptance, ability to hedge against inflation and currency depreciation, and low correlation with other asset classes. History has repeatedly shown that during wars, recessions, financial crises, and inflationary spirals, gold protects wealth when other assets fail.
Although gold is not without limitations—it generates no yield and can be volatile—it remains one of the most trusted hedges against uncertainty. In an era of rising global instability, central bank money printing, and volatile equity markets, the ancient allure of gold is unlikely to fade.
For investors seeking stability in an uncertain world, gold continues to glitter as the ultimate safe haven.

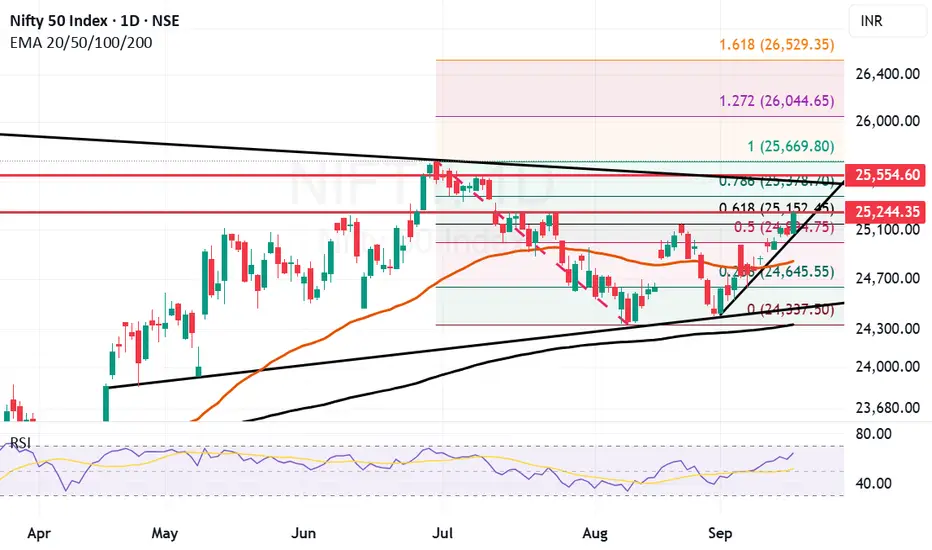
Nifty trying to break the shackles and breakout. Nifty gave a great closing above important Fibonacci resistance. Today Nifty closed at 25239 which is fairly above the Fibonacci resistance at 25152. The next Fibonacci resistance is at 25378 which is also a Trend line resistance.
Before reaching there the resistance just round the corner is at 25244. So the key resistance now are at 25244 and 25378. Above 25378 there is possibility of very strong bullish breakout which can lead Nifty towards 25554 and 25669. Supports for Nifty currently remain at 25152, 24994 both Fibonacci levels.
Mother line support of daily chart remains at 24844. Shadow of the candle right now neutral as the RSI on hourly chart is getting into overbought zone. RSI however on the daily chart still shows more room to grow.
Disclaimer: The above information is provided for educational purpose, analysis and paper trading only. Please don't treat this as a buy or sell recommendation for the stock or index. The Techno-Funda analysis is based on data that is more than 3 months old. Supports and Resistances are determined by historic past peaks and Valley in the chart. Many other indicators and patterns like EMA, RSI, MACD, Volumes, Fibonacci, parallel channel etc. use historic data which is 3 months or older cyclical points. There is no guarantee they will work in future as markets are highly volatile and swings in prices are also due to macro and micro factors based on actions taken by the company as well as region and global events. Equity investment is subject to risks. I or my clients or family members might have positions in the stocks that we mention in our educational posts. We will not be responsible for any Profit or loss that may occur due to any financial decision taken based on any data provided in this message. Do consult your investment advisor before taking any financial decisions. Stop losses should be an important part of any investment in equity.
Global Supply Chain Disruptions1. Understanding Global Supply Chains
What is a Supply Chain?
A supply chain is the entire network of individuals, organizations, resources, activities, and technologies involved in creating and delivering a product. It includes:
Sourcing raw materials (mining metals, growing crops, drilling oil).
Manufacturing and production (turning raw materials into components or finished products).
Logistics and transportation (shipping goods via sea, air, rail, or road).
Distribution and retail (warehouses, online platforms, supermarkets, etc.).
End consumers (people or businesses buying the final product).
When this network is stretched across borders, it becomes a global supply chain.
Why Globalization Made Supply Chains Complex
From the 1980s onward, globalization and free trade agreements encouraged companies to outsource production to low-cost countries. For example:
Clothing brands shifted manufacturing to Bangladesh, Vietnam, and China.
Electronics companies sourced chips from Taiwan and South Korea.
Automakers relied on a global network of suppliers for engines, batteries, and steel.
This “just-in-time” model reduced costs by minimizing inventory and maximizing efficiency—but it also created fragility. A delay in one part of the world could stall the entire chain.
2. Causes of Global Supply Chain Disruptions
Global supply chains face disruptions from multiple sources. These can be broadly classified into natural, political, economic, technological, and human-related factors.
A. Natural Disasters & Pandemics
COVID-19 Pandemic (2020–2022): Factories in China shut down, shipping routes froze, and workers stayed home. This caused a shortage of everything—from masks and medicines to electronics and automobiles.
2011 Japan Earthquake & Tsunami: Disrupted production of automotive and electronic components, particularly semiconductors.
Hurricane Katrina (2005): Crippled oil production and refined products supply in the U.S.
Nature remains an unpredictable factor that no supply chain can fully eliminate.
B. Geopolitical Tensions & Wars
Russia-Ukraine War (2022–present): Disrupted supplies of wheat, corn, natural gas, and oil. Many countries dependent on Ukraine’s grain faced food shortages.
US-China Trade War (2018–2020): Tariffs and sanctions disrupted technology and manufacturing supply chains, particularly electronics.
Middle East conflicts: Threaten oil shipping routes, especially through chokepoints like the Suez Canal and Strait of Hormuz.
C. Economic Factors
Inflation & Currency Fluctuations: Rising costs of raw materials, fuel, and labor make global shipping expensive.
Labor Strikes: Dock workers, truckers, or airline staff strikes can paralyze logistics.
Global Recession Risks: Lower demand impacts supply chain planning and inventory cycles.
D. Logistical Bottlenecks
Port Congestion: During COVID, ports like Los Angeles and Shanghai saw ships waiting weeks to unload containers.
Shipping Container Shortages: Containers were stuck in the wrong places due to demand imbalances.
Ever Given Incident (2021): A single container ship blocking the Suez Canal for 6 days disrupted global trade worth billions.
E. Technological & Cyber Risks
Cyberattacks: Ransomware on logistics companies or ports can freeze operations. Example: The 2017 NotPetya attack crippled Maersk’s shipping systems.
Digital Dependency: Overreliance on automated systems means even small software glitches can cause major delays.
F. Human-Related Issues
Labor Shortages: Truck drivers in Europe and the U.S. remain in short supply, delaying goods movement.
Policy Changes: Sudden government restrictions, environmental regulations, or export bans (like India’s ban on rice exports in 2023) can shake global markets.
3. Impacts of Global Supply Chain Disruptions
Supply chain disruptions ripple across industries, economies, and societies.
A. Economic Impacts
Inflation: Shortages push prices up. Example: Chip shortages raised car prices worldwide.
GDP Slowdowns: Countries dependent on exports face reduced growth.
Business Losses: Companies lose revenue when they can’t deliver products on time.
B. Industry-Specific Impacts
Automobiles: Car production lines halted due to semiconductor shortages.
Electronics: Smartphone and laptop makers struggled to meet pandemic-driven demand.
Healthcare: Shortages of PPE, medicines, and vaccines during COVID.
Food Industry: Rising costs of grains, fertilizers, and shipping raised food prices globally.
C. Social Impacts
Job Losses: Factory shutdowns affect millions of workers.
Consumer Stress: Empty shelves and higher prices cause frustration.
Inequality: Developing countries face harsher consequences, especially with food and medicine shortages.
D. Strategic Impacts
Shift in Global Trade Alliances: Countries reduce dependency on adversarial nations.
Rise of Protectionism: More countries adopt “self-sufficiency” policies.
Rethinking Efficiency vs. Resilience: Businesses now focus on balancing cost-cutting with security.
4. Real-World Case Studies
Case 1: The Semiconductor Shortage (2020–2023)
Triggered by COVID lockdowns and surging demand for electronics.
Car makers like Ford and Toyota halted production.
Waiting times for laptops, gaming consoles, and phones increased.
Case 2: Suez Canal Blockage (2021)
The Ever Given, a giant container ship, blocked the canal.
12% of global trade was stuck for nearly a week.
Cost global trade $9 billion per day in delays.
Case 3: Russia-Ukraine War (2022)
Ukraine, known as the “breadbasket of Europe,” saw grain exports collapse.
Energy markets destabilized as Europe scrambled for alternatives to Russian gas.
Shipping in the Black Sea faced risks, raising insurance and freight costs.
5. How Companies and Governments are Responding
A. Diversification of Supply Chains
Moving production from China to Vietnam, India, Mexico, and Eastern Europe.
“China + 1” strategy gaining momentum.
B. Reshoring and Nearshoring
Bringing production closer to home to reduce dependency.
Example: U.S. investing in domestic semiconductor manufacturing (CHIPS Act 2022).
C. Technology and Digitalization
AI and big data for better demand forecasting.
Blockchain for transparent tracking of shipments.
Automation in warehouses and ports to reduce labor dependency.
D. Strategic Stockpiling
Governments and companies building reserves of essential goods.
Example: Many countries stockpiling rare earth minerals and semiconductors.
E. Sustainability & Green Supply Chains
Shift toward renewable energy in logistics.
Electric trucks, biofuels, and carbon-neutral shipping.
Recycling and circular supply chains to reduce waste.
Conclusion
Global supply chain disruptions have shown the fragility of a hyperconnected world. While globalization brought efficiency and low costs, it also introduced systemic risks. Pandemics, wars, natural disasters, and political decisions can now paralyze industries thousands of miles away.
The lesson for businesses and governments is clear: resilience is as important as efficiency. The future of supply chains will depend on diversification, digitalization, and sustainability. Those who adapt quickly will thrive, while those who remain over-reliant on fragile links may face constant disruptions.
In essence, global supply chain disruptions are not just logistical problems—they are economic, political, and social challenges that shape the future of globalization itself.

Arbitrage Opportunities Across World Exchanges1. Historical Background of Arbitrage
The roots of arbitrage stretch back centuries. Merchants in ancient times often exploited price discrepancies between different regions. For example:
Medieval trade routes: A trader could buy spices in India at low cost and sell them in Venice for a much higher price. This was a form of geographical arbitrage.
Gold Standard Era (19th century): Traders moved gold between cities like London and New York when exchange rate differences emerged.
Early stock markets: With the rise of exchanges in Amsterdam (1600s), London (1700s), and New York (1800s), traders began noticing price gaps between dual-listed stocks.
These historical examples were limited by communication and transport delays. But with the telegraph, telephone, and later the internet, arbitrage evolved into a high-speed, technology-driven strategy.
2. Understanding Arbitrage in Modern Exchanges
Today, arbitrage opportunities arise because no two markets are perfectly efficient. Prices may differ due to:
Time zone gaps – Tokyo, London, and New York operate in different hours.
Liquidity differences – A stock may have deeper trading in one exchange than another.
Regulatory restrictions – Taxes, transaction costs, or capital controls create distortions.
Information asymmetry – News may reach one market before another.
Currency fluctuations – Cross-border trades involve foreign exchange risks and opportunities.
In principle, arbitrage is about buying an asset cheaper in one place and selling it more expensively elsewhere—instantly or within a very short timeframe.
3. Types of Arbitrage Across World Exchanges
A. Spatial Arbitrage (Geographic Arbitrage)
This is the most classic form, where the same asset trades at different prices in two locations.
Example: A company’s shares are listed both in Hong Kong and New York. If the stock trades at $100 in New York and the equivalent of $102 in Hong Kong, traders can buy in New York and sell in Hong Kong.
B. Cross-Currency Arbitrage
Involves exploiting discrepancies in exchange rates.
Example: If EUR/USD, USD/JPY, and EUR/JPY are not aligned, a trader can loop through these conversions to lock in profit.
C. Triangular Arbitrage
More specific to forex markets. Traders exploit inconsistencies between three currency pairs simultaneously.
D. Statistical Arbitrage
Uses algorithms and quantitative models to detect pricing anomalies across exchanges.
Example: Pairs trading where two correlated stocks diverge temporarily in price.
E. Commodity Arbitrage
Prices of commodities like gold, oil, or wheat may vary across exchanges such as NYMEX (New York) and MCX (India). Arbitrageurs buy low in one and sell high in another.
F. Futures-Spot Arbitrage
Exploiting price differences between futures contracts in Chicago (CME) and the spot market in Shanghai or London.
G. Regulatory Arbitrage
Here, differences in rules create opportunities. For example, one exchange may allow certain derivatives trading while another bans it, creating parallel markets.
4. Role of Technology in Arbitrage
Modern arbitrage would be impossible without technology.
High-Frequency Trading (HFT): Ultra-fast algorithms execute trades in microseconds to capture fleeting arbitrage gaps.
Co-location services: Exchanges allow traders to place servers next to their data centers, reducing latency.
Blockchain & Crypto Arbitrage: With decentralized exchanges and global crypto markets, arbitrage between platforms like Binance, Coinbase, and Korean exchanges has become popular.
AI & Machine Learning: Algorithms analyze huge volumes of data to identify patterns humans may miss.
Technology doesn’t just create opportunities—it also reduces them quickly because once an arbitrage is spotted, it disappears as traders exploit it.
5. Real-World Examples of Global Arbitrage
A. Dual-Listed Stocks
Companies like Alibaba (listed in both NYSE and Hong Kong) or Royal Dutch Shell (listed in London and Amsterdam) often show slight price variations across exchanges. Professional arbitrageurs track these.
B. Gold Market
Gold trades in London (LBMA), New York (COMEX), and Shanghai. Price differences sometimes arise due to local demand, currency issues, or government policies. Arbitrageurs move gold or use paper contracts to profit.
C. Oil Market
The Brent crude benchmark (London) and WTI crude (New York) often trade at different spreads. Traders arbitrage these spreads with futures and physical oil trades.
D. Crypto Arbitrage
Bitcoin prices often differ across countries. For example, in South Korea (the "Kimchi Premium"), Bitcoin has historically traded 5–15% higher than in the U.S. due to capital restrictions.
E. Index Futures
Nifty (India), Nikkei (Japan), and S&P 500 (U.S.) futures trade almost 24/7. Arbitrageurs exploit price differences between futures traded in Singapore, Chicago, and domestic exchanges.
6. Challenges in Arbitrage
While arbitrage sounds like free money, in practice it faces many obstacles:
Transaction Costs: Commissions, spreads, and clearing fees can wipe out profits.
Currency Risks: Exchange rate movements can reverse arbitrage gains.
Capital Controls: Many countries restrict cross-border money flow.
Latency: Delays of even milliseconds can cause missed opportunities.
Liquidity Risks: Prices may differ, but executing large trades may not be possible.
Regulatory Risks: Authorities may restrict arbitrage trading to protect domestic markets.
Market Volatility: Sudden price swings can turn an arbitrage into a loss.
Arbitrage and Global Market Integration
Arbitrage plays a vital role in making global markets more efficient. By exploiting discrepancies, arbitrageurs push prices back into alignment. For example:
If gold trades at $1,800 in London and $1,820 in New York, arbitrage will push both toward equilibrium.
In FX, triangular arbitrage ensures that currency pairs remain mathematically consistent.
Thus, arbitrage acts as a self-correcting mechanism in global finance, reducing inefficiencies.
The Future of Global Arbitrage
Looking ahead, arbitrage opportunities will evolve:
Artificial Intelligence: Smarter algorithms will find hidden inefficiencies.
24/7 Markets: With crypto leading the way, global markets may never sleep, creating new overlaps.
CBDCs (Central Bank Digital Currencies): Will reduce settlement risks but may also create new arbitrage across jurisdictions.
Environmental & Carbon Markets: Carbon credits may become arbitrageable commodities across countries.
Geopolitical Shifts: Sanctions, wars, or policy changes can create huge temporary arbitrage gaps.
Conclusion
Arbitrage across world exchanges represents one of the most intriguing aspects of global finance. It thrives on inefficiencies, time zone differences, currency movements, and regulatory mismatches. Far from being just a trick for quick profits, arbitrage serves a deeper function: it connects and integrates global markets, ensuring that prices reflect a unified reality rather than fragmented local conditions.
From the spice traders of the Silk Road to today’s AI-driven high-frequency traders, the pursuit of risk-free profit has remained constant. What has changed is the scale, speed, and sophistication of arbitrage across world exchanges. In the future, as technology reshapes markets and globalization deepens, arbitrage will continue to be both a challenge and an opportunity for traders, institutions, and regulators worldwide.
Nifty Analysis EOD – September 15, 2025 – Monday🟢 Nifty Analysis EOD – September 15, 2025 – Monday 🔴
Tight Consolidation Before Weekly Expiry – Key Levels to Watch
🗞 Nifty Summary
Nifty opened with a 30-point gap-up, but the first-minute sell-off dragged the index 44 points down from the high. The Inside Bar (IB) formed at 25,080, and shortly after, the IB Low was breached, though it turned out to be a false breakdown.
The recovery from the low was modest at 54 points, showing gradual and less convinced buying. The 25,115 level acted as a strong hurdle, with multiple failed attempts to cross it. The day ended at the bottom of the session at 25,069.70.
Overall, today’s session remained well inside the previous day’s range, forming an Inside Bar pattern on the daily timeframe.
👉 The total range today was 90 points, but the majority of price action stayed within a narrow 45-point range (25,115 ~ 25,070), indicating a phase of tight consolidation.
With weekly expiry tomorrow, prepare for moves in both directions:
If PDH breaks and sustains above → target 25,240.
If PDL breaks → target 24,975 and 24,910.
🛡 5 Min Intraday Chart with Levels
📉 Daily Time Frame Chart with Intraday Levels
🕯 Daily Candle Breakdown
Open: 25,118.90
High: 25,138.45
Low: 25,048.75
Close: 25,069.20
Change: −44.80 (−0.18%)
🏗️ Structure Breakdown
Red candle (Close < Open)
Body: ~49.70 points (small)
Upper wick: ~19.55 points
Lower wick: ~20.45 points
Balanced structure, but the red body reflects sellers had a slight upper hand.
📚 Interpretation
Market opened strong but couldn’t sustain above 25,130, triggering selling pressure.
Buyers defended the 25,050 level once again, but the close below open shows mild weakness.
Both upper and lower wicks indicate a tug-of-war between bulls and bears, with sellers slightly dominating.
🕯Candle Type
Small bearish candle / Spinning Top leaning bearish → signals hesitation after a few days of upward drift.
📉📈 Short-Term View – September 16, 2025
Support: 25,040–25,050 (key floor).
Resistance: 25,130–25,140 (remains unbroken).
👉 Key Insight:
Market has been boxed between 25,040–25,140 for 2 sessions.
Sellers are defending the top, and buyers are holding the base → energy is building up for a decisive breakout.
A clean breakout in either direction will set the next phase.
🛡 5 Min Intraday Chart
⚔️ Gladiator Strategy Update
ATR: 169.85
IB Range: 57.15 → Medium
Market Structure: Balanced
Trade Highlights:
11:45 AM – Long Trigger → SL Hit
📌 Support & Resistance Levels
Resistance Zones:
25,115
25,140 ~ 25,160
25,240
Support Zones:
25,085
25,035
25,000 ~ 24,975
24,940
💡 Final Thoughts
Today’s indecisive and narrow consolidation hints at energy accumulation for the next big move. Keep an eye on PDH and PDL breakouts tomorrow (weekly expiry) for a clear directional bias.
📖 “Consolidation is the market’s way of gathering strength before the next directional burst.”
✏️ Disclaimer
This is just my personal viewpoint. Always consult your financial advisor before taking any action.

Nifty 50 Trendline This chart shows Nifty 50 price action with a clearly drawn ascending trendline acting as dynamic support. Let me elaborate step by step:
1. Trendline Support
The black diagonal line marks higher lows in the market.
Each time price dips, it respects this trendline and bounces upward.
This indicates buyers are stepping in at progressively higher levels.
2. Current Market Zone
Price is around 25,111.
Immediate resistance is visible near 25,185–25,190, the recent swing high.
As long as Nifty holds above this rising trendline (around 25,050–25,070 zone), momentum remains bullish.
3. Scenarios to Watch
Bullish case: If Nifty stays above the trendline and breaks 25,190, it can target 25,250–25,300 levels.
Bearish case: A breakdown below the trendline (close below 25,050) may trigger profit booking, pulling price towards 24,950–24,900.
4. Trading Implication
Trendline is working as a psychological demand zone.
Market participants should watch for either a bounce continuation or a trendline breakdown for direction.
👉 In short:
Nifty is consolidating but still respecting trendline support. Bulls remain in control until that line is broken or fake out !!

Nifty September 3rd Week AnalysisNifty is looking neutral. Nifty is positioned above 25000, giving hope for further upside momentum, but momentum will grip further after Nifty crosses and sustains above 25250-25300. And momentum can further continue until the next resistance of 25460-520.
On the downside, if Nifty breaches the support range of 25050-24930, then we can expect a downside of up to 24650.

Nifty Analysis EOD – September 11, 2025 – ThursdayDelayed Note : Missed to Post on TV
🟢 Nifty Analysis EOD – September 11, 2025 – Thursday 🔴
Consolidation Continues – Bulls Holding Ground Near 25K
🗞 Nifty Summary
Nifty started flat and within minutes marked a low of 24,940 and high of 25,008. Most of the day was spent within this narrow IB Zone, with multiple fakeouts of IB High that made life tough for intraday traders.
After 2:30 PM, candles spiked 2–3x average range, signaling bulls trying to breach the previous day’s high and hold above 25K, while bears dragged it back from the upper zone. Such tug-of-war periods made it tricky, and traders likely faced tough moments.
However, by the end of the day, Nifty managed to close above 25,000 at 25,008.10.
This session was largely a consolidation day, similar to yesterday, with the entire movement contained within the previous day’s range, forming an Inside Bar structure.
Yesterday’s range: 120.65 points
Today’s range: 97.15 points
Gladiator Indicator shows average range: 183.74 → indicates upcoming potential expansion.
Hold tight, seat tight.
🛡 5 Min Intraday Chart with Levels
📉 Daily Time Frame Chart with Intraday Levels
🕯 Daily Candle Breakdown
Open: 24,945.50
High: 25,037.30
Low: 24,940.15
Close: 25,005.50
Change: +32.40 (+0.13%)
🏗️ Structure Breakdown
Green candle (Close > Open).
Body: 60.00 points → moderate.
Upper wick: 31.80 points.
Lower wick: 5.35 points → almost no tail.
Market closed near day’s high, showing bullish bias.
📚 Interpretation
Market remained in a narrow range (approx. 97 points).
Buyers controlled the session — open near low, close near high.
Very small lower wick → minimal selling pressure.
Upper wick reflects resistance near 25,037.
🕯Candle Type
Small Bullish Candle / Near Marubozu type → suggests steady but controlled buying.
📉📈 Short-Term View – September 11, 2025
Support: 24,940–24,945 (today’s defended zone).
Resistance: 25,030–25,040 (where price paused again).
👉 Key Insight:
Bulls are gradually pressing higher, yet stuck below 25,030–25,050 resistance band.
Context over the last two days:
Market is consolidating tightly between 24,900–25,035.
Every session reflects indecision but with a bullish undertone → buyers holding ground, sellers blocking at the top.
A clear breakout is brewing.
🛡 5 Min Intraday Chart
⚔️ Gladiator Strategy Update
ATR: 183.74
IB Range: 68.8 → Medium
Market Structure: Balanced
Trade Highlights:
12:10 AM – Long Trigger → Target Hit (R:R 1:1.5)
13:45 PM – Long Trigger → SL Hit
📌 Support & Resistance Levels
Resistance Zones:
24,975 ~ 25,004
25,035 ~ 25,140
25,160
Support Zones:
24,915 ~ 24,895
24,845 ~ 24,835
24,785
💡 Final Thoughts
Today’s session adds to the consolidation narrative, with bulls defending near 25,000 and gradual attempt to break higher resistance. A breakout above 25,040 could finally trigger fresh momentum. Until then, expect choppy action with tight ranges.
📖 “Strength grows in moments of resistance – patience pays in the end.”
✏️ Disclaimer
This is just my personal viewpoint. Always consult your financial advisor before taking any action.

Nifty Analysis EOD – September 12, 2025 – Friday 🟢 Nifty Analysis EOD – September 12, 2025 – Friday 🔴
Momentum Building – Eyes Set on 25,240 Next
🗞 Nifty Summary
Nifty began the session with a strong 80-point gap-up, right at our first target level. A sudden retracement of 50 points found support at the previous two days' high (25,038), which became the day’s low.
From there, the index climbed gradually yet confidently toward the resistance zone of 25,085 ~ 25,095, where it paused briefly. After the breakout, a sharp move pushed the index to our second target of 25,140, marking the day’s high at 25,139.45 — just 16 points shy of the Inside Bar Pattern target.
Following this intraday expansion, the index cooled off and retraced toward the 25,085 ~ 25,095 zone, settling into a small consolidation range between 25,100 ~ 25,125. The day ended at 25,104.55 on a very positive note.
Overall, today’s session fulfilled our expectations.
👉 Tomorrow, a sustained breakout above 25,140 ~ 25,160 may open the door toward the powerful supply and resistance zone of 25,240.
🛡 5 Min Intraday Chart with Levels
📉 Daily Time Frame Chart with Intraday Levels
🕯 Daily Candle Breakdown
Open: 25,074.45
High: 25,139.45
Low: 25,038.05
Close: 25,114.00
Change: +108.50 (+0.43%)
🏗️ Structure Breakdown
Green candle (Close > Open).
Body: ~39.55 points → moderate.
Upper wick: ~25.45 points.
Lower wick: ~36.40 points.
Balanced intraday action with attempts from both bulls and bears, but closed firmly higher.
📚 Interpretation
Buyers defended 25,038–25,040 support zone consistently.
Price moved above 25,100, though sellers capped near 25,140.
The candle reflects controlled bullishness with gradual accumulation, not a runaway rally.
🕯Candle Type
Balanced bullish candle / small-bodied bullish bar → shows steady buying interest.
📉📈 Short-Term View – September 12, 2025
Support: 25,040 (defended strongly for the 4th session).
Resistance: 25,140 (fresh rejection zone).
👉 Key Insight:
The market is forming a tight upward channel with bulls gradually pushing, but sellers remain active near resistance.
Sustaining above 25,140 will be crucial to target 25,240.
📊 Context over last 3 sessions (September 4–8):
Market is holding 24,940–25,040 as a strong floor.
Each session shows a higher close → steady buying pressure accumulating.
🛡 5 Min Intraday Chart
⚔️ Gladiator Strategy Update
ATR: 178.76
IB Range: 51.7 → Medium
Market Structure: ImBalanced
Trade Highlights:
10:00 AM – Long Trigger → Target Hit (R:R - 1:2.5)
📌 Support & Resistance Levels
Resistance Zones:
25,140 ~ 25,160
25,240
Support Zones:
25,085
25,035
25,000 ~ 24,975
24,940
💡 Final Thoughts
Today’s action reflects a healthy consolidation phase with bullish undertones. Bulls are preparing for a potential breakout, while sellers defend the upper band. The next session’s ability to sustain above 25,140–25,160 will be a clear momentum trigger.
📖 “Patience in accumulation today builds strength for tomorrow’s breakout.”
✏️ Disclaimer
This is just my personal viewpoint. Always consult your financial advisor before taking any action.

Trading Instruments in global market 1. Equities (Stocks)
Definition
Equities, also called stocks or shares, represent ownership in a company. By buying a share, an investor becomes a partial owner of that company and is entitled to a portion of profits (dividends) and potential capital appreciation.
Key Characteristics
Ownership: A share means holding equity in a company.
Voting rights: Common stockholders can vote in company decisions.
Returns: Gains come from dividends and share price appreciation.
Liquidity: Highly liquid, especially in large stock exchanges like NYSE, NASDAQ, NSE, and LSE.
Types of Equities
Common Stock – Offers voting rights and dividends.
Preferred Stock – Fixed dividends but limited/no voting rights.
Blue-Chip Stocks – Shares of large, stable companies.
Growth Stocks – Companies with high potential for expansion.
Penny Stocks – Low-priced, high-risk speculative shares.
Global Relevance
Equities are among the most popular instruments globally because they allow both short-term trading and long-term wealth creation. For example:
The US stock market is worth over $50 trillion.
Emerging markets like India, Brazil, and China are attracting growing investor interest due to rapid economic growth.
2. Fixed-Income Securities (Bonds)
Definition
A bond is essentially a loan made by an investor to a borrower (government, corporation, or institution). The borrower promises to pay interest (coupon) and return the principal on maturity.
Key Characteristics
Low risk (relative to stocks), especially in government bonds.
Predictable returns in the form of interest.
Variety of maturities (short, medium, and long-term).
Types of Bonds
Government Bonds (Treasuries, Gilts, Sovereign Bonds) – Issued by national governments.
Corporate Bonds – Issued by companies to raise capital.
Municipal Bonds – Issued by cities or states.
High-Yield (Junk) Bonds – Riskier but offer higher returns.
Inflation-Indexed Bonds – Adjust payouts with inflation rates.
Global Relevance
The US Treasury market is the largest bond market in the world and a global benchmark for interest rates.
Countries issue bonds to finance deficits, making them a cornerstone of international trade and finance.
3. Currencies (Foreign Exchange or Forex)
Definition
Currencies are the most liquid instruments globally, traded in the foreign exchange (forex) market, which has a daily turnover of over $7.5 trillion (2025 est.).
Key Characteristics
24-hour trading (Monday–Friday).
High leverage availability for traders.
Paired trading (e.g., USD/INR, EUR/USD, GBP/JPY).
Heavily influenced by macroeconomic policies, central banks, and geopolitics.
Major Currency Pairs
Major Pairs: EUR/USD, GBP/USD, USD/JPY, USD/CHF.
Minor Pairs: EUR/GBP, AUD/JPY.
Exotic Pairs: USD/INR, USD/TRY.
Uses
Businesses hedge against currency fluctuations.
Central banks maintain stability.
Traders speculate on price movements.
4. Commodities
Definition
Commodities are physical goods that are traded on exchanges, often used as raw materials in production.
Types of Commodities
Metals – Gold, Silver, Copper, Platinum.
Energy – Crude Oil, Natural Gas, Coal.
Agricultural Products – Wheat, Coffee, Cotton, Soybeans.
Livestock – Cattle, Hogs.
Key Characteristics
Hedging tool against inflation (gold, oil).
Geopolitical sensitivity (oil prices surge in wars/conflicts).
Global trade-driven demand and supply.
Global Relevance
Oil is the most traded commodity, central to global energy.
Gold acts as a safe-haven asset during economic uncertainty.
Agricultural commodities impact food security and global trade.
5. Derivatives
Definition
Derivatives are contracts whose value is derived from an underlying asset (stocks, bonds, currencies, or commodities).
Types of Derivatives
Futures – Agreements to buy/sell at a future date at a set price.
Options – Rights (not obligations) to buy/sell at a specific price.
Swaps – Contracts to exchange cash flows (e.g., interest rate swaps).
Forwards – Customized contracts between two parties.
Key Characteristics
Used for hedging risk (e.g., airlines hedge fuel prices).
Allow speculation on future price movements.
Offer leverage, amplifying gains/losses.
Global Relevance
The derivatives market is massive—worth quadrillions in notional value.
Exchanges like CME, ICE, and NSE are major global hubs.
6. Exchange-Traded Funds (ETFs) & Mutual Funds
ETFs
Traded like stocks on exchanges.
Track indexes, sectors, or commodities (e.g., SPDR S&P 500 ETF).
Offer diversification at low cost.
Mutual Funds
Actively managed investment vehicles.
Pool money from investors to buy diversified securities.
Suitable for long-term investors.
Global Relevance
ETFs have become highly popular among retail investors.
India and Asia are seeing a surge in passive investing via ETFs.
7. Real Estate Investment Trusts (REITs)
Definition
REITs are companies that own, operate, or finance income-generating real estate (offices, malls, warehouses).
Benefits
Provide exposure to real estate without direct ownership.
Offer dividends from rental income.
Highly liquid compared to physical property.
Global Relevance
REITs are major in the US, Singapore, and Australia, while India has introduced them in recent years for commercial real estate.
8. Hedge Funds & Private Equity Instruments
Hedge Funds
Pool money from wealthy investors to take aggressive positions.
Use derivatives, leverage, and short-selling.
Private Equity (PE)
Invests directly in private companies or buyouts.
Long-term, illiquid, but high potential returns.
Global Relevance
Hedge funds influence markets with speculative bets.
PE drives business growth, restructuring, and IPOs.
9. Cryptocurrencies & Digital Assets
Definition
Cryptocurrencies are decentralized digital currencies using blockchain technology.
Examples
Bitcoin (BTC) – The most popular crypto.
Ethereum (ETH) – Smart contracts and decentralized apps.
Stablecoins (USDT, USDC) – Pegged to fiat currencies.
Central Bank Digital Currencies (CBDCs) – Being developed by governments.
Characteristics
Volatile and speculative.
24/7 global trading.
Used for payments, remittances, and decentralized finance (DeFi).
Global Relevance
Cryptos are gaining institutional acceptance.
Some countries (El Salvador) have adopted Bitcoin as legal tender.
CBDCs could reshape global payment systems.
10. Alternative Trading Instruments
Carbon Credits – Traded to offset emissions.
Weather Derivatives – Used by agriculture/energy companies to hedge risks.
Art & Collectibles – NFTs and physical art as investment assets.
VIX Futures – Trading volatility index as a fear gauge.
Conclusion
The global market is a vast ocean of trading instruments, each serving a distinct purpose. From the stability of bonds to the high-risk-high-reward world of derivatives and cryptocurrencies, these instruments cater to every kind of investor—risk-averse savers, speculative traders, hedging corporates, and long-term wealth builders.
Understanding these instruments is crucial because the modern financial world is deeply interconnected. A shift in interest rates affects bonds, currencies, equities, and commodities simultaneously. Similarly, geopolitical events ripple across forex, oil, and stock markets.
For traders and investors, the key lies in:
Selecting the right mix of instruments.
Managing risks using diversification and hedging.
Staying updated on global economic and geopolitical trends.
In essence, trading instruments are not just tools of profit—they are the lifeblood of the global financial system. Mastering them is mastering the art of navigating global markets.

Nifty Analysis EOD – September 10, 2025 – Wednesday🟢 Nifty Analysis EOD – September 10, 2025 – Wednesday 🔴
📌 Doji at Resistance – Market in Consolidation Grip
🗞 Nifty Summary
Nifty opened with a 114-point gap-up, well above the previous day’s high and right in the middle of the strong resistance zone of 24,975 ~ 25,004. Initially, the index attempted to stabilize and hold above 25,000, but couldn’t sustain the level. It gradually lost ground, broke the VWAP and day’s low, marking a low of 24,915.
A recovery of 75 points from the low brought Nifty back to 24,977.5 at close, resulting in a Doji candle formed near the middle of the resistance zone.
Such large gap-ups or gap-downs are not favorable for intraday players, and positional BTST option buyers were left vulnerable, as the first-minute slip wiped out initial gains.
🛡 5 Min Intraday Chart with Levels
📉 Daily Time Frame Chart with Intraday Levels
🕯 Daily Candle Breakdown
Open: 24,991.00
High: 25,035.70
Low: 24,915.05
Close: 24,973.10
Change: +104.50 (+0.42%)
🏗️ Structure Breakdown
Red candle (Close < Open).
Body: 17.90 points → small.
Upper wick: 44.70 points.
Lower wick: 58.05 points.
This forms a Spinning Top-type candle with long shadows on both sides → indicative of intraday tug-of-war.
📚 Interpretation
Market opened near 25,000, briefly touched 25,035, but sellers rejected higher levels.
Buyers defended 24,915, as seen from the long lower wick.
Closing slightly below open signals mild bearish pressure despite overall gains compared to the previous close.
This is a classic indecision candle, with bulls managing to hold ground but failing to assert dominance.
🕯Candle Type
Spinning Top / Indecision Candle with balanced pressure leaning slightly bearish (due to red close).
📉📈 Short-Term View – September 11, 2025
Support: 24,910 – 24,915 (defended today).
Resistance: 25,030 – 25,050 (strong supply zone with multiple rejections).
👉 Key Insight:
Bulls are trying to protect 24,900 but facing strong resistance near 25,030–25,050.
Market is consolidating and coiling tighter between 24,900–25,050.
A breakout above 25,050 may trigger fresh momentum towards 25,160, while a dip below 24,900 opens risk toward 24,750.
🛡 5 Min Intraday Chart
⚔️ Gladiator Strategy Update
ATR: 193.36
IB Range: 59.3 → Small
Market Structure: Balanced
Trade Highlights:
10:30 AM – Long Trigger → SL Hit
13:20 PM – Short Trigger → SL Hit
📌 Support & Resistance Levels
Resistance Zones:
24,975 ~ 25,004
25,035 ~ 25,140
25,160
Support Zones:
24,915 ~ 24,895
24,845 ~ 24,835
24,785
💡 Final Thoughts
Today’s indecisive spinning top reflects a market stuck in consolidation, caught between supply and demand. Until a decisive breakout occurs, avoid large positional bets and remain focused on intraday tactical trades.
📖 “Patience in consolidation builds the strongest trends later.”
✏️ Disclaimer
This is just my personal viewpoint. Always consult your financial advisor before taking any action.

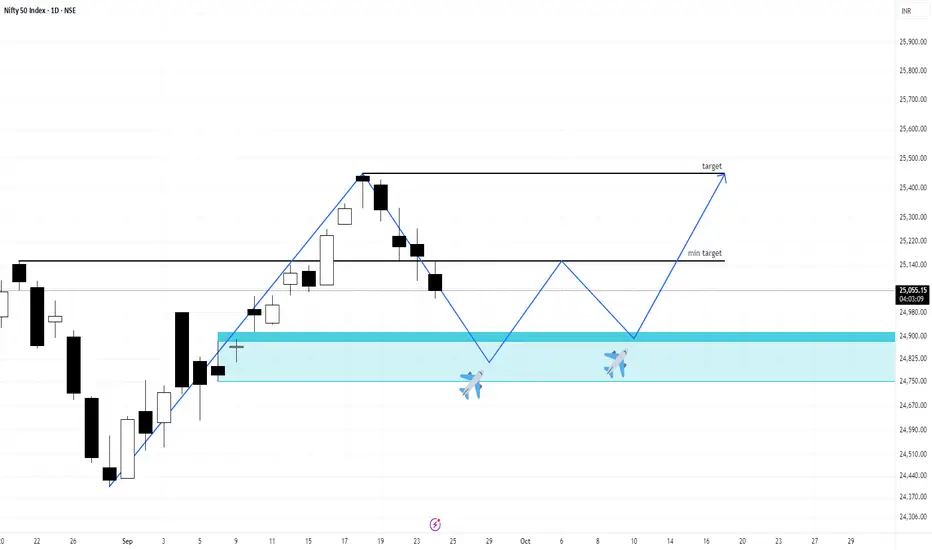
Nifty 50: Struggling to close above 25k Mark
Nifty 50: Struggling to close above 25k Mark
Almost sitting at the Buy Signal .
( Not a Buy / Sell Recommendation
Do your own due diligence ,Market is subject to risks, This is my own view and for learning only .)

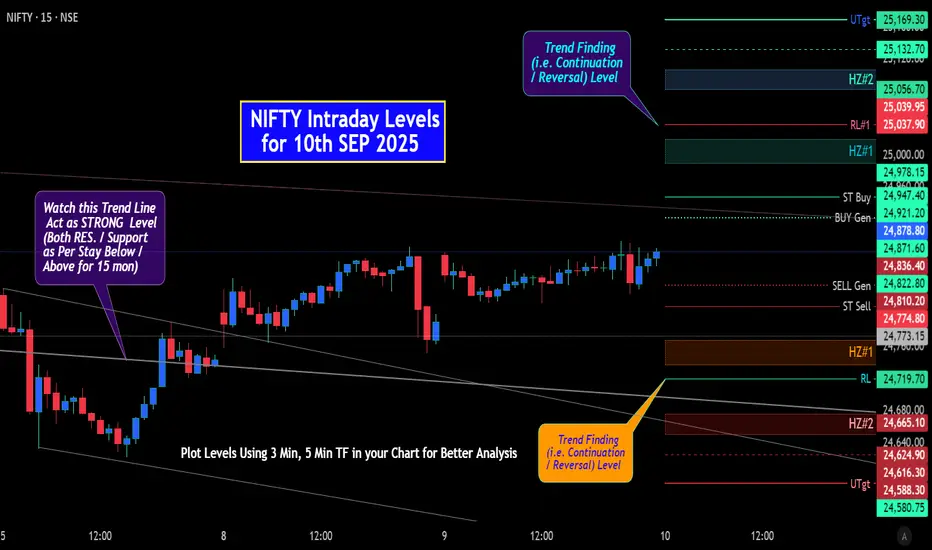
NIFTY: Intraday Levels for 08th SEP 2025 (NIFTY50 Spot)NIFTY: Intraday Levels for 08th SEP 2025 (NIFTY50 Spot)
Possibility to form Evening Star. But due to Geo-Political Events If OPEN with GAP up "ST Buy" act as Resistance followed by HZ#1
^^^^^^^ Plot Levels Using 3 Min, 5 Min Time frame in your Chart for Better Analysis ^^^^^^^
L#1: If the candle crossed & stays above the “Buy Gen”, it is treated / considered as Bullish bias.
L#2: If the candle stays above “Sell Gen” but below “Buy Gen”, it is treated / considered as Sidewise. Aggressive Traders can take Long position near “Sell Gen” either retesting or crossed from Below & vice-versa i.e. can take Short position near “Buy Gen” either retesting or crossed downward from Above.
L#3: If the candle crossed & stays below the “Sell Gen”, it is treated / considered a Bearish bias.
L#4: Possibility / Probability of REVERSAL near RL#1 & UTgt
HZ => Hurdle Zone, Specialty of “HZ#1 & HZ#2” is Sidewise (behaviour in Nature)
Rest Plotted and Mentioned on Chart
Color code Used:
Green =. Positive bias.
Red =. Negative bias.
RED in Between Green means Trend Finder / Momentum Change
/ CYCLE Change and Vice Versa.
Notice One thing: HOW LEVELS are Working.
Use any Momentum Indicator / Oscillator or as you "USED to" to Take entry.
📢 Disclaimer
I am not a SEBI-registered financial adviser.
The information, views, and ideas shared here are purely for educational and informational purposes only. They are not intended as investment advice or a recommendation to buy, sell, or hold any financial instruments.
Please consult with your financial advisor before making any trading or investment decisions
Trading and investing in the stock market involves risk, and you should do your own research and analysis. You are solely responsible for any decisions made based on this research.
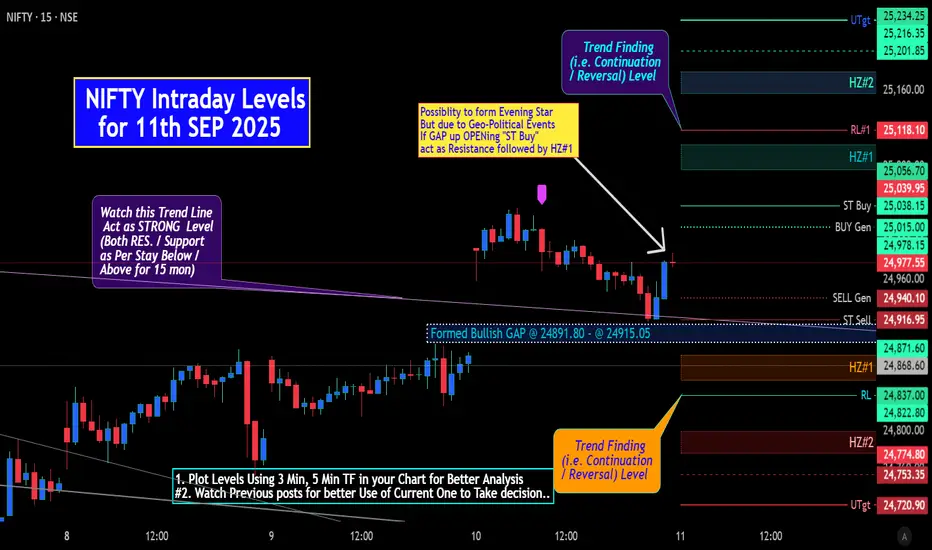
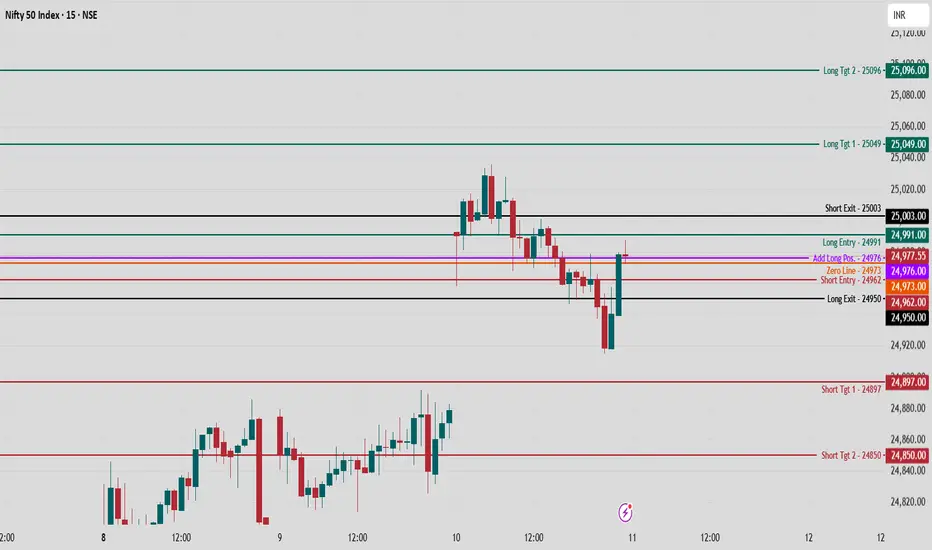
Nifty 50 Intraday Technical Chart Analysis for 11 Sept., 2025Nifty 50 Index on the 15-minute chart is showing key inflection levels with potential trade opportunities around the 24,973–24,991 zone.
Market Context and Bias
The Index has exhibited strong volatility with an initial downtrend, followed by a sharp bullish reversal candle near intraday lows.
The price is currently testing the “Zero Line” at 24,973 and hovering just below Long Entry at 24,991, suggesting this area is a key battleground between bulls and bears.
Key Levels and Trade Triggers
Long Bias: If sustained above 24,991 (Long Entry), potential targets are 25,049 (Long Tgt 1) and 25,096 (Long Tgt 2). A stop-loss can be managed below 24,962 (Long Exit).
Short Bias: Breakdown below 24,962 (Long Exit) can lead toward 24,897 (Short Tgt 1) and 24,850 (Short Tgt 2), with stops above 24,991.
Neutral/Wait for Confirmation: Zero Line at 24,973 acts as a pivot. Wait for a decisive close above/below for trend confirmation.
Trade Management and Sentiment
Conservative traders can initiate positions above 24,977–24,991 after pullback confirmation, targeting higher resistance, while aggressive short trades are suitable on break and retest below 24,962.
Price action within these triggers reflects a high-stakes zone; avoid over-leverage and maintain discipline at decision points.
Nifty at critical decision zone — watch for sustained move above 24,991 for bullish action, or breakdown below 24,962 for sellers to dominate.
Follow for more such updates!