Nifty levels - Sep 11, 2025Nifty support and resistance levels are valuable tools for making informed trading decisions, specifically when combined with the analysis of 5-minute timeframe candlesticks and VWAP. By closely monitoring these levels and observing the price movements within this timeframe, traders can enhance the accuracy of their entry and exit points. It is important to bear in mind that support and resistance levels are not fixed, and they can change over time as market conditions evolve.
The dashed lines on the chart indicate the reaction levels, serving as additional points of significance to consider. Furthermore, take note of the response at the levels of the High, Low, and Close values from the day prior.
We hope you find this information beneficial in your trading endeavors.
* If you found the idea appealing, kindly tap the Boost icon located below the chart. We encourage you to share your thoughts and comments regarding it.
Wishing you success in your trading activities!
NIFTY trade ideas

NIFTY 1D Time frame📊 NIFTY 50 Snapshot
Current Price: Approximately 24,991
Change: Up ~0.49% from the previous close
Trend: Fifth consecutive day of gains
🔎 Key Levels
Resistance: Near 25,000 — psychological level and recent high
Support: Around 24,800 — recent low and consolidation zone
📈 Technical Indicators
RSI (14): Approximately 58 — neutral to slightly bullish
MACD: Positive — indicating upward momentum
Moving Averages: Price trading above key moving averages, suggesting a bullish trend
📌 Market Sentiment
Catalysts: Optimism over potential GST cuts and revival of trade talks with the U.S.
Sector Performance: Broad-based gains across sectors, with IT and financials leading
📅 Outlook
Bullish Scenario: Sustained trading above 25,000 could lead to a push toward 25,200–25,300.
Bearish Scenario: A drop below 24,800 may test support around 24,600.

NIFTY 4Hour Time frameNifty Snapshot (10 Sept 2025 – 4-Hour Chart)
Current Level: Around 24,990 – 25,000
Intraday Change: Up about +120 to +130 points (~+0.5%)
Trend: Bullish, with price sustaining near highs
Key Pivot Levels (Daily basis, useful for 4-Hour chart)
Pivot Point: 24,858
Resistance Levels:
R1: 24,902
R2: 24,936
R3: 24,980
Support Levels:
S1: 24,824
S2: 24,780
S3: 24,747
Technical View (4-Hour Frame)
Momentum: Nifty is trading above R3 (24,980), showing strong bullish momentum.
Indicators: RSI is in bullish territory (~65–70), MACD remains positive, and moving averages favor upside.
Bias:
Sustaining above 25,000 can lead to further upside, possibly extending gains.
If Nifty slips back below 24,980, it may retest R2 (24,936) or R1 (24,902).
✅ Conclusion: On the 4-hour timeframe, Nifty remains bullish, currently holding above its resistance zone. This suggests strong intraday and short-term strength, though some consolidation is possible around the 25,000 mark.
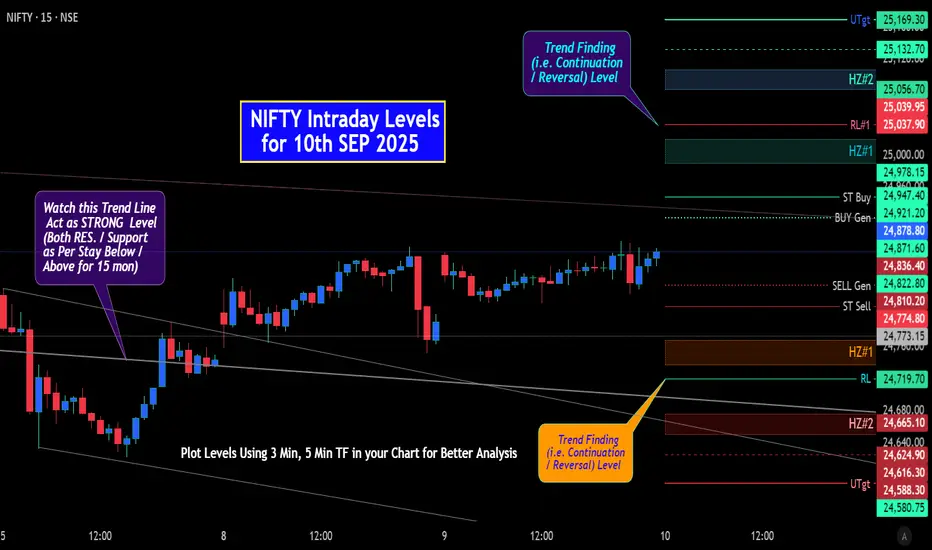
NIFTY: Intraday Levels for 08th SEP 2025 (NIFTY50 Spot)NIFTY50 SPOT: Intraday Levels for 08th SEP 2025
^^^^^^^ Plot Levels Using 3 Min, 5 Min Time frame in your Chart for Better Analysis ^^^^^^^
L#1: If the candle crossed & stays above the “Buy Gen”, it is treated / considered as Bullish bias.
L#2: If the candle stays above “Sell Gen” but below “Buy Gen”, it is treated / considered as Sidewise. Aggressive Traders can take Long position near “Sell Gen” either retesting or crossed from Below & vice-versa i.e. can take Short position near “Buy Gen” either retesting or crossed downward from Above.
L#3: If the candle crossed & stays below the “Sell Gen”, it is treated / considered a Bearish bias.
L#4: Possibility / Probability of REVERSAL near RL#1 & UTgt
HZ => Hurdle Zone, Specialty of “HZ#1 & HZ#2” is Sidewise (behaviour in Nature)
Rest Plotted and Mentioned on Chart
Color code Used:
Green =. Positive bias.
Red =. Negative bias.
RED in Between Green means Trend Finder / Momentum Change
/ CYCLE Change and Vice Versa.
Notice One thing: HOW LEVELS are Working.
Use any Momentum Indicator / Oscillator or as you "USED to" to Take entry.
📢 Disclaimer
I am not a SEBI-registered financial adviser.
The information, views, and ideas shared here are purely for educational and informational purposes only. They are not intended as investment advice or a recommendation to buy, sell, or hold any financial instruments.
Please consult with your financial advisor before making any trading or investment decisions
Trading and investing in the stock market involves risk, and you should do your own research and analysis. You are solely responsible for any decisions made based on this research.
Inflation & Interest Rate Impact on Global Markets1. Inflation: The Silent Force Driving Markets
1.1 What is Inflation?
Inflation refers to the sustained increase in the general price level of goods and services in an economy over time. It reduces the purchasing power of money and reflects imbalances between demand and supply.
Types of Inflation:
Demand-Pull Inflation: Caused by strong consumer demand exceeding supply.
Cost-Push Inflation: Triggered by higher production costs (e.g., rising wages, raw materials).
Built-In Inflation: Wage-price spirals where higher wages lead to higher prices.
Hyperinflation: Extremely rapid price increases, often due to monetary mismanagement.
1.2 Measurement of Inflation
Central banks and governments use indexes like:
Consumer Price Index (CPI)
Producer Price Index (PPI)
Personal Consumption Expenditure (PCE)
Each index provides a different angle on price changes affecting households, businesses, and producers.
1.3 The Global Relevance of Inflation
Inflation impacts nearly every financial market:
Equities: Erodes corporate profits unless firms pass costs to consumers.
Bonds: Fixed interest payments lose real value when inflation rises.
Currencies: High inflation weakens a nation’s currency.
Commodities: Often act as a hedge (gold, oil, agricultural products).
2. Interest Rates: The Monetary Lever
2.1 What are Interest Rates?
Interest rates represent the cost of borrowing money or the return on lending capital. Central banks set benchmark rates (e.g., the U.S. Federal Reserve’s Federal Funds Rate, ECB’s Main Refinancing Rate) to guide economic activity.
2.2 How Central Banks Use Interest Rates
Lowering Rates: Stimulates growth, encourages borrowing, raises asset prices.
Raising Rates: Controls inflation, curbs excessive lending, can cool overheated economies.
2.3 Real vs. Nominal Interest Rates
Nominal Rate: Stated percentage without inflation adjustment.
Real Rate: Nominal rate minus inflation. Investors care about real returns.
3. The Inflation–Interest Rate Nexus
The relationship between inflation and interest rates is central to market behavior. High inflation often prompts central banks to raise rates, while low inflation or deflation encourages rate cuts.
Phillips Curve Theory: Historically suggested an inverse relationship between inflation and unemployment, though its relevance is debated today.
Taylor Rule: A monetary policy guideline suggesting how central banks should adjust interest rates in response to inflation and output gaps.
This interaction affects everything from stock market valuations to cross-border capital flows.
4. Impact on Global Asset Classes
4.1 Equity Markets
High Inflation + Rising Rates: Compresses valuations, reduces consumer demand, and lowers corporate earnings. Growth stocks, especially in tech, often suffer.
Low Inflation + Low Rates: Favors risk assets, boosts valuations, supports speculative bubbles.
Historical Example: The 1970s stagflation period saw equities underperform due to high inflation and rising rates. In contrast, the 2010s "low-rate decade" fueled massive equity rallies.
4.2 Bond Markets
Rising inflation hurts bondholders since fixed payments lose real value. Yields rise to compensate for inflation, causing bond prices to fall.
Interest rate hikes directly impact yields, particularly on short-term government securities.
4.3 Currency Markets
Higher rates typically attract foreign capital, strengthening the domestic currency.
Inflation erodes currency value unless offset by aggressive monetary tightening.
Case Study: The U.S. dollar often strengthens during Federal Reserve hiking cycles, while emerging market currencies weaken due to capital flight.
4.4 Commodities
Commodities like gold, oil, and agricultural products are often seen as hedges against inflation.
Higher interest rates can reduce commodity demand since financing costs rise, but supply shocks may offset this.
4.5 Real Estate
Inflation raises construction costs, boosting property prices.
High interest rates increase mortgage costs, dampening housing demand.
4.6 Alternative Assets (Crypto, Private Equity, Venture Capital)
Cryptocurrencies gained popularity as “inflation hedges,” though their effectiveness is debated.
Low interest rates fuel venture capital and private equity booms, while higher rates reduce risk appetite.
5. Regional & Global Perspectives
5.1 United States
As the world’s largest economy, U.S. inflation and Fed policy significantly shape global markets. The Fed’s actions affect:
Dollar strength (USD as reserve currency)
Capital flows into emerging markets
Global bond yields and equity valuations
5.2 Eurozone
The European Central Bank balances inflation control with fragile growth. Its historically lower rates have influenced capital allocation globally.
5.3 Emerging Markets
Emerging economies are particularly sensitive to U.S. interest rate hikes:
Capital outflows occur as investors chase higher U.S. yields.
Currencies depreciate, making imports costlier and inflation worse.
Governments face debt repayment pressures on dollar-denominated bonds.
Example: Turkey, Argentina, and other EMs have repeatedly faced crises linked to inflation and external rate shocks.
5.4 Asia (China, India, Japan)
China: Inflation is less of a concern; focus is on growth management.
India: Sensitive to global oil prices and capital flows; RBI uses rate adjustments to maintain balance.
Japan: Longstanding deflationary pressures have led to ultra-low/negative rates. Rising global inflation creates challenges for the yen.
6. Historical Lessons
1970s Stagflation: High inflation and weak growth caused equity crashes and bond turmoil.
1980s Volcker Shock: U.S. Fed raised rates sharply, crushing inflation but triggering global debt crises.
2008 Financial Crisis: Ultra-low rates fueled recovery but sowed seeds for asset bubbles.
2020 Pandemic & Aftermath: Stimulus + supply chain disruptions caused inflation surges, forcing aggressive central bank tightening in 2022–23.
Investment Strategies in Inflation & Interest Rate Cycles
Inflation Hedging: Gold, commodities, inflation-linked bonds (TIPS).
Diversification: Across asset classes and geographies to manage volatility.
Sector Rotation: Moving capital into sectors resilient during high inflation (energy, financials).
Duration Management: Shorter-duration bonds during rising rate cycles.
Currency Hedging: Protecting portfolios from FX risks due to rate differentials.
Conclusion
Inflation and interest rates remain the twin pillars shaping global financial markets. Their interplay drives asset valuations, capital flows, and investor psychology. While moderate inflation and stable interest rates foster growth, extremes in either direction often destabilize economies and markets.
For policymakers, the challenge lies in navigating between controlling inflation and supporting growth. For investors, success depends on adapting strategies to different inflation and interest rate environments.
The coming decades may witness structural shifts—climate change, geopolitical realignments, and technological revolutions—that redefine inflationary pressures and interest rate dynamics. Yet, the central truth remains: understanding inflation and interest rates is essential to navigating the ever-evolving global markets.
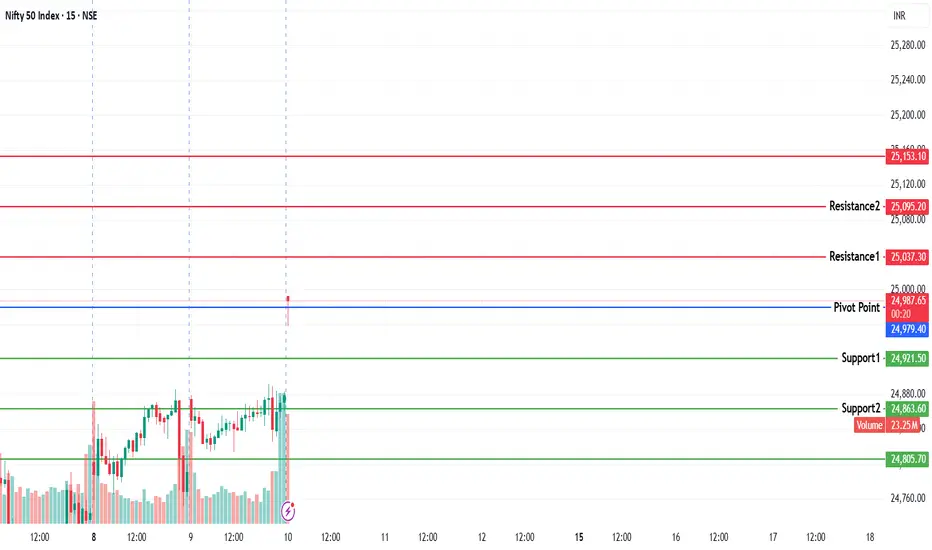
NIFTY KEY LEVELS FOR 10.09.2025NIFTY KEY LEVELS FOR 10.09.2025
RTF: 3 Minutes
If the candle stays above the pivot point, it is considered a bullish bias; if it remains below, it indicates a bearish bias. Price may reverse near Resistance 1 or Support 1. If it moves further, the next potential reversal zone is near Resistance 2 or Support 2. If these levels are also broken, we can expect the trend.
If the range(R2-S2) is narrow, the market may become volatile or trend strongly. If the range is wide, the market is more likely to remain sideways
📢 Disclaimer
I am not a SEBI-registered financial adviser.
The information, views, and ideas shared here are purely for educational and informational purposes only. They are not intended as investment advice or a recommendation to buy, sell, or hold any financial instruments.
Please consult with your SEBI-registered financial advisor before making any trading or investment decisions.
Trading and investing in the stock market involves risk, and you should do your own research and analysis. You are solely responsible for any decisions made based on this research.
#NIFTY Intraday Support and Resistance Levels - 10/09/2025Nifty is expected to witness a gap up opening, continuing its momentum within the broader consolidation zone. The index has been trading in a tight range, and today’s levels will be crucial to determine the intraday direction.
On the upside, if Nifty sustains above 24,700–24,750, buying momentum could push it towards 24,850, 24,900, and 24,950+. A breakout above 25,050 would signal strong bullish sentiment, opening the way for further targets at 25,150, 25,200, and 25,250+.
On the downside, weakness may come into play if Nifty slips below 24,950–24,900. This could trigger a reversal towards 24,850, 24,800, and 24,750 levels. A break below 24,700 may extend the fall with deeper downside possibilities.
Overall, Nifty remains in a consolidation phase, and traders should focus on the breakout levels for clear intraday opportunities. A disciplined approach with strict stop-losses will be key in managing volatility around these zones.

Nifty AnalysisNifty formed a Green candle in daily timeframe with upper and long lower shadow. Nifty is above short term EMA in daily timeframe (20,50,100). Though it supports Bullish sentiment, Nifty is nearing strong resistance around 25,000.
Nifty may attempt to fill the Gap created on 26th Aug.
Green Path: If Nifty breaks and sustains above 24,990, then Nifty may reach 25,110 - 25,140 - 25,180.
Red Path: If Nifty fails to break and sustain above 24,990, then Nifty may reach 24,840 - 24,755 - 24,600

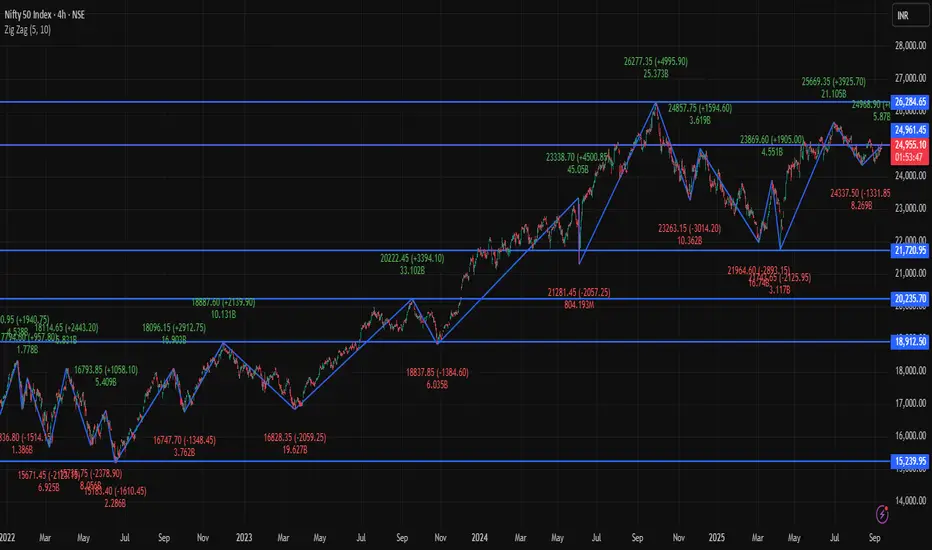
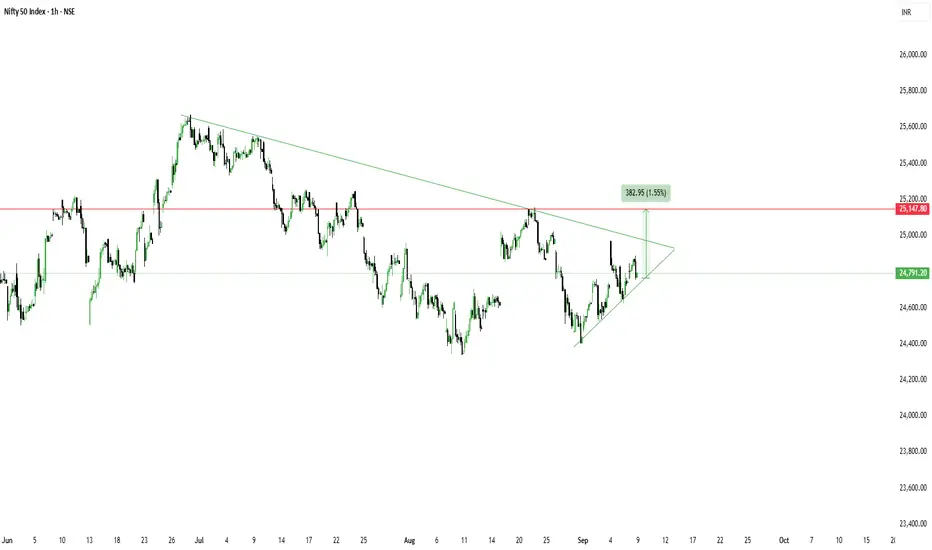
Nifty approaching near term resistance. NSE:NIFTY is approaching a near term resistance.
Key levels to watch are
25,000 - 25200,
25,600 and the strongest rejection at 26,400.
Short term there might be an upside move, however, correction waves are pointing in the downward directions.

Nifty levels - Sep 10, 2025Nifty support and resistance levels are valuable tools for making informed trading decisions, specifically when combined with the analysis of 5-minute timeframe candlesticks and VWAP. By closely monitoring these levels and observing the price movements within this timeframe, traders can enhance the accuracy of their entry and exit points. It is important to bear in mind that support and resistance levels are not fixed, and they can change over time as market conditions evolve.
The dashed lines on the chart indicate the reaction levels, serving as additional points of significance to consider. Furthermore, take note of the response at the levels of the High, Low, and Close values from the day prior.
We hope you find this information beneficial in your trading endeavors.
* If you found the idea appealing, kindly tap the Boost icon located below the chart. We encourage you to share your thoughts and comments regarding it.
Wishing you success in your trading activities!

Exchange-Traded Funds (ETFs) & Index TradingPart I: Understanding Exchange-Traded Funds (ETFs)
1. What are ETFs?
An Exchange-Traded Fund (ETF) is an investment vehicle that holds a basket of assets—such as stocks, bonds, commodities, or currencies—and trades on stock exchanges like a single stock.
Structure: ETFs are designed to track the performance of an underlying index, sector, commodity, or strategy.
Trading: Unlike mutual funds (which are priced once a day), ETFs trade continuously throughout the trading day, with prices fluctuating based on supply and demand.
Flexibility: ETFs can be bought and sold just like stocks, enabling short-selling, margin trading, and intraday strategies.
In essence, ETFs combine the diversification of mutual funds with the flexibility of stocks.
2. History and Evolution of ETFs
The first ETF, SPDR S&P 500 ETF Trust (SPY), was launched in 1993 in the United States. It aimed to track the S&P 500 Index, giving investors exposure to the 500 largest U.S. companies in a single instrument.
Since then, the ETF industry has exploded globally:
1990s: Launch of broad-market ETFs (SPY, QQQ).
2000s: Expansion into sector-based and international ETFs.
2010s: Rise of smart beta and thematic ETFs (e.g., clean energy, robotics, AI).
2020s: Growth in actively managed ETFs, ESG-focused ETFs, and crypto ETFs (like Bitcoin futures ETFs).
Today, ETFs account for trillions of dollars in global assets under management (AUM), making them one of the fastest-growing investment products.
3. Types of ETFs
ETFs come in different forms to suit various investor needs:
Equity ETFs – Track stock indices like S&P 500, Nifty 50, Nasdaq-100.
Bond ETFs – Provide exposure to government, corporate, or municipal bonds.
Commodity ETFs – Track commodities like gold, silver, or oil.
Currency ETFs – Track currency movements (e.g., U.S. Dollar Index ETF).
Sector & Industry ETFs – Focus on sectors like technology, healthcare, or banking.
International & Regional ETFs – Give exposure to markets like China, Europe, or emerging markets.
Inverse & Leveraged ETFs – Provide magnified or opposite returns of an index (used for short-term trading).
Thematic ETFs – Target specific investment themes (renewable energy, AI, blockchain).
Actively Managed ETFs – Managed by fund managers who actively pick securities.
4. How ETFs Work (Mechanics)
ETFs use a creation and redemption mechanism to keep their market price close to the net asset value (NAV).
Authorized Participants (APs): Large institutions that create or redeem ETF shares.
Creation: APs deliver a basket of securities to the ETF provider in exchange for new ETF shares.
Redemption: APs return ETF shares and receive the underlying securities.
This arbitrage mechanism ensures that ETF prices remain close to the value of their underlying assets.
5. Advantages of ETFs
Diversification – Exposure to hundreds of securities in one trade.
Liquidity – Trade throughout the day on exchanges.
Cost Efficiency – Lower expense ratios compared to mutual funds.
Transparency – Daily disclosure of holdings.
Flexibility – Options, margin trading, and short-selling available.
Tax Efficiency – Creation/redemption process reduces taxable distributions.
6. Disadvantages of ETFs
Trading Costs – Brokerage fees and bid-ask spreads can add up.
Tracking Error – ETFs may not perfectly track their underlying index.
Overtrading Risk – Intraday liquidity may encourage speculative behavior.
Leverage & Inverse ETFs Risks – Can lead to significant losses if misunderstood.
Concentration in Popular Sectors – Certain thematic ETFs may be too niche or volatile.
Part II: Index Trading
1. What is an Index?
An index is a statistical measure representing the performance of a group of securities. Examples:
S&P 500 (USA): 500 largest U.S. companies.
Nifty 50 (India): 50 largest companies listed on NSE.
Dow Jones Industrial Average: 30 U.S. blue-chip companies.
Indices serve as benchmarks to measure market or sector performance.
2. What is Index Trading?
Index trading refers to trading financial products based on stock market indices rather than individual stocks.
Investors trade:
Index Futures – Contracts based on future value of an index.
Index Options – Options contracts linked to indices.
ETFs & Index Funds – Indirect way to trade indices.
CFDs (Contracts for Difference): Widely used in global markets.
3. Why Trade Indices?
Diversification – Exposure to entire markets or sectors.
Hedging – Protect portfolios from market downturns.
Speculation – Bet on broad market movements.
Benchmarking – Compare portfolio performance against indices.
4. Popular Global Indices
USA: S&P 500, Nasdaq-100, Dow Jones.
India: Nifty 50, Sensex, Bank Nifty.
Europe: FTSE 100 (UK), DAX 40 (Germany), CAC 40 (France).
Asia: Nikkei 225 (Japan), Hang Seng (Hong Kong), Shanghai Composite (China).
5. Strategies in Index Trading
Buy-and-Hold Strategy: Long-term investment in index ETFs.
Swing Trading: Trading short-to-medium-term index price movements.
Hedging: Using index futures to hedge stock portfolios.
Arbitrage: Exploiting mispricing between futures, ETFs, and underlying stocks.
Sector Rotation: Moving investments between indices/sectors depending on the economic cycle.
Options Strategies: Using index options for spreads, straddles, or covered calls.
Part III: ETFs vs. Index Funds vs. Index Trading
ETFs – Trade on exchanges, intraday pricing, lower costs.
Index Funds – Mutual funds tracking indices, priced once daily.
Index Trading (Futures/Options) – Derivatives-based, high leverage, short-term focus.
Example:
Long-term investor → Index Fund or ETF.
Active trader → Index futures, options, or leveraged ETFs.
Part IV: Risks in ETFs & Index Trading
Market Risk – Both ETFs and indices reflect market movements.
Liquidity Risk – Low-volume ETFs may have wide spreads.
Tracking Error – ETFs may deviate from index returns.
Leverage Risk – Amplified losses in leveraged ETFs/futures.
Currency Risk – International ETFs affected by forex fluctuations.
Concentration Risk – Indices may be dominated by a few large companies (e.g., FAANG in S&P 500).
Part V: ETFs & Index Trading in India
India has seen tremendous growth in ETFs and index trading:
Popular ETFs: Nippon India ETF Nifty BeES, SBI ETF Nifty Bank, ICICI Prudential Nifty Next 50 ETF.
Gold ETFs: Widely used as an alternative to physical gold.
Sector ETFs: Banking, IT, PSU ETFs gaining traction.
Index Futures/Options: Nifty 50 and Bank Nifty derivatives dominate NSE trading volumes.
Government and institutional investors (like EPFO) also allocate large sums to ETFs, boosting the industry further.
Part VI: Future of ETFs & Index Trading
Rise of Thematic & ESG ETFs – Growth in socially responsible investing.
Active ETFs – Managers offering active strategies via ETFs.
Crypto ETFs – Bitcoin and Ethereum ETFs expanding.
Tokenization & Blockchain ETFs – Future of transparent, decentralized ETF structures.
AI-driven Index Construction – Smart beta indices built using machine learning.
Conclusion
Exchange-Traded Funds (ETFs) and Index Trading have reshaped the way investors approach financial markets. They offer simplicity, diversification, transparency, and cost-effectiveness, making them ideal for both beginners and professionals.
ETFs provide access to a wide range of assets, from equities and bonds to commodities and currencies.
Index trading allows traders to speculate, hedge, or invest in entire markets rather than individual stocks.
Together, they represent the future of investing: efficient, scalable, and adaptable to changing global market trends.
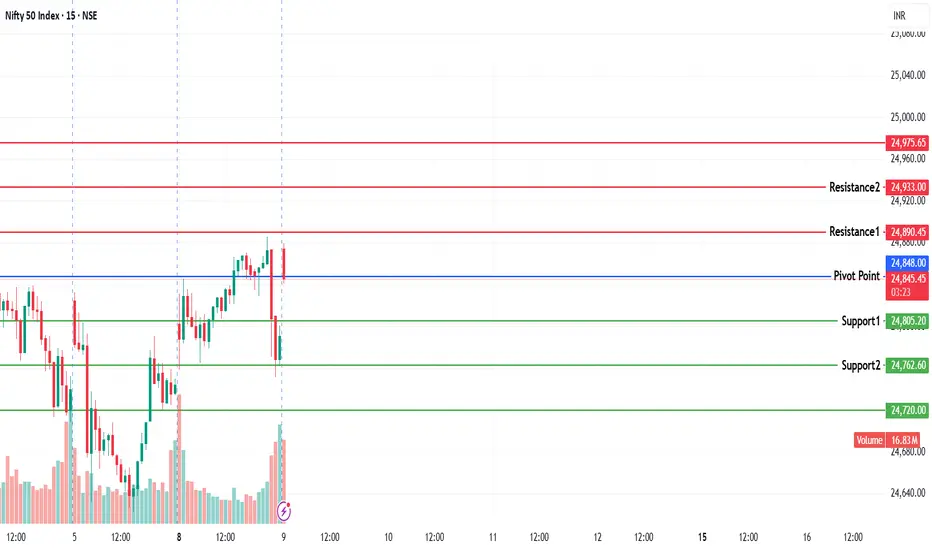
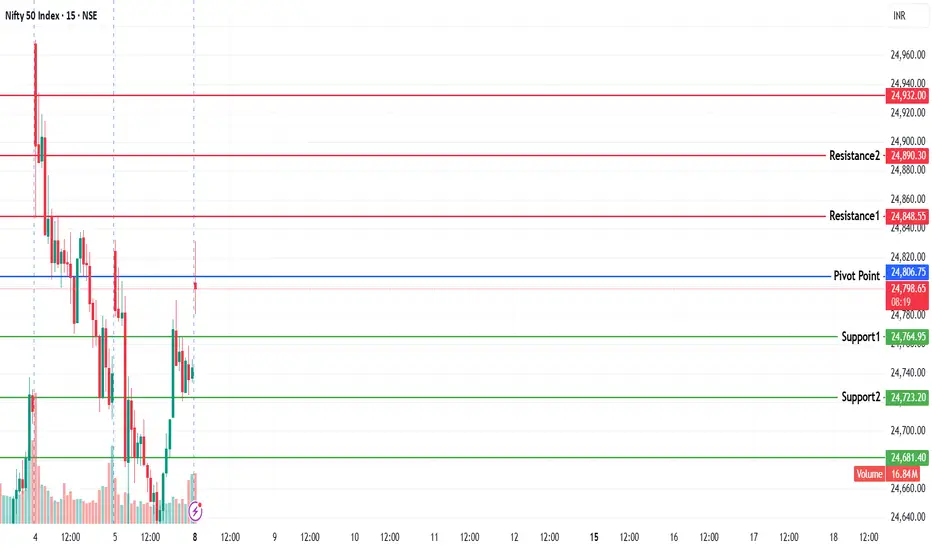
NIFTY KEY LEVELS FOR 09.09.2025NIFTY KEY LEVELS FOR 09.09.2025
RTF: 3 Minutes
If the candle stays above the pivot point, it is considered a bullish bias; if it remains below, it indicates a bearish bias. Price may reverse near Resistance 1 or Support 1. If it moves further, the next potential reversal zone is near Resistance 2 or Support 2. If these levels are also broken, we can expect the trend.
If the range(R2-S2) is narrow, the market may become volatile or trend strongly. If the range is wide, the market is more likely to remain sideways
📢 Disclaimer
I am not a SEBI-registered financial adviser.
The information, views, and ideas shared here are purely for educational and informational purposes only. They are not intended as investment advice or a recommendation to buy, sell, or hold any financial instruments.
Please consult with your SEBI-registered financial advisor before making any trading or investment decisions.
Trading and investing in the stock market involves risk, and you should do your own research and analysis. You are solely responsible for any decisions made based on this research.
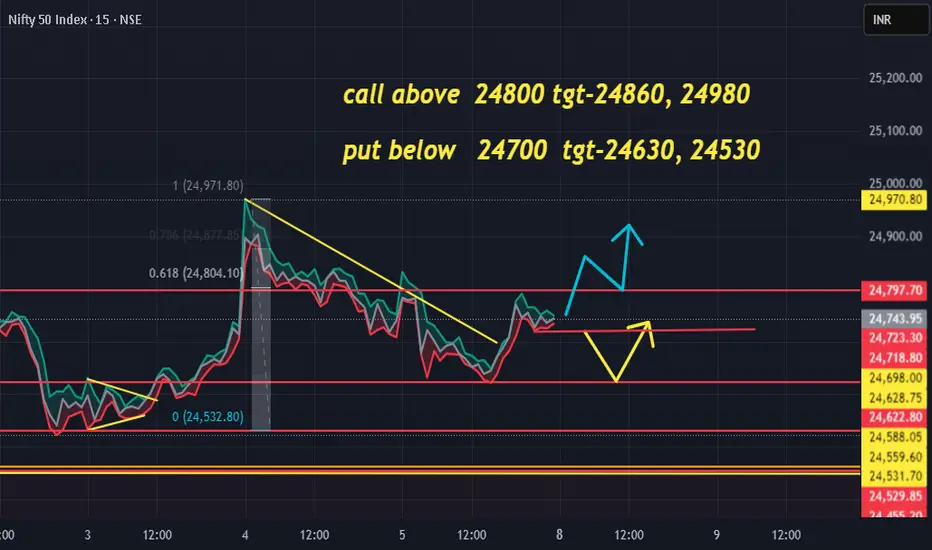
nifty setup for 10/09/202524800-24700 no trading zone
dear retailers dont trade between above zone and avoid from trape .
call above 24800 tgt-24860, 24980
gap up and break below 24700 than go for it
put below 24700 tgt-24630, 24530
major gap down than wait
for confirmation 24630 act as a resistance and possible to reverse for tgt 24700.
More bulls added in Nifty today..keep loadingSo once again Nifty tried to sustain above 24800 but failed. And that’s why we saw another round of Sell-On-Rise.
I’ve been repeating this – until we get a weekly closing above this level, we need to stay cautious and avoid opening any aggressive positions in Nifty.
But today an interesting thing happened – Nifty’s Pivot has moved up to 24803 and PP is 0.12%.
1. Retail index has picked up.
2. Sellers’ volume was higher by 3M.
3. Momentum is up.
4. Trend turned more positive.
5. Market breadth is also positive.
So overall my view remains bullish. But data suggests that tomorrow neither options nor stocks will give big moves. So we can expect a sideway day with bullish tone intact.
Only those stocks with high momentum and relative strength will move – and I’ll focus on trading exactly those.
Support for tomorrow is at 24777 and resistance at 24850.
On the sector side, Metals need to be on the radar tomorrow.
NSE:BANKNIFTY trend is a bit weak, but in coming days it may get a push. A proper move will only come above 54700.
As I said clearly today – it was a day for options trades. And options performed much better than equities.
I traded NSE:MOTHERSON call options today – it gave a massive 90%+ move. Entry was a bit late but still booked good profit.
Second trade was in NSE:NIFTY options for 23rd September expiry, which I am still holding.
My other trades that performed well today:
NSE:IOLCP – +15.35%
NSE:MOBIKWIK – +10.77%
NSE:KIOCL – +4.88%, went up to +8% intraday
📊 Levels at a glance:
Nifty Pivot: 24803
Support: 24777
Resistance: 24850
Pivot Percentile: 0.12%
Bias: Bullish but cautious until 24800+ weekly close
BankNifty Support: 53500
BankNifty Resistance: 54700 (break = momentum)
Trend: Weak but possible push in coming days
Sectors on Radar: Metals, high momentum + relative strength stocks
That’s all for today. Take care and have a profitable tomorrow.
#Nifty #StockToWatch
Nifty Analysis EOD – September 8, 2025 – Monday🟢 Nifty Analysis EOD – September 8, 2025 – Monday 🔴
Shooting Star Signals – Bulls vs Bears Tug-of-War Continues
🗞 Nifty Summary
Nifty opened with a 58-point gap-up, briefly surged another 28 points in the first minute, then slipped 73 points lower, nearly filling the gap. It found support and bounced back, rallying toward the PDH and resistance zone at 24,835 ~ 24,845, where it faced rejection and marked the day high at 24,845.7.
Support at 24,785 (previous resistance turned support) held well. Later, bulls attempted to break PDH and resistance again and succeeded temporarily. However, a long-term trendline held firm and ultimately broke. That breakout attempt turned into a false breakout, and strong selling pressure erased all intraday gains. The index closed near the day’s low at 24,773.15, just 32 points higher than the prior close.
The last 3 consecutive red candles, each with marginal gains, reflect ongoing selling pressure at higher levels.
🛡 5 Min Intraday Chart with Levels
📉 Daily Time Frame Chart with Intraday Levels
🕯 Daily Candle Breakdown
Open: 24,802.60
High: 24,885.50
Low: 24,751.55
Close: 24,773.15
Change: +32.15 (+0.13%)
🏗️ Structure Breakdown
Red candle (Close < Open).
Body: 29.45 points → small body (indecision).
Upper wick: 82.90 points → long upper wick indicates strong rejection.
Lower wick: 21.60 points → short.
📚 Interpretation
The market opened higher and attempted to sustain at highs but was met with strong supply near 24,880.
Selling pressure dominated, pushing the price back toward the lows.
Long upper wick signals profit-booking and bearish hesitation.
🕯Candle Type
Shooting Star / Inverted Hammer (bearish context) → suggests resistance and inability to extend bullish momentum.
🔍 Short-Term View – September 9, 2025
Resistance: 24,895 – 24,910 (strong supply zone).
Support: 24,750 (today’s defended level), then 24,620.
👉 Bias Direction:
Failure to cross 24,880 may lead to renewed weakness.
A close below 24,750 could drag the index quickly toward 24,620.
🚩 Current Market Sentiment:
A tug-of-war:
Bulls defending 24,620–24,650.
Bears defending 24,880–24,980.
A decisive breakout from this range will determine the next directional move.
🛡 5 Min Intraday Chart
⚔️ Gladiator Strategy Update
ATR: 204.9
IB Range: 87.2 → Medium
Market Structure: Balanced
Trade Highlights:
12:35 AM – Long Trigger → SL Hit
📌 Support & Resistance Levels
Resistance Zones:
24,785
24,835 ~ 24,845
24,895 ~ 24,910
24,975 ~ 25,004
Support Zones:
24,685
24,657
24,630 ~ 24,620
24,540 ~ 24,525
💡 Final Thoughts
Today’s Shooting Star reflects a clear bearish bias at higher levels. Despite small gains, the inability to sustain above 24,880 highlights selling pressure. Until bulls reclaim 24,880–24,910 convincingly, expect continued sideways to bearish action.
📖 “When resistance holds, strength is tested, and only time reveals the winner.”
✏️ Disclaimer
This is just my personal viewpoint. Always consult your financial advisor before taking any action.

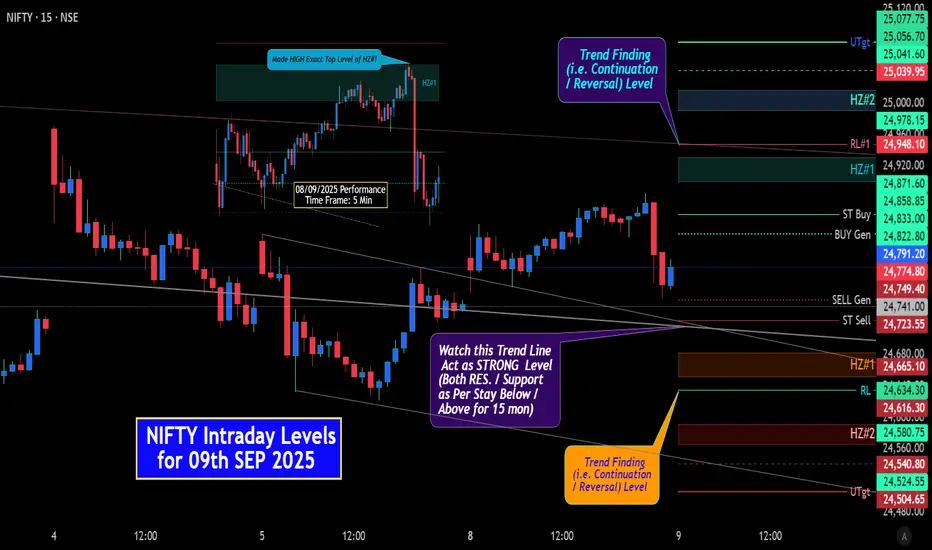
NIFTY: Intraday Levels for 09th SEP 2025NIFTY: Intraday Levels for 09th SEP 2025
^^^^^^^ Plot Levels Using 3 Min, 5 Min Time frame in your Chart for Better Analysis ^^^^^^^
L#1: If the candle crossed & stays above the “Buy Gen”, it is treated / considered as Bullish bias.
L#2: If the candle stays above “Sell Gen” but below “Buy Gen”, it is treated / considered as Sidewise. Aggressive Traders can take Long position near “Sell Gen” either retesting or crossed from Below & vice-versa i.e. can take Short position near “Buy Gen” either retesting or crossed downward from Above.
L#3: If the candle crossed & stays below the “Sell Gen”, it is treated / considered a Bearish bias.
L#4: Possibility / Probability of REVERSAL near RL#1 & UTgt
HZ => Hurdle Zone, Specialty of “HZ#1 & HZ#2” is Sidewise (behaviour in Nature)
Rest Plotted and Mentioned on Chart
Color code Used:
Green =. Positive bias.
Red =. Negative bias.
RED in Between Green means Trend Finder / Momentum Change
/ CYCLE Change and Vice Versa.
Notice One thing: HOW LEVELS are Working.
Use any Momentum Indicator / Oscillator or as you "USED to" to Take entry.
📢 Disclaimer
I am not a SEBI-registered financial adviser.
The information, views, and ideas shared here are purely for educational and informational purposes only. They are not intended as investment advice or a recommendation to buy, sell, or hold any financial instruments.
Please consult with your financial advisor before making any trading or investment decisions
Trading and investing in the stock market involves risk, and you should do your own research and analysis. You are solely responsible for any decisions made based on this research.
Mother Line Resistance and Trend line Resistance stopping Nifty.Two important Resistances on the daily chart Mother line at 24788 and Trend line which is at 24910 are stopping Nifty from flying high. The sectoral index providing maximum support and allowing Nifty to hold above 24700 is defiantly Auto sector which is doing heavy weight lifting. Again today Auto index rose by 3.3%. It can still grow a bit but it is clearly entering the overbought zone. The sector looking most laggard is IT index. Again today it fell close to 1% with no respite in sight with torrid signals still coming from US.
With this seesaw battle continuing Resistances for Nifty currently are at: 24788 (Mother line resistance) and 24910 trendline resistance. If these 2 resistances are crossed the major resistances will be at 25K, 25149 and 25245. Above 25245 Nifty can grow stronger and reach bullish territory.
Supports for Nifty currently remain at: 24621, 24486 (trendline support), 24409 and finally 24292 (Father line Support). A closing below 24292 will drag Nifty further downwards into a strong bearish territory.
Nifty can rise from here and reach 24910 where it will be tested or it can fall towards 24621 or 24486 and then again try to rise towards the trend line at 24910. Which path it will take is yet to be deciphered.
To know more about Trend lines, Supports, Resistances, Mother line and Father line and to draw the same on your chart and for learning Techo-Funda analysis read my Book THE HAPPY CANDLES WAY TO WEALTH CREATION. The book is available on Amazon and will help you in your investing journey whether you are a seasoned investor or a new beginner. The chapters in the book are mostly standalone. The book is rated 4.8/5 on Amazon. It is a value for money book priced at Rs.349/- (Delivery charges extra as charged by Amazon).
Disclaimer: The above information is provided for educational purpose, analysis and paper trading only. Please don't treat this as a buy or sell recommendation for the stock or index. The Techno-Funda analysis is based on data that is more than 3 months old. Supports and Resistances are determined by historic past peaks and Valley in the chart. Many other indicators and patterns like EMA, RSI, MACD, Volumes, Fibonacci, parallel channel etc. use historic data which is 3 months or older cyclical points. There is no guarantee they will work in future as markets are highly volatile and swings in prices are also due to macro and micro factors based on actions taken by the company as well as region and global events. Equity investment is subject to risks. I or my clients or family members might have positions in the stocks that we mention in our educational posts. We will not be responsible for any Profit or loss that may occur due to any financial decision taken based on any data provided in this message. Do consult your investment advisor before taking any financial decisions. Stop losses should be an important part of any investment in equity.

Nifty levels - Sep 09, 2025Nifty support and resistance levels are valuable tools for making informed trading decisions, specifically when combined with the analysis of 5-minute timeframe candlesticks and VWAP. By closely monitoring these levels and observing the price movements within this timeframe, traders can enhance the accuracy of their entry and exit points. It is important to bear in mind that support and resistance levels are not fixed, and they can change over time as market conditions evolve.
The dashed lines on the chart indicate the reaction levels, serving as additional points of significance to consider. Furthermore, take note of the response at the levels of the High, Low, and Close values from the day prior.
We hope you find this information beneficial in your trading endeavors.
* If you found the idea appealing, kindly tap the Boost icon located below the chart. We encourage you to share your thoughts and comments regarding it.
Wishing you success in your trading activities!

Global Index TradingIntroduction
Global financial markets are deeply interconnected. From the bustling streets of New York to the trading floors in Tokyo, stock markets react not just to domestic events but also to global developments. Investors often find it overwhelming to track thousands of individual stocks across different countries. This is where global indices come in.
Global indices—such as the S&P 500, Dow Jones, NASDAQ, FTSE 100, Nikkei 225, Hang Seng, and DAX—act as benchmarks that represent the performance of a basket of leading companies in a region or sector. Instead of focusing on a single stock, traders can participate in the performance of an entire economy, sector, or region by trading indices.
Global index trading has grown rapidly due to its simplicity, diversification benefits, and ability to capture worldwide economic movements. Whether through futures, ETFs, CFDs, or options, traders can speculate or hedge using indices.
This article explores what index trading is, how it works, its strategies, risks, advantages, and future trends, giving you a complete 360° understanding.
What is an Index?
An index is a statistical measure that tracks the performance of a group of assets. In financial markets, stock indices track a basket of company stocks.
For example:
S&P 500 → Tracks 500 largest US-listed companies.
Nikkei 225 → Represents 225 blue-chip companies listed in Japan.
FTSE 100 → Covers 100 top UK companies listed on the London Stock Exchange.
DAX 40 → Represents 40 major German companies.
By trading these indices, investors gain exposure to entire markets instead of picking individual stocks.
Why Trade Global Indices?
Diversification → Instead of betting on one company, you’re trading the collective performance of many.
Global Exposure → Access to markets worldwide (US, Europe, Asia).
Liquidity → Indices are highly traded, ensuring smooth entry and exit.
Transparency → Indices reflect real-time global economic conditions.
Opportunities in Both Directions → Traders can go long (buy) when bullish or short (sell) when bearish.
Hedging Tool → Investors hedge their portfolios against global uncertainties using index futures and options.
Major Global Indices
1. United States
Dow Jones Industrial Average (DJIA) → Tracks 30 blue-chip companies.
S&P 500 → Broadest and most followed US index (500 companies).
NASDAQ Composite → Tech-heavy index with over 3,000 companies.
2. Europe
FTSE 100 (UK) → UK’s top 100 companies.
DAX 40 (Germany) → German giants like BMW, Siemens, Allianz.
CAC 40 (France) → French market benchmark.
3. Asia-Pacific
Nikkei 225 (Japan) → Japan’s premier stock index.
Hang Seng (Hong Kong) → Reflects China’s corporate strength.
Shanghai Composite (China) → Mainland Chinese companies.
ASX 200 (Australia) → Australia’s top companies.
4. Emerging Markets
Nifty 50 (India) → India’s top 50 companies.
Bovespa (Brazil) → Brazil’s leading stock index.
RTS Index (Russia) → Russia’s blue-chip stocks.
These indices act as economic barometers, and traders worldwide monitor them daily.
How Global Index Trading Works
Trading indices isn’t about buying the index itself (since it’s just a number). Instead, traders use financial instruments tied to the index’s value:
Index Futures
Standardized contracts to buy/sell the index at a future date.
Example: S&P 500 futures.
Used by institutional investors for speculation and hedging.
Index Options
Provide the right (not obligation) to buy/sell indices at specific levels.
Useful for hedging against sudden market drops.
Exchange-Traded Funds (ETFs)
Funds that replicate index performance.
Example: SPY (S&P 500 ETF).
Suitable for long-term investors.
Contracts for Difference (CFDs)
Popular in retail trading.
Allow traders to speculate on index price movements without owning underlying assets.
Factors Influencing Global Indices
Index values fluctuate based on:
Economic Data
GDP growth, inflation, employment data.
Corporate Earnings
Quarterly earnings of large companies drive indices.
Central Bank Policies
Interest rate hikes or cuts (Fed, ECB, BOJ).
Geopolitical Events
Wars, trade disputes, elections.
Global Sentiment
Risk-on (bullish) vs. risk-off (bearish) moods.
Currency Movements
Strong/weak currencies affect export-driven companies.
Popular Strategies in Global Index Trading
Trend Following
Identify long-term trends and ride momentum.
Example: Buying NASDAQ during a tech boom.
Swing Trading
Capturing medium-term moves within global index cycles.
Day Trading / Scalping
Taking advantage of small intraday price fluctuations.
Hedging Strategies
Using index futures to protect portfolios during uncertainty.
Pairs Trading
Trade two correlated indices (e.g., long S&P 500 and short FTSE 100).
Arbitrage
Exploiting price inefficiencies between futures, ETFs, and spot indices.
Benefits of Global Index Trading
Simplicity: No need to analyze thousands of individual stocks.
Lower Volatility: Compared to single stocks, indices move more steadily.
Cost Efficiency: ETFs and CFDs allow exposure at low costs.
24-Hour Opportunities: With different time zones, global indices provide nearly round-the-clock trading.
Risks in Global Index Trading
Market Volatility
Events like COVID-19 caused sharp global index crashes.
Leverage Risk
Futures/CFDs use leverage, magnifying losses.
Systemic Risks
Global crises (2008 Financial Crash, 2020 Pandemic) affect all indices simultaneously.
Currency Risk
Non-domestic traders face forex risks.
Overexposure
Heavy index positions without proper diversification may backfire.
Case Studies of Global Index Movements
1. 2008 Global Financial Crisis
US housing bubble burst → Dow Jones & S&P 500 crashed 50%.
Global indices (Nikkei, FTSE, DAX) followed suit.
2. COVID-19 Pandemic (2020)
Panic selling → Dow fell 3,000 points in a day.
Stimulus packages → Strong rebound across all indices.
3. US Tech Boom (2010s)
NASDAQ outperformed due to Apple, Amazon, Google, Microsoft.
Tech indices became global growth drivers.
Tools & Platforms for Index Trading
MetaTrader (MT4/MT5)
Thinkorswim
Interactive Brokers
TradingView (for charting)
Bloomberg & Reuters (for news updates)
Future of Global Index Trading
Increased ETF Popularity → More passive index investments.
AI & Algo Trading → Automated strategies dominating global index flows.
Thematic Indices → ESG, clean energy, tech-focused indices growing.
Crypto Indices → Crypto-linked index trading gaining traction.
24/7 Trading → Expansion of round-the-clock index trading.
Tips for Beginners
Start with major indices (S&P 500, NASDAQ, DAX).
Use demo accounts before live trading.
Avoid over-leverage.
Follow global news & central bank updates.
Combine technical and fundamental analysis.
Conclusion
Global index trading offers a powerful, diversified, and accessible way to participate in financial markets. Instead of picking individual winners, traders can ride the economic waves of entire regions. While opportunities are vast, one must remain cautious of risks like leverage, volatility, and systemic crises.
For long-term investors, global index ETFs provide steady growth aligned with global economic progress. For traders, futures, options, and CFDs open doors to both speculative profits and hedging strategies.
In today’s interconnected world, global index trading is no longer optional—it’s essential for anyone looking to understand and profit from international financial markets.
NIFTY KEY LEVELS FOR 08.09.2025NIFTY KEY LEVELS FOR 08.09.2025
RTF: 3 Minutes
If the candle stays above the pivot point, it is considered a bullish bias; if it remains below, it indicates a bearish bias. Price may reverse near Resistance 1 or Support 1. If it moves further, the next potential reversal zone is near Resistance 2 or Support 2. If these levels are also broken, we can expect the trend.
If the range(R2-S2) is narrow, the market may become volatile or trend strongly. If the range is wide, the market is more likely to remain sideways
📢 Disclaimer
I am not a SEBI-registered financial adviser.
The information, views, and ideas shared here are purely for educational and informational purposes only. They are not intended as investment advice or a recommendation to buy, sell, or hold any financial instruments.
Please consult with your SEBI-registered financial advisor before making any trading or investment decisions.
Trading and investing in the stock market involves risk, and you should do your own research and analysis. You are solely responsible for any decisions made based on this research.
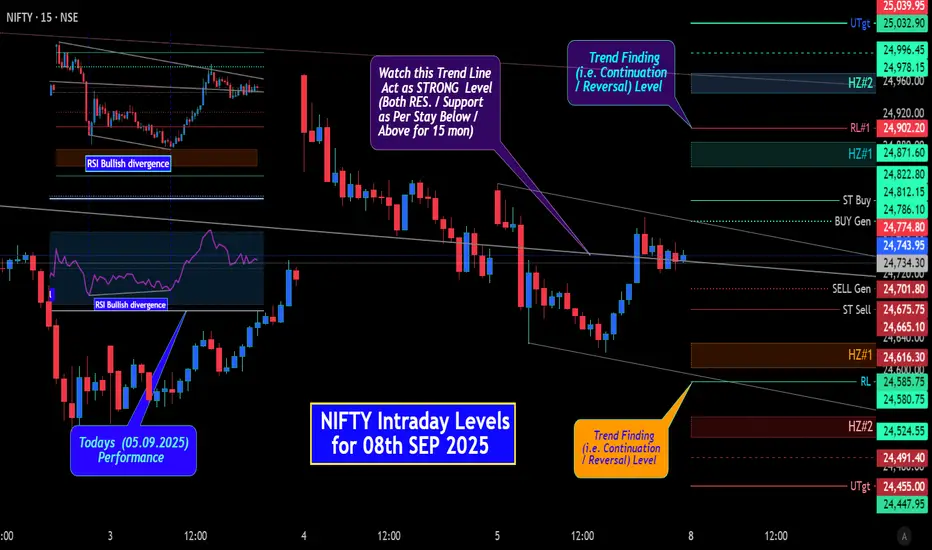
NIFTY Intraday Level for 08th SEP 2025All Plotted and Mentioned on Chart.
*************************Use Time frame 5 Minutes for Better Analysis******************************
L#1: If the candle crossed & stays above the “But Gen”, it is treated / considered as Bullish bias.
L#2: If the candle stays above “Sell Gen” but below “But Gen”, it is treated / considered as Sidewise. Aggressive Traders can take Long position near “Sell Gen” either retesting or crossed from Below & vice-versa i.e. can take Short position near “Buy Gen” either retesting or crossed downward from Above.
L#3: If the candle crossed & stays below the “Sell Gen”, it is treated / considered a Bearish bias.
L#4: Possibility / Probability of REVERSAL near RL#1 & UTgt
HZ => Hurdle Zone, Specialty of “HZ#1 & HZ#2” is Sidewise (Behaviour by nature)
Color code:
Green =. Positive bias.
Red =. Negative bias.
RED in Between Green means Trend Finder / Momentum Change
/ CYCLE Change and Vice Versa.
Notice One thing: HOW LEVELS are Working.
Use any Momentum Indicator / Oscillator or as you "USED to" to Take entry.
📢 Disclaimer
I am not a SEBI-registered financial adviser.
The information, views, and ideas shared here are purely for educational and informational purposes only. They are not intended as investment advice or a recommendation to buy, sell, or hold any financial instruments.
Please consult with your SEBI-registered financial advisor before making any trading or investment decisions.
Trading and investing in the stock market involves risk, and you should do your own research and analysis. You are solely responsible for any decisions made based on this research.
66% possibility of NIFTY 24,160 this week.Green MA is VWAP from 7 April 2025 Swing Low. From that date perspective, market is still bulish.
Yellow MA is VWAP from Swing High of 27 September 2024. Market should bounce back from that. It it does not and crashes through - then we will officially be in the bearish phase.
Sell NIFT on Tuesday if Monday closes below 24,566. SL 24,600. 1/3 profit taking at 24,400, next 1/3 at 24,300 and remaining.
Purely a study. Not an advice.
All the best.

NIFTY50.....Ready to rumble? Not yet....Hello Traders,
I couldn't let you go without an update for NIFTY50! Here it is!
The NIFTY50 reached a high during Thursday session at 24970 and before strongly reversed strong to the downside.
This was inline with my expectation, but it moves higher, as I anticipated. The move from the possible wave (ii), green, low look like a "three-up" and so I argue this was a corrective move up.
If so to come the next move should be down!
Chart analysis:
The low @24365 is the key level. If this level is undercut, the door would be open to lower levels, as I wrote in my latest analysis. One target range could be the "sky-blue" rectangle. As before. I am not clear with the structure of the move and I have labelled the count, but there is a lot of doubt about it!
Another idea is, that the low @24365 was the key low and the move that started that day, is part of waves (i), green and a deep diving wave (ii)) into the retracements, with a wave (iii) to follow! The move from the possible wave (ii), green, low @ 24407 looks like a "three-up", so it would be a corrective one. On the other hand, it is possible, that a "double"-waves 1 and 2 would be underway.
In this case, the index will be ready to "rumble", i.e. explode in the coming sessions!
As before. Seasonally, the time has not yet to come for a so called "Christmas-rally", it is simply too early!
So I guess, lower lows in the coming weeks would be too expected.
A "rate-cut" by the FED (Federal Reserve System) of course would stimulate the markets around the world. But keep in mind, that political stock markets have short legs, means it can be, that the market is on the way to price a rate cut, and then droop to the downside! But this, my friends, is only my personal point of view!
So, friends, you are prepared for the coming sessions.
Have a great week.....
Ruebennase
Please ask or comment as appropriate.
Trade on this analysis at your own risk.
