Nifty Wraps Week Positive: Sustainability in QuestionIndian equity markets closed the week with strong gains, with the Nifty rising 1.29% supported by solid domestic economic data and policy reforms.
Key economic indicators like Q1 GDP growth at 7.8%, steady FDI inflows, and a smaller current account deficit have boosted investor confidence.
Despite these positives, global challenges and heavy FII selling over the last two months (₹94,600 crore) still pose risks.
Sector-wise, the picture is mixed. While the overall market outlook is positive, weakness in banking and IT is restraining gains. A rebound in these sectors is crucial for the uptrend to sustain.
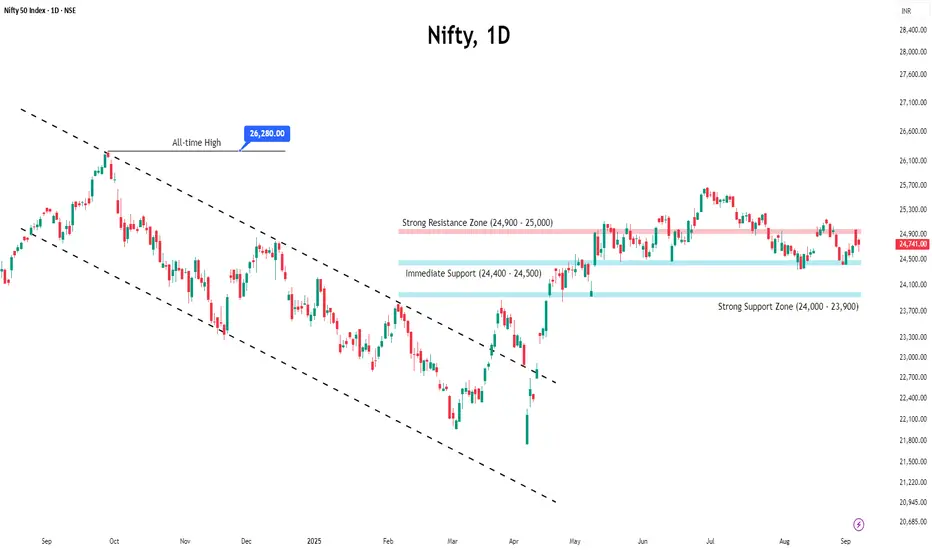
Technically, the index faces immediate resistance at the 24,950–25,000 zone, with support positioned at 24,500–24,400.
A decisive breakout from this range is needed to establish the next directional trend; otherwise, the market is poised for a period of consolidation.
NIFTY trade ideas
Nifty 50 Cup & Handle Breakout - Weekly Set-up - 08-12 Sept., 25Chart Pattern Identification:
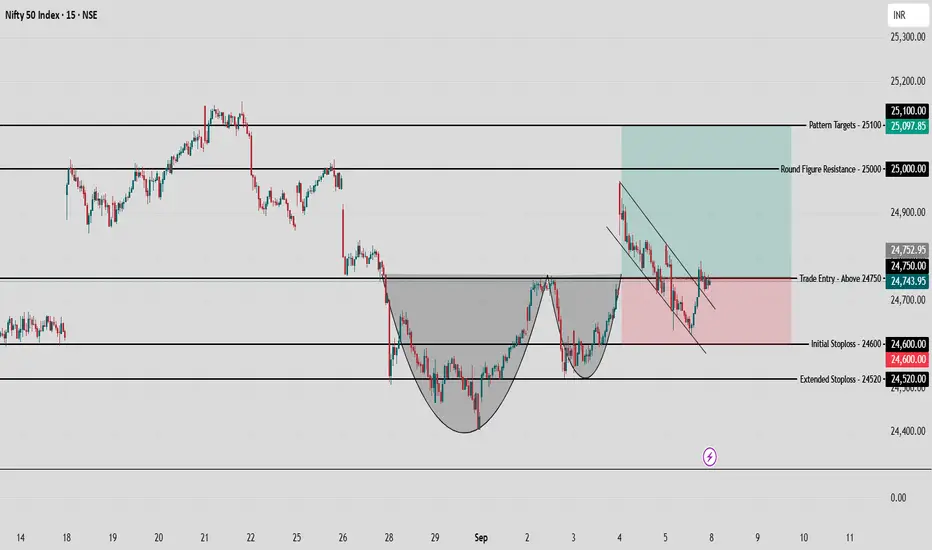
The chart illustrates a Cup & Handle pattern validated on the 15-minute Nifty 50 Index.
Pattern Validation: Pattern forms when price carves a rounded cup, retraces slightly to form the handle, and then breaks out above the neckline (24,750 zone here).
Pattern Invalidation: The setup fails if price closes and sustains below the handle low (around 24,600), indicating loss of bullish momentum and potential reversal.
Pattern Formation Conditions: Most reliable when occurring after a downtrend or consolidation, signaling accumulation and renewed bullish sentiment.
Significance: Indicates a shift from seller exhaustion to buyer strength, often leading to measured up-moves upon breakout.
How to Trade This Pattern
Entry: Take long positions only after a confirmed breakout and close above 24,750 (neckline). Avoid premature entries inside the handle.
Exit:
Initial Target: Watch for resistance near the psychological round figure of 25,000, where some profit booking and volatility are likely.
Ultimate Target: Projected pattern target is 25,100 as per the height of the cup extrapolated from breakout.
Stoploss:
Initial Stop: 24,600 (below handle low).
Extended Stop: 24,520 for extra volatility margin.
Risk-Reward: Entry at 24,750, Stop-loss at 24,600, Target at 25,100 gives a risk-reward ratio better than 1:2.5. For a strict 1:3 R:R setup, look for partial profit booking at 25,150–25,200.
Round Figure Psychology: Be vigilant as 25,000 is a major round number; expect increased order flow, resistance, and possible profit taking at this level.
Disclaimers
This content is for educational purposes only and reflects one approach to technical analysis. All trading carries risk. Backtest strategies, and never risk more than you can afford to lose. Individual results may vary; review market conditions and use appropriate position sizing.
👉 For more actionable setups and in-depth trading education, follow me!
Nifty September 2nd Week AnalysisNifty has formed a strong support near 24400 levels and is holding onto it for the last 2 weeks. Now , until 24400 is taken, we should not expect any major down move. On the upside, 24950-25050 is acting as a strong resistance for Nifty in recent times. Now, the move of Nifty will depend on whether it will cross the upside range or breach the downside support. Upon that, we can expect a strong move on that particular side. Although the charts are looking positive for the upcoming week.
All levels are marked in the chart posted.
Nifty at a Crossroads – Will W Pattern Hold or Breakdown Ahead?Nifty closed the week at 24,741, up 315 points from the previous close. It touched a high of 24,980 and a low of 24,432, once again moving exactly within my projected range of 24,900 – 23,900.
This week, both Nifty and Bank Nifty formed an Inside Candle pattern, making this week’s low of 24,432 a crucial level to watch. A breakdown below it could drag Nifty toward 24,000/23,900.
Bullish Possibility – W Pattern on Weekly Chart
There’s an interesting W pattern developing on the weekly timeframe. If it plays out, we could see an early-week upside (Mon/Tue) toward 25,100/25,200. However, for a sustained rally, Nifty needs to hold above 25,200 – only then can it test 25,700, which for now looks challenging.
⚠️ My View
I’ve been warning about an impending downmove for 2 weeks, and I continue to prepare by hedging my portfolio and making a watchlist of strong stocks to accumulate when the correction comes. The question is – are you ready?
US Market Update – S&P500
The S&P500 closed at 6,481, up 21 points from last week, with a high of 6,532 and a low of 6,360. This index is approaching the key Fibonacci level of 6,568.
👉 For US investors: Move your trailing SL to 6,376 to lock in profits.
👉 Consecutive closes above 6,568 could open the doors to the next major level of 6,579 (around 7% higher from current levels).
👉 Until then, keep trailing positions as long as cracks aren’t visible.
For Indian investors – brace yourselves, because the road ahead could be volatile and bumpy.
Want me to review any index or cryptocurrency for you? Drop it in the comments, and I’ll cover it in my next update!

Nifty staring at couple of important resistances next week. Nifty is looking at few resistances before it can breakfree. The resistance immediately in front of Nifty is 24748. Once this resistance is crossed then there will be Father line of hourly chart which will again act as resistance. Father line of hourly chart remains at 24775. Once we get a closing above these 2 levels then Nifty can further grow towards 24835, 24930 and 25000. If we get a closing above 25K then the next resistance will be at 25126.
Supports for Nifty currently are at 24701 (Mother line Support of hourly chart) if we get a closing below this level then few other supports will be at 24645, 24559, 24465 (Trend line Support) and 24350.
Closing below 24350 will make Nifty very week. GST reforms are trying to support the Nifty which is being pushed down by Trump Tariffs and other Macro factors.
Disclaimer: The above information is provided for educational purpose, analysis and paper trading only. Please don't treat this as a buy or sell recommendation for the stock or index. The Techno-Funda analysis is based on data that is more than 3 months old. Supports and Resistances are determined by historic past peaks and Valley in the chart. Many other indicators and patterns like EMA, RSI, MACD, Volumes, Fibonacci, parallel channel etc. use historic data which is 3 months or older cyclical points. There is no guarantee they will work in future as markets are highly volatile and swings in prices are also due to macro and micro factors based on actions taken by the company as well as region and global events. Equity investment is subject to risks. I or my clients or family members might have positions in the stocks that we mention in our educational posts. We will not be responsible for any Profit or loss that may occur due to any financial decision taken based on any data provided in this message. Do consult your investment advisor before taking any financial decisions. Stop losses should be an important part of any investment in equity.

Nifty Weekly OutlookThe Nifty 50 ended the week at 24,741.00, gaining +1.29%.
🔹 Key Levels for the Upcoming Week
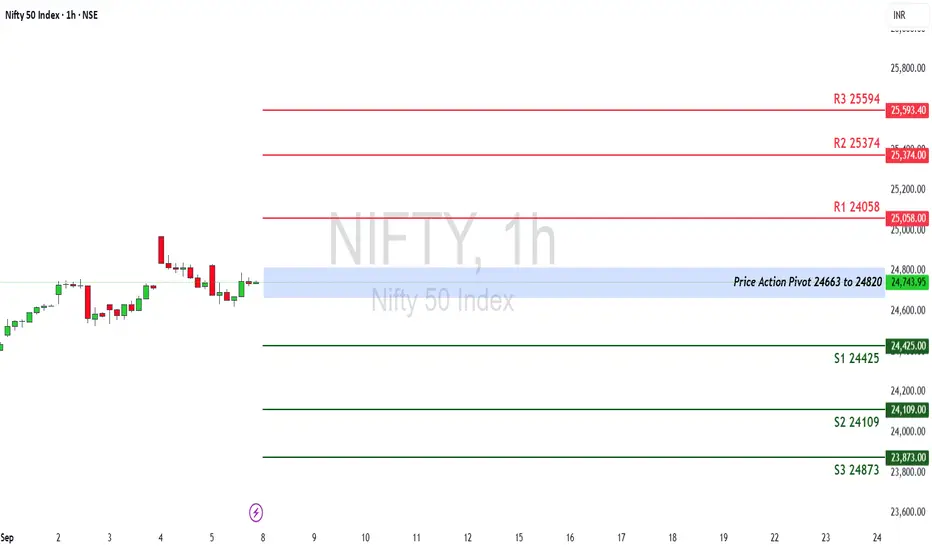
📌 Price Action Pivot Zone:
24,663 to 24,820 – This is the critical zone to watch. A decisive move beyond either side may dictate next week’s trend.
🔻 Support Levels
S1: 24,425
S2: 24,109
S3: 23,873
🔺 Resistance Levels
R1: 25,058
R2: 25,374
R3: 25,594
📈 Market Outlook
✅ Bullish Scenario:
If Nifty sustains above 24,820, buying momentum could build, aiming for R1 (25,058). A strong breakout above this may push prices towards R2 (25,374) and R3 (25,594).
❌ Bearish Scenario:
If the index breaks below 24,663, selling pressure may return. This could drag Nifty towards S1 (24,425) and further down to S2 (24,109) and S3 (23,873).
Disclaimer: lnkd.in
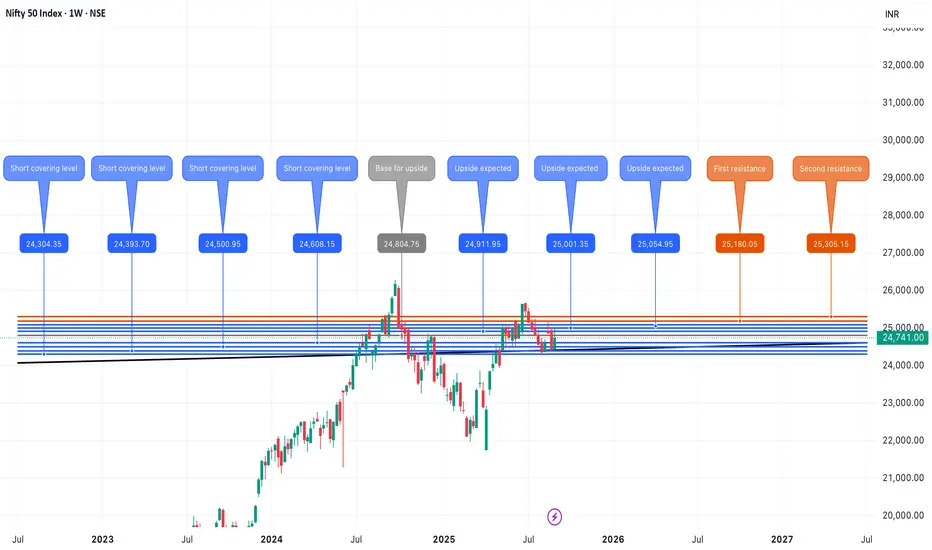
Get ready for a very long Bullish run in Indian MarketAs per what is happening around and measures being taken by the government combined with the technicals like SMA 100, SMA200, Fibonacci it is evident that mkt is now ready and will start moving upwards with support range (24545-24352) and 1st target being at 25307, 2nd target at 25669 and 3rd target at 26277 and likely to make an ATH

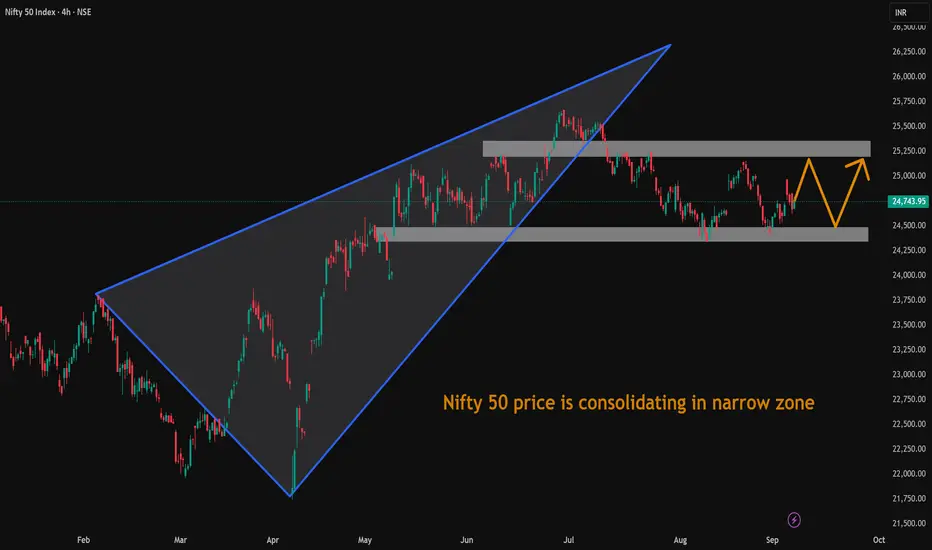
Nifty 50 price is consolidating in narrow zoneNifty 50 price is consolidating in narrow zone. Positive fundamentals by government policies is giving support to market.
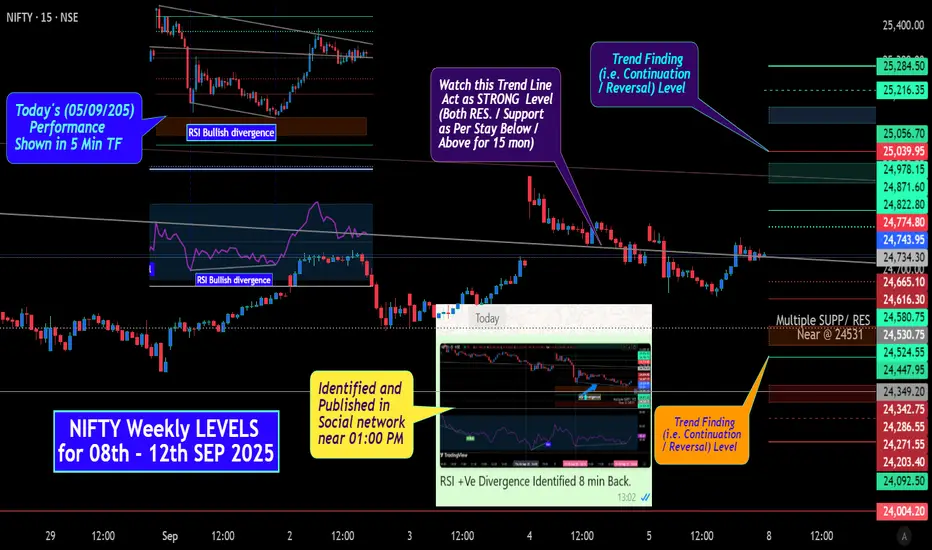
NIFTY : WEEKLY Levels from 08th - 12th SEP 2025All Plotted and Mentioned on Chart.
Color code:
Green =. Positive bias.
Red =. Negative bias.
RED in Between Green means Trend Finder / Momentum Change
/ CYCLE Change and Vice Versa.
Notice One thing: HOW LEVELS are Working.
Use any Momentum Indicator / Oscillator or as you "USED to" to Take entry.
Disclaimer: Study Purpose only.
Sorry for clumsiness.
IDENTIFIED "RSI BULLISH DIVERGENCE" in between 12:55 TO 1:00 PM
and posted in Social Platform.
Given Screen shot in Chart. Notice time of POST.
Nifty Analysis EOD – September 5, 2025 – Friday🟢 Nifty Analysis EOD – September 5, 2025 – Friday 🔴
Double Bottom at the Lows—Hope for Bulls or Just Another Trap?
🗞 Nifty Summary
Nifty opened with a 98-point gap-up at 24,825 but showed hesitation, spending the first 45 minutes stuck in the CPR zone within a narrow 60-point band. By 10 AM, the index slipped sharply—breaking both IB Low and BC level, and within minutes also pierced PDL, tumbling nearly 143 points. Support emerged at S1 (24,635), where the fall finally halted.
The index then spent over two hours base-building between PDL and S1, forming a double bottom (Adam–Eve) pattern. Once this base broke out above PDL, the index rallied quickly, meeting its upside target.
Structurally, the session shaped into a triple distribution day:
Early selling phase,
Midday consolidation,
Late recovery rally.
Intraday option traders found strong opportunities with fast 2x expansion off a small IB, but swing traders likely struggled with whipsaws.
Closing nearly flat at 24,741 (+6.7 pts) keeps the directional dilemma alive. Yesterday’s rejection repeated today—but the 125-point recovery off lows and close above PDL gives bulls a glimmer of hope.
🛡 5 Min Intraday Chart with Levels
📉 Daily Time Frame Chart with Intraday Levels
🕯 Daily Candle Breakdown
Open: 24,818.85
High: 24,832.35
Low: 24,621.60
Close: 24,741.00
Change: +6.70 (+0.03%)
🏗️ Structure Breakdown
Red candle (Close < Open), but still slightly positive vs. previous day.
Body: 77.85 pts → small bearish body.
Upper wick: 13.50 pts → negligible.
Lower wick: 119.40 pts → long tail.
🕯Candle Type
Hammer / Pin Bar → indicates potential reversal with bullish undertone.
📚 Interpretation
Market slipped nearly 200 pts intraday but bounced back strongly.
Long downside tail reflects demand defense at 24,620–24,635 zone.
Despite red body, price action leans neutral-to-bullish.
🔍 Short-Term View – September 8, 2025
Support: 24,620 (defended low).
Resistance: 24,830–24,980 (recent rejection zone).
👉 Bias Direction:
> If 24,620 breaks, weakness could extend to 24,450.
> If 24,830 sustains, bulls may regain the upper hand.
🛡 5 Min Intraday Chart
⚔️ Gladiator Strategy Update
ATR: 211.61
IB Range: 59.7 → Small
Market Structure: Balanced
Trade Highlights:
1) 10:00 AM – Short Trigger → Target Hit (R:R = 1:3.64)
📌 Support & Resistance Levels
Resistance Zones:
24,785
24,835 ~ 24,845
24,895 ~ 24,910
24,975 ~ 25,004
Support Zones:
24,685
24,657
24,630 ~ 24,620
24,540 ~ 24,525
💡 Final Thoughts
Today’s Hammer at the lows signals that buyers are quietly absorbing supply. But conviction remains missing—two back-to-back sessions show indecision at higher levels. Until either 24,620 breaks or 24,830 is sustained, expect choppy action favoring intraday trades over positional setups.
📖 “Reversals don’t start with noise—they begin with defense at key levels.”
✏️ Disclaimer
This is just my personal viewpoint. Always consult your financial advisor before taking any action.

Good recovery from lows of the week. A lot was expected this week on account of GST rate cut decision. It was a volatile week where Nifty. From last week low of Nifty that is 24404 Nifty made a high of 24980. Having made these highs Nifty was not able to sustain these levels to close the week at 24741. So in my opinion it was a mixed week. The shadow of the candle is Neutral.
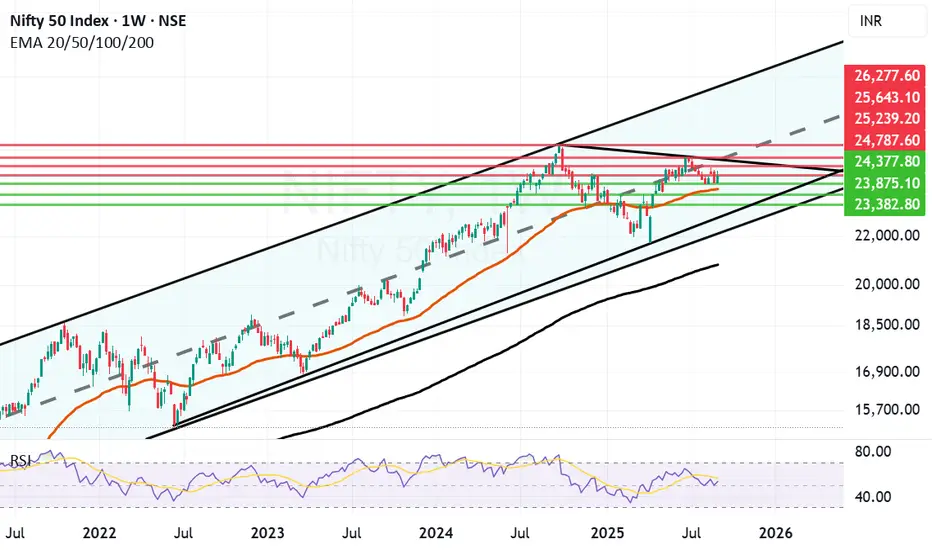
The long to medium term support for Nifty are at: 24377, 24105 (Very very strong 50 weeks Mother Line support), 23875 and finally 23382 (Long term trend line support). Below this level Nifty will become very very week.
The long to medium term resistances for Nifty remain at: 24787, 25239, 25643 (Trend line Resistance), 26277 (All Time High Resistance).
On one side we have GST reforms which are trying to propel market upwards and on the other side we have Trump Tariffs and threats pushing market down. The market poised for more volatility and possible further sectoral shifts if they are not evident already. Consumption, Auto, FMCG sectors and other companies where supply chain to end product all have indic fervor will be in further demand.
Disclaimer: The above information is provided for educational purpose, analysis and paper trading only. Please don't treat this as a buy or sell recommendation for the stock or index. The Techno-Funda analysis is based on data that is more than 3 months old. Supports and Resistances are determined by historic past peaks and Valley in the chart. Many other indicators and patterns like EMA, RSI, MACD, Volumes, Fibonacci, parallel channel etc. use historic data which is 3 months or older cyclical points. There is no guarantee they will work in future as markets are highly volatile and swings in prices are also due to macro and micro factors based on actions taken by the company as well as region and global events. Equity investment is subject to risks. I or my clients or family members might have positions in the stocks that we mention in our educational posts. We will not be responsible for any Profit or loss that may occur due to any financial decision taken based on any data provided in this message. Do consult your investment advisor before taking any financial decisions. Stop losses should be an important part of any investment in equity.
Nifty levels - Sep 08, 2025Nifty support and resistance levels are valuable tools for making informed trading decisions, specifically when combined with the analysis of 5-minute timeframe candlesticks and VWAP. By closely monitoring these levels and observing the price movements within this timeframe, traders can enhance the accuracy of their entry and exit points. It is important to bear in mind that support and resistance levels are not fixed, and they can change over time as market conditions evolve.
The dashed lines on the chart indicate the reaction levels, serving as additional points of significance to consider. Furthermore, take note of the response at the levels of the High, Low, and Close values from the day prior.
We hope you find this information beneficial in your trading endeavors.
* If you found the idea appealing, kindly tap the Boost icon located below the chart. We encourage you to share your thoughts and comments regarding it.
Wishing you success in your trading activities!

Currency Wars & Competitive Devaluation1. Understanding Currency Wars
1.1 Definition
A currency war refers to a situation in which countries intentionally manipulate their exchange rates to gain trade advantages. This is usually done by keeping their currency undervalued against major global currencies (such as the US Dollar or Euro), making their exports cheaper and imports more expensive.
1.2 Difference between Normal Exchange Rate Policies and Currency Wars
Normal Exchange Rate Adjustments: Countries may let market forces or monetary policy determine currency values based on economic fundamentals.
Currency Wars: Deliberate interventions—such as excessive printing of money, cutting interest rates aggressively, or directly buying foreign currencies—to weaken domestic currency beyond fundamentals.
1.3 Why Nations Engage in Currency Wars
Boost Exports: Cheaper currency makes exports more competitive.
Reduce Imports: Costlier imports encourage domestic consumption.
Stimulate Growth: Export-led growth can help recover from recessions.
Tackle Deflation: Weak currency raises import prices, generating inflation.
2. Competitive Devaluation
2.1 Definition
Competitive devaluation occurs when multiple countries sequentially lower the value of their currencies in response to each other’s actions. It’s essentially a “race to the bottom,” where no one wins in the long run, but everyone suffers from instability.
2.2 Mechanisms of Devaluation
Monetary Policy Tools: Central banks reduce interest rates or engage in quantitative easing (printing money).
Foreign Exchange Interventions: Governments or central banks sell domestic currency and buy foreign reserves.
Capital Controls: Restrictions on inflows/outflows to maintain currency depreciation.
2.3 Historical Perspective of Competitive Devaluation
1930s Great Depression: Countries abandoned the gold standard and devalued currencies to boost exports.
1970s Bretton Woods Collapse: Exchange rate system breakdown triggered currency adjustments.
2008 Financial Crisis Aftermath: The US, Japan, and emerging economies engaged in aggressive monetary easing.
3. Historical Episodes of Currency Wars
3.1 The Great Depression (1930s)
Many countries abandoned the gold standard to devalue their currencies.
The US devalued the dollar under Roosevelt, while the UK left the gold standard in 1931.
This created a spiral of competitive devaluations, worsening global economic tensions.
3.2 Bretton Woods System Collapse (1971)
After World War II, the Bretton Woods system pegged currencies to the US dollar.
In 1971, the Nixon Shock ended dollar-gold convertibility.
Currencies began floating, leading to sharp adjustments and devaluations.
3.3 Plaza Accord (1985)
The US dollar had appreciated significantly, hurting American exports.
G5 nations (US, Japan, UK, France, West Germany) agreed to weaken the dollar.
A coordinated effort prevented disorderly currency competition.
3.4 Post-2008 Financial Crisis
The US Federal Reserve launched quantitative easing (QE), weakening the dollar.
Emerging markets like Brazil accused the US of starting a “currency war.”
Japan’s Abenomics policy in 2012–13 was also criticized as competitive devaluation.
4. Tools and Strategies of Currency Wars
4.1 Monetary Policy Tools
Lowering Interest Rates: Reduces returns for investors, weakening currency.
Quantitative Easing (QE): Increases money supply, pressuring currency downward.
4.2 Direct Interventions
Central banks buy foreign currencies (e.g., US dollars, euros) to push domestic currency lower.
Example: China’s PBoC interventions to keep the yuan undervalued.
4.3 Trade and Fiscal Measures
Export subsidies or import tariffs indirectly support devaluation effects.
Capital controls prevent appreciation from foreign investment inflows.
4.4 Communication & Market Signals
Central banks sometimes issue statements signaling dovish policies to influence expectations.
5. Impact of Currency Wars
5.1 Positive Effects (Short-Term)
Boosts Exports: Domestic products become cheaper abroad.
Supports Growth: Export-led demand revives economies.
Manages Deflation: Import inflation helps economies facing deflation.
5.2 Negative Effects (Long-Term)
Retaliation: Other countries devalue, nullifying initial benefits.
Inflationary Pressure: Rising import prices fuel inflation.
Loss of Investor Confidence: Sudden devaluations deter foreign investors.
Trade Tensions: Devaluation leads to accusations of currency manipulation.
Global Instability: Competitive devaluation creates uncertainty in capital flows.
6. Case Studies of Currency Wars
6.1 The US and China
The US has long accused China of keeping the yuan undervalued.
This helped China’s export-led growth model, but created global imbalances.
The 2019 US-China trade war also had a currency dimension, with the yuan weakening.
6.2 Japan’s Abenomics (2012–2013)
Japan used aggressive monetary easing to weaken the yen.
This helped Japanese exports but attracted criticism from trading partners.
6.3 Emerging Market Economies
Countries like Brazil, India, and South Korea faced currency inflows due to US QE.
To protect domestic industries, they intervened to curb currency appreciation.
7. Role of International Institutions
7.1 International Monetary Fund (IMF)
Monitors exchange rate policies.
Can label a country a “currency manipulator” if it deliberately undervalues its currency.
Provides a platform for coordination to avoid competitive devaluations.
7.2 G20 and G7
Forums where countries pledge to avoid competitive devaluation.
Example: G20 statement in 2013 against currency wars.
8. Theoretical Perspectives
8.1 Beggar-Thy-Neighbor Policy
Currency wars are a form of “beggar-thy-neighbor” policy—where one nation’s gain (through exports) comes at another’s expense.
8.2 Game Theory and Currency Wars
Each country has an incentive to devalue, but if all devalue, everyone loses.
This creates a prisoner’s dilemma in international economics.
9. Currency Wars in the 21st Century
9.1 Digital Currencies and Devaluation
Central Bank Digital Currencies (CBDCs) could alter how nations influence exchange rates.
Competition among digital currencies may add new layers to currency wars.
9.2 Geopolitics and Sanctions
The US dollar’s dominance gives the US leverage through sanctions.
Countries like Russia and China promote alternatives (yuan, ruble, gold).
9.3 Post-COVID Era
Pandemic recovery led to massive stimulus and QE across the world.
The risk of currency tensions resurfaced as nations pursued divergent recovery paths.
10. Preventing Currency Wars
10.1 Coordination through Global Forums
Stronger cooperation at IMF, G20, WTO levels can reduce unilateral actions.
10.2 Transparent Monetary Policies
Clear communication by central banks helps avoid misinterpretation of currency intentions.
10.3 Diversified Global Reserve System
Reducing dependence on the US dollar could limit imbalances.
10.4 Regional Currency Agreements
Like the Eurozone, regional cooperation may prevent internal currency competition.
Conclusion
Currency wars and competitive devaluation are complex phenomena that reveal the deep interconnectedness of global economies. While weakening a currency may bring short-term benefits in terms of exports and growth, the long-term consequences often outweigh the advantages. Retaliatory actions, inflationary pressures, trade tensions, and financial instability make currency wars a dangerous economic strategy.
In today’s globalized world, where supply chains and financial markets are deeply integrated, no country can devalue its way to prosperity without harming others. The challenge, therefore, lies in balancing domestic economic needs with global stability. International cooperation, transparency in monetary policies, and reforms in global financial governance remain essential to preventing destructive cycles of competitive devaluation.
Currency wars are, in essence, economic battles without winners. History shows us that the path of cooperation, not confrontation, leads to sustainable prosperity.
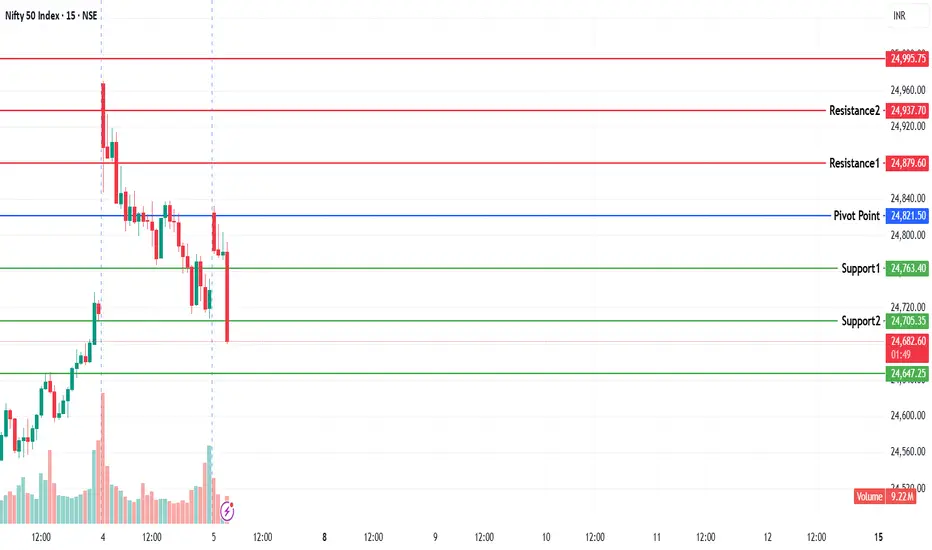
NIFTY KEY LEVELS FOR 05.09.2025NIFTY KEY LEVELS FOR 05.09.2025
RTF: 3 Minutes
If the candle stays above the pivot point, it is considered a bullish bias; if it remains below, it indicates a bearish bias. Price may reverse near Resistance 1 or Support 1. If it moves further, the next potential reversal zone is near Resistance 2 or Support 2. If these levels are also broken, we can expect the trend.
If the range(R2-S2) is narrow, the market may become volatile or trend strongly. If the range is wide, the market is more likely to remain sideways
📢 Disclaimer
I am not a SEBI-registered financial adviser.
The information, views, and ideas shared here are purely for educational and informational purposes only. They are not intended as investment advice or a recommendation to buy, sell, or hold any financial instruments.
Please consult with your SEBI-registered financial advisor before making any trading or investment decisions.
Trading and investing in the stock market involves risk, and you should do your own research and analysis. You are solely responsible for any decisions made based on this research.
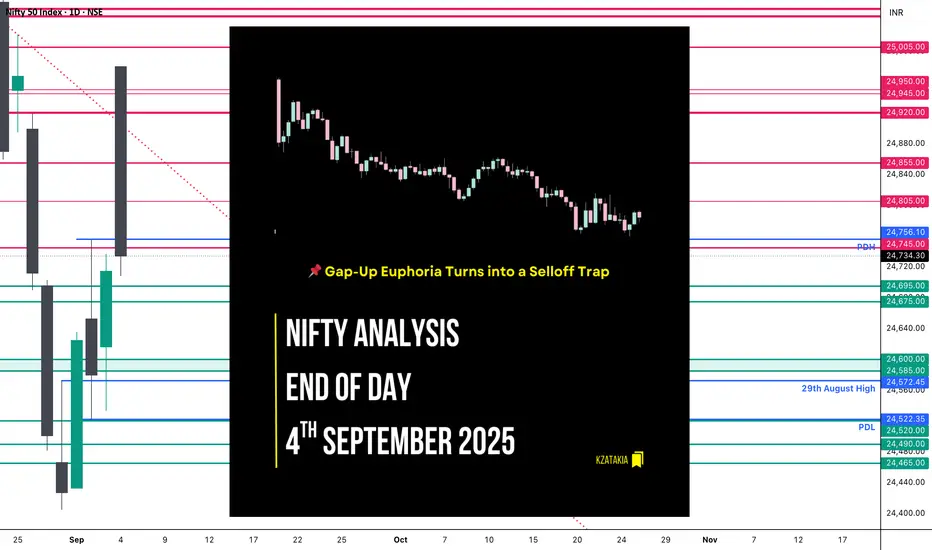
Nifty Analysis EOD – September 4, 2025 – Thursday🟢 Nifty Analysis EOD – September 4, 2025 – Thursday 🔴
📌 Gap-Up Euphoria Turns into a Selloff Trap
🗞 Nifty Summary
A news-driven opening saw Nifty gap up by 254 points at 24,970, immediately triggering all upside targets from the prior day’s Inside Bar pattern. But the euphoria didn’t last long—profit booking hit in the very first 5 minutes. By 10 AM, once the IB Low broke, selling intensified and the index never even tested VWAP for the rest of the session.
Despite intraday swings of over 230 points from high to close, the index managed to end almost flat at 24,739.80 (+26 pts)—back to square one. Yesterday was about a bottom reversal; today screamed rejection at higher levels. The mixed signals leave direction uncertain.
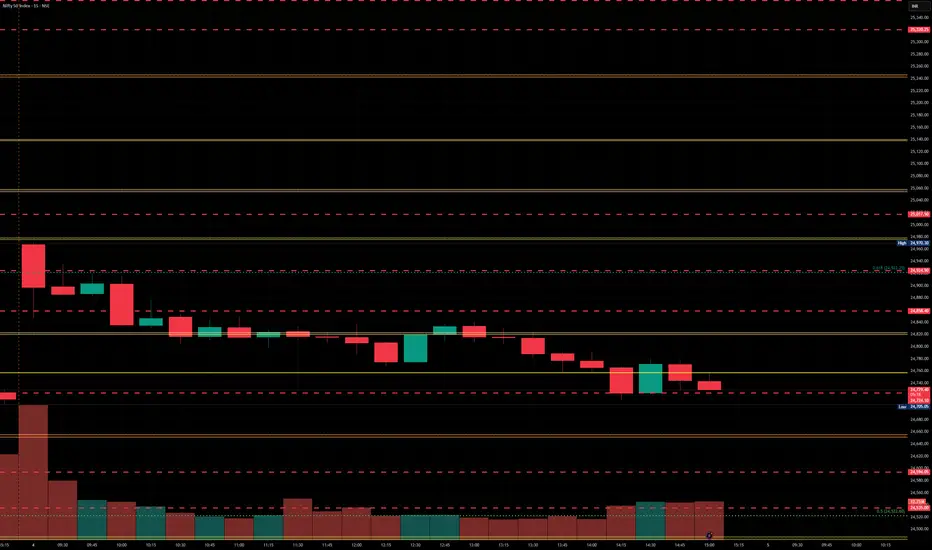
🛡 5 Min Intraday Chart with Levels
📉 Daily Time Frame Chart with Intraday Levels
🕯️ Daily Candle Breakdown
Open: 24,980.75
High: 24,980.75
Low: 24,708.20
Close: 24,734.30
Change: +19.25 (+0.08%)
🏗️ Structure Breakdown
Red candle (Close < Open) despite being marginally positive vs. yesterday.
Body: 246.45 points → large bearish body.
Upper wick: 0 (open = high).
Lower wick: 26.10 points → very small.
🕯Candle Type
Bearish Marubozu (Gap-Up Failure) → supply rejection at upper zone.
📚 Interpretation
Sharp gap-up faded instantly—a textbook bull trap.
Relentless intraday selling pressure; buyers weakly defended lows.
Closing just above key support keeps the tug-of-war alive, but momentum favors sellers.
🔍 Short-Term View – September 5, 2025
Resistance: 24,980–25,000 (failed breakout zone).
Support: 24,700 (tested today, critical).
👉 In short: Today marks exhaustion at the top. Unless Nifty reclaims 24,980–25,000, the risk of sliding back toward 24,600–24,520 remains high.
🛡 5 Min Intraday Chart
⚔️ Gladiator Strategy Update
ATR: 211.71
IB Range: 123.05 → Medium
Market Structure: Imbalanced
Trade Highlights: No trade triggered today.
📌 Support & Resistance Levels
Resistance Zones:
24,740 ~ 24,760
24,805
24,855
24,900 ~ 24,920
Support Zones:
24,695 ~ 24,675
24,600 ~ 24,585
24,520
24,490 ~ 24,465
💡 Final Thoughts
The market teased the bulls with a powerful gap-up, only to hand the reins to sellers. This kind of gap-up failure is often a strong reversal signal. For now, traders should respect the 24,700 support zone—break it, and the downside may accelerate.
📖 “Markets don’t reward euphoria; they test conviction.”
✏️ Disclaimer
This is just my personal viewpoint. Always consult your financial advisor before taking any action.
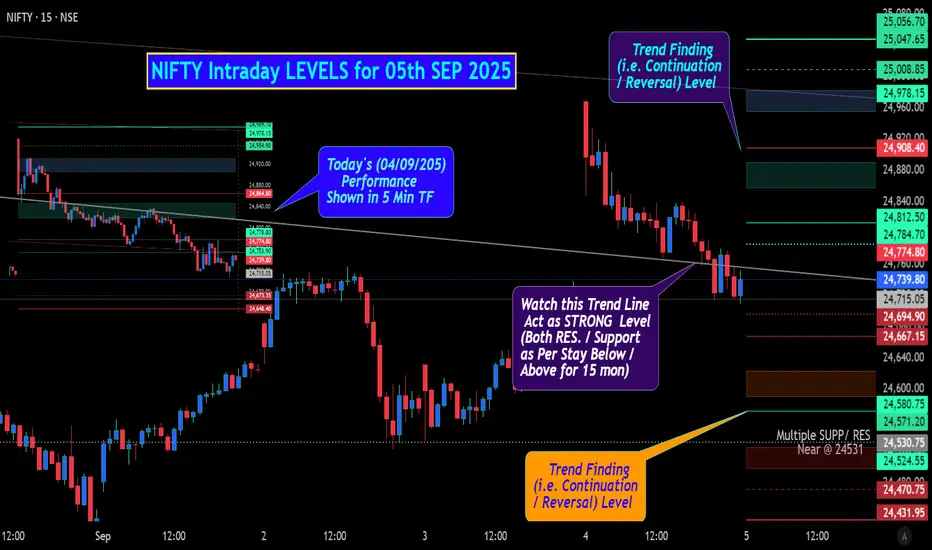
NIFTY Intraday Level for 05th SEP 2025All Plotted and Mentioned on Chart.
Color code:
Green =. Positive bias.
Red =. Negative bias.
RED in Between Green means Trend Finder / Momentum Change
/ CYCLE Change and Vice Versa.
Notice One thing: HOW LEVELS are Working.
Use any Momentum Indicator / Oscillator or as you "USED to" to Take entry.
Disclaimer: Study Purpose only.
After good start Nifty fizzles under trend line + Trump PressureAfter the announcements of GST reforms Nifty started the day with the bang reaching 24980 just short of 25K but selling pressure came immediately after Nifty hit the trend line resistance. Also Bears took the advantage of the rally to short the Nifty on account of Trump's fresh salvo of further increasing Tariffs on India in phase 2 and phase 3. The results of GST reforms will shortly start showing within a quarter or 2. The FMCG, Auto, Auto ancillaries, Insurance and health care, Consumption, Infrastructure and to some extent Capital Goods, Home appliances, Travel and Holiday will definitely get a boost in the long run.
It is not easy to close above Father line resistance if you have read my Mother Father and Small child theory you know that. If not you can read my book THE HAPPY CANDLES WAY TO WEALTH CREATION. The book is available on Amazon and is one of the highest rated books in the category.
Resistance for Nifty remain at: 24781 (Father line resistance), 24880, 24980 (Trend line resistance), 25081 and 25172. (Above this level Bulls will become more active).
Supports for Nifty remain at: 24700 (Mother line support), 24660 (Trend line support), 24515, 24397 and finally 24339 (Below this support there will be total bear grip).
Disclaimer: The above information is provided for educational purpose, analysis and paper trading only. Please don't treat this as a buy or sell recommendation for the stock or index. The Techno-Funda analysis is based on data that is more than 3 months old. Supports and Resistances are determined by historic past peaks and Valley in the chart. Many other indicators and patterns like EMA, RSI, MACD, Volumes, Fibonacci, parallel channel etc. use historic data which is 3 months or older cyclical points. There is no guarantee they will work in future as markets are highly volatile and swings in prices are also due to macro and micro factors based on actions taken by the company as well as region and global events. Equity investment is subject to risks. I or my clients or family members might have positions in the stocks that we mention in our educational posts. We will not be responsible for any Profit or loss that may occur due to any financial decision taken based on any data provided in this message. Do consult your investment advisor before taking any financial decisions. Stop losses should be an important part of any investment in equity.

Nifty - Sept 2025Nifty shows continued bearishness for September, and a prudent study-based plan could be:
Sell: 24,500
Target 1: 24,150
Target 2: 23,950
Target 3: 23,775
Stop loss: Tight stop loss above entry. Cut the position completely above 24765-24780 zone on hourly basis
This setup is for study purposes only, not trading advice.

Nifty levels - Sep 05, 2025Nifty support and resistance levels are valuable tools for making informed trading decisions, specifically when combined with the analysis of 5-minute timeframe candlesticks and VWAP. By closely monitoring these levels and observing the price movements within this timeframe, traders can enhance the accuracy of their entry and exit points. It is important to bear in mind that support and resistance levels are not fixed, and they can change over time as market conditions evolve.
The dashed lines on the chart indicate the reaction levels, serving as additional points of significance to consider. Furthermore, take note of the response at the levels of the High, Low, and Close values from the day prior.
We hope you find this information beneficial in your trading endeavors.
* If you found the idea appealing, kindly tap the Boost icon located below the chart. We encourage you to share your thoughts and comments regarding it.
Wishing you success in your trading activities!
NIFTY FIFTY INDEXYou can see I draw some zones ,in my analyses this is what can be nifty 50 next moves

NIFTY BUYING ZONEnifty made higher high now coming down to make new higher low
selling is slow multiple times buying coming at correction is good sign of reversal.

Global Supply Chain Challenges1. Complexity and Interdependence
One of the biggest challenges of global supply chains is their complexity. Unlike traditional domestic supply chains where most processes are localized, global supply chains involve:
Multiple countries producing different components.
Long transportation routes across oceans and continents.
Coordination among suppliers, manufacturers, warehouses, and retailers.
Dependence on international trade regulations and customs.
For instance, a single smartphone may include rare earth minerals from Africa, semiconductors from Taiwan, assembly in China, and distribution worldwide. If one link fails—say, a port strike in the U.S. or a political dispute in Asia—the entire chain suffers delays and shortages.
This high interdependence means companies cannot operate in isolation. A disruption in one country cascades globally, making supply chain resilience a top concern for businesses.
2. Geopolitical Risks
Geopolitical tensions have always influenced global trade, but recent years have seen an escalation in conflicts that directly impact supply chains:
Trade Wars: The U.S.-China trade war led to tariffs on hundreds of billions worth of goods, forcing companies to rethink their sourcing strategies.
Sanctions and Restrictions: Sanctions on countries like Russia and Iran disrupt the supply of vital energy resources and raw materials.
Conflicts and Wars: The Russia-Ukraine war has severely disrupted grain and energy supplies, causing ripple effects worldwide.
Rising Nationalism: Many countries are moving toward “protectionism,” encouraging local manufacturing instead of relying on imports.
These risks make global supply chains unpredictable. Companies are increasingly exploring China+1 strategies (diversifying production beyond China) and regional supply chain models to reduce exposure.
3. Transportation and Logistics Bottlenecks
The efficient movement of goods is critical for supply chains, but several issues plague the global logistics industry:
Port Congestion: Major ports such as Los Angeles, Shanghai, and Rotterdam often face severe backlogs, delaying shipments for weeks.
Container Shortages: The COVID-19 pandemic revealed imbalances in container availability, as containers got stuck in regions with low exports.
Rising Freight Costs: Shipping costs have skyrocketed in recent years, sometimes increasing fivefold, which directly affects product pricing.
Infrastructure Limitations: Developing countries often lack efficient road, rail, and port infrastructure, adding delays.
Disruptions in Key Routes: Blockages like the 2021 Suez Canal crisis showed how a single incident can paralyze global trade.
Logistics providers are adopting digital tracking, automation, and AI-driven route optimization to address these challenges, but the issues remain significant.
4. Climate Change and Natural Disasters
Climate change has emerged as a critical threat to supply chain stability. Extreme weather events disrupt production, transportation, and distribution. Examples include:
Flooding in Thailand (2011) that severely impacted global electronics and automotive supply chains.
Hurricanes in the U.S. causing oil refinery shutdowns and fuel shortages.
Wildfires in Australia and California disrupting agricultural production.
Moreover, climate change brings regulatory challenges. Many countries are now implementing carbon border taxes, demanding cleaner supply chains. Companies must invest in sustainability—using renewable energy, reducing emissions, and adopting circular economy models—while still managing costs.
5. Pandemics and Health Crises
The COVID-19 pandemic exposed the fragility of global supply chains like never before. Lockdowns, labor shortages, and border closures created massive disruptions:
Factories shut down, halting production of critical goods.
Global demand patterns shifted (e.g., rise in demand for PPE and semiconductors).
Transportation capacity was severely limited.
Panic buying and hoarding caused shortages of essentials.
Even post-pandemic, supply chains continue to struggle with aftershocks—semiconductor shortages, rising e-commerce demand, and workforce restructuring. This has led companies to explore resilient supply chain models focusing on agility, redundancy, and digital monitoring.
6. Labor and Workforce Challenges
Global supply chains rely heavily on human labor at every stage—manufacturing, warehousing, shipping, and retail. However, several issues create challenges:
Labor Shortages: Many industries, particularly trucking and shipping, face chronic labor shortages.
Poor Working Conditions: Sweatshops, low wages, and unsafe working environments create ethical concerns.
Union Strikes: Port worker or factory strikes can halt production for weeks.
Skill Gaps: The shift to digital technologies requires skilled workers in areas like data analytics and AI, but there is a global shortage of such talent.
Companies must invest in workforce development, automation, and fair labor practices to ensure long-term stability.
7. Supply Chain Visibility and Transparency
One of the toughest challenges is the lack of visibility across complex supply chains. Many companies only know their first-tier suppliers but have little knowledge of second- or third-tier suppliers. This lack of transparency creates risks in:
Identifying bottlenecks.
Ensuring compliance with regulations.
Tracking unethical practices such as forced labor or environmental harm.
Digital technologies like blockchain, IoT sensors, and AI analytics are increasingly being used to improve visibility and traceability. However, implementing these systems across global networks is expensive and time-consuming.
8. Cybersecurity Risks
As supply chains become digitized, they are also exposed to cyber threats. Cyberattacks on logistics firms, shipping companies, and manufacturers can cripple operations. For example:
The Maersk cyberattack (2017) disrupted global shipping for weeks.
Ransomware attacks on manufacturing plants caused production halts.
Data breaches expose sensitive supplier and customer information.
Securing global supply chains requires strong cybersecurity protocols, international cooperation, and investment in resilient IT systems.
9. Regulatory and Compliance Challenges
Operating across multiple countries means companies must navigate a complex web of laws and regulations:
Customs Regulations: Varying import-export rules increase costs and delays.
Environmental Laws: Stricter sustainability standards demand cleaner processes.
Product Standards: Different countries have different quality and safety requirements.
Data Protection Laws: With digital trade, compliance with laws like GDPR adds complexity.
Failure to comply can result in fines, reputational damage, and disrupted operations.
10. Rising Costs and Inflation
Another major challenge is the rising cost of operating global supply chains:
Raw Materials: Prices of commodities such as oil, metals, and agricultural products fluctuate widely.
Transportation: Higher fuel costs and freight rates directly impact profitability.
Labor Costs: Wages are rising in traditional manufacturing hubs like China, pushing companies to explore alternatives such as Vietnam and India.
Inflation: Global inflation reduces consumer demand, making supply chains less predictable.
Companies are balancing cost efficiency with resilience—sometimes choosing more expensive but reliable regional sourcing models.
Conclusion
Global supply chains are both the strength and vulnerability of the modern economy. While they enable efficiency, affordability, and innovation, they are also highly exposed to risks—geopolitical, environmental, technological, and social. The challenges are vast and interconnected, meaning solutions require not just corporate strategies but also international cooperation, regulatory reforms, and technological innovation.
In the coming decades, the most successful supply chains will be those that balance cost, resilience, and sustainability. They will not just deliver products efficiently but also adapt quickly to disruptions, respect environmental standards, and uphold ethical values. The challenges are immense, but they also offer opportunities to build stronger, smarter, and more sustainable global supply networks.

NIFTY Outlook 9/3/2025A push above 24,720 today, clearing the 9SMA, sets up a retest of 24,800 (0.5 level). From there, a downside push with increasing volume would confirm the downtrend continuation within the descending triangle. Failure to push down from 24,800 could lead to 24,900, invalidating the descending triangle and signaling a trend reversal, especially if the move above 9SMA holds with conviction.
The descending triangle suggests bearish continuation. A brief push above 24,720 and 9SMA to retest 24,800 could be a bull trap, with volume confirming the downtrend resumption.
"This is not financial advice. Trading involves significant risk of loss; conduct your own research."
