Nifty 50: Shows reversal before hitting the support of 24300
Nifty 50: Shows reversal before hitting the support of 24300
( Not a Buy / Sell Recommendation
Do your own due diligence ,Market is subject to risks, This is my own view and for learning only .)
NIFTY trade ideas

NIFTY50....Wave iv complete?Hello Traders,
the NIFTY50 has probably complete a wave iii of lower degree.
It closed the day @ 24625. In contrast of a wave ii, that has lasted for one day also, this wave could be complete.
In this case, the next move should occurr to the downside and complete a wave v! Targets are still valid and have been published yesterday!
If this move instead was all of the correction, it should start a new advance and create possibly new high's above 25153 on August 21th.
While the move for now looks like a "three-down" I await another wave to the downside to accomplishe a "five-down"!
So friends, that's it for a quick note today.
Have a great week.....
Ruebennase
Please ask or comment as appropriate.
Trade on this analysis at your own risk.

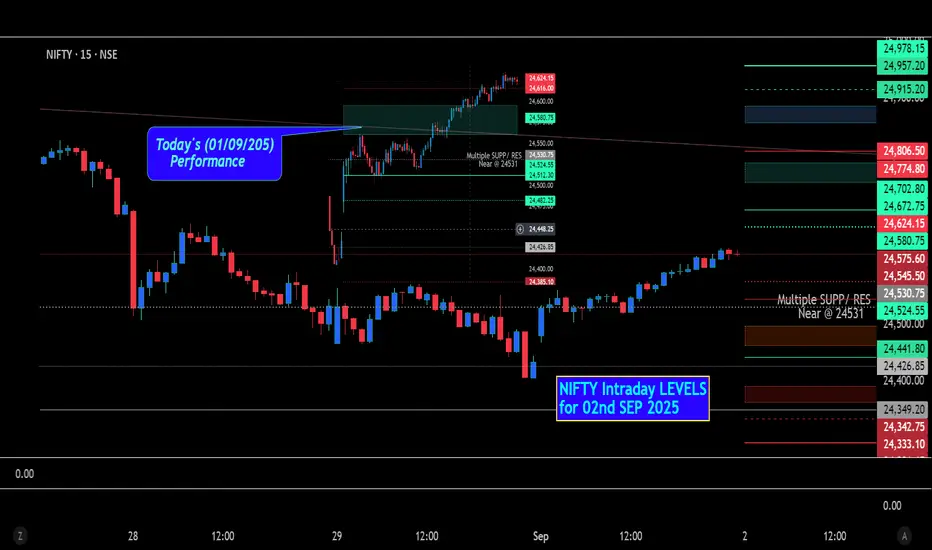
NIFTY Intraday Level for 02nd SEP 2025All Plotted and Mentioned on Chart.
Colour code:
Green =. Positive bias.
Red =. Negative bias.
RED in Between Green means T rend Finder / Momentum Change
/ CYCLE Change and Vice Versa.
Notice One thing: HOW LEVELS are Working.
Use any Momentum Indicator / Oscillator as USED to to Take entry.
Disclaimer: Study Purpose only.
Nifty levels - Sep 02, 2025Nifty support and resistance levels are valuable tools for making informed trading decisions, specifically when combined with the analysis of 5-minute timeframe candlesticks and VWAP. By closely monitoring these levels and observing the price movements within this timeframe, traders can enhance the accuracy of their entry and exit points. It is important to bear in mind that support and resistance levels are not fixed, and they can change over time as market conditions evolve.
The dashed lines on the chart indicate the reaction levels, serving as additional points of significance to consider. Furthermore, take note of the response at the levels of the High, Low, and Close values from the day prior.
We hope you find this information beneficial in your trading endeavors.
* If you found the idea appealing, kindly tap the Boost icon located below the chart. We encourage you to share your thoughts and comments regarding it.
Wishing you success in your trading activities!

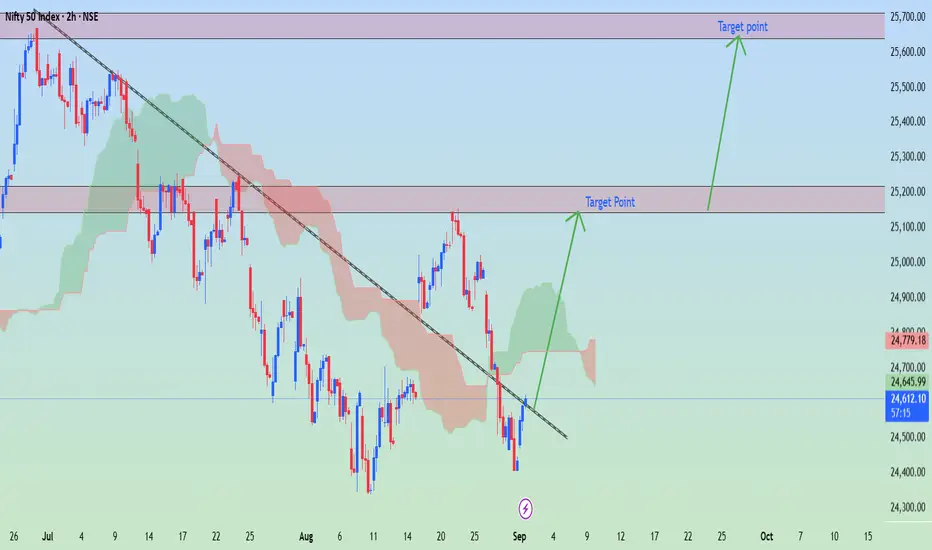
NIFTY 50 Index (2H timeframe) ..NIFTY 50 Index (2H timeframe)
---
Current Market Context
Instrument: NIFTY 50 Index (NSE)
Current Price: ~24,709
Trend: Recently bounced from a support zone after a downtrend.
Indicators: Price is trying to recover above the Ichimoku cloud and has broken a short-term descending trendline.
---
Targets Marked on my Chart
1. First Target Zone: 25,150 – 25,200
This is the immediate resistance / supply zone.
Likely to be tested first on bullish continuation.
2. Second Target Zone: 25,550 – 25,600
This is the extended bullish target.
It aligns with the next major resistance zone marked in your chart.
---
Trade Idea
Entry Zone: Around 24,700 – 24,750 (current levels).
Take Profit 1: ~25,150 – 25,200.
Take Profit 2: ~25,550 – 25,600.
Stop Loss: Below recent swing low (~24,500).
---
⚠ Note: NIFTY moves strongly with global cues and India’s market data. If bulls fail to hold above 24,500, bearish pressure could resume.
Market trendThis is my practice chart for Smart Money Concepts (SMC).
📌 Key focus areas:
- Market Structure (HH, HL, LH, LL)
- CHoCH (Change of Character) and BoS (Break of Structure)
- Liquidity pools (equal highs/lows zones)
- Order Blocks (OB) and Fair Value Gaps (FVG)
- Supply & Demand Zones
- Premium / Discount levels
I am publishing this chart to analyze trend bias and to learn how institutional concepts apply in real-time on the Nifty 50 (5 minute timeframe).
Disclaimer: Educational purpose only, not financial advice.

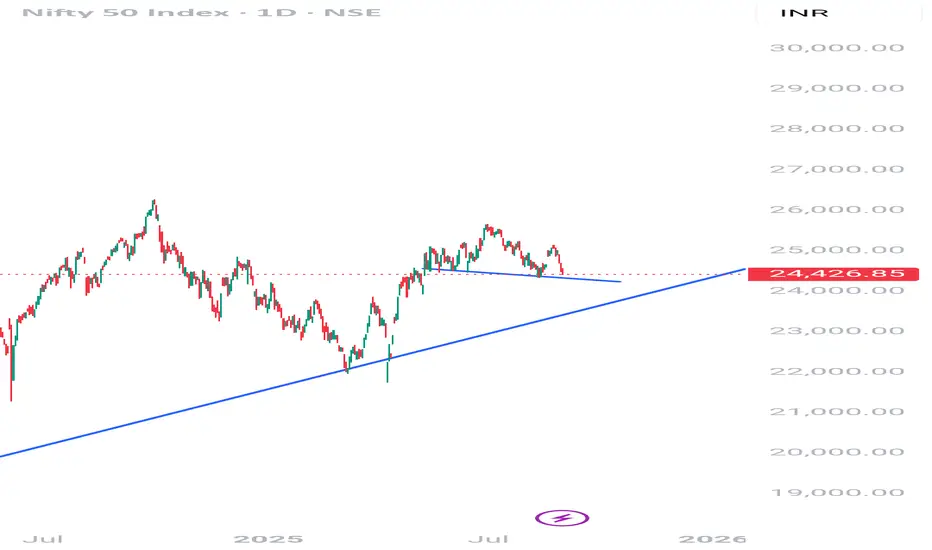
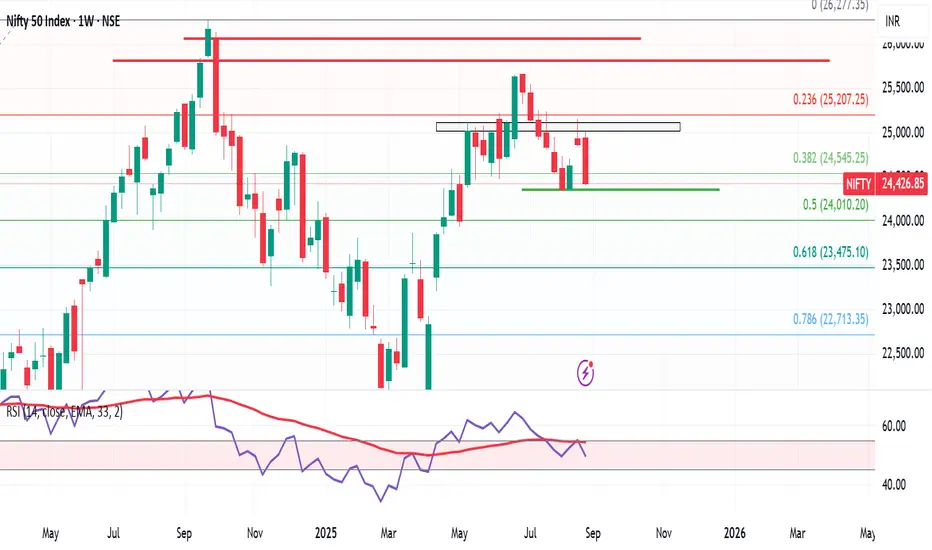
Nifty Weekly chart - in Making of Inverted Head and Shoulder Disclaimer : Do your own research before investing. This is just a chart analysis. No recommendation to buy and sell.
Nifty is in making of Inverted head and Shoulder pattern on Weekly Chart.
CMP is Rs. 24560/- On the upper side it can go upto Rs.26000/- and lower side can go upto Rs. 23000.

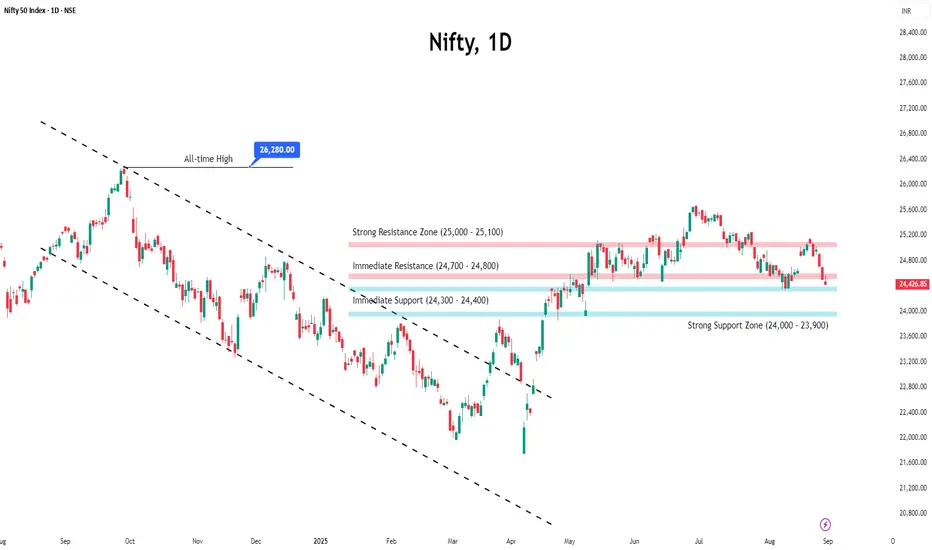
Nifty Maintains Bullish Trend, Eyes Higher TargetsNifty Maintains Bullish Trend, Eyes Higher Targets
The Nifty index continues to trade within a strong bullish market structure, characterized by higher highs and higher lows, indicating sustained upward momentum. The index is currently hovering near a crucial support level, which has historically acted as a springboard for further rallies. As long as this support holds, the overall trend remains firmly bullish, with expectations of another upward push in the coming sessions.
On the higher side, the next key target for the Nifty is 25,600, a level that could attract profit-taking if reached but may also act as a psychological resistance. A decisive breakout above this zone could open the doors for even higher levels, reinforcing the bullish dominance. Traders should watch for follow-through buying momentum to confirm the continuation of the uptrend.
On the downside, 24,500 is a critical support level that must hold to maintain the bullish structure. A dip towards this zone could present a buying opportunity, as long as the price does not close below it. A breach of this support, however, could signal a short-term correction or consolidation phase before the next directional move.
Given the current technical setup, the bias remains in favor of the bulls, with dip-buying strategies likely to prevail. Traders should monitor price action around the key levels mentioned, as they will determine whether the uptrend extends or faces a temporary pause. Overall, the Nifty's bullish trend remains intact, with 25,600 as the next major target and 24,500 serving as a crucial support to watch.

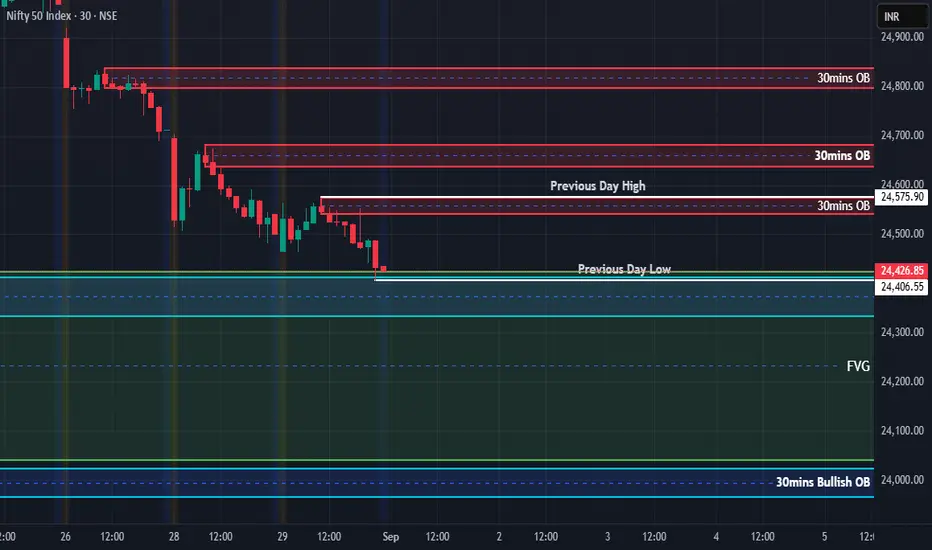
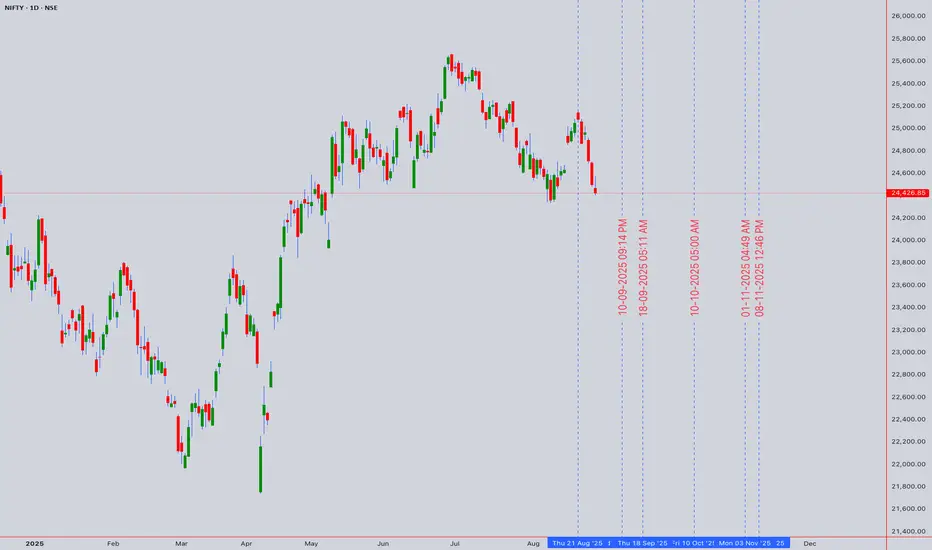
Nifty Analysis for 01-09-2025Chart Breakdown: Current Price: ~24,426.85 (just below Previous Day Low).
Key Levels:
Immediate Resistance Zones (30-min OBs):
24,575 (PDH zone)
24,700–24,800 (stronger OB).
Support Zones:
Previous Day Low (PDL): 24,426
Discount Zone / FVG: 24,300 → 24,200
Major 30-min Bullish OB: ~24,000
Market Structure:
Multiple BOS (Break of Structure) down moves → bearish structure confirmed.
Price is trading below PDH & PDL, showing weakness.
Next liquidity magnet = FVG 24,300–24,200.
Interpretation
Price is in a bearish order flow, creating lower highs and breaking lows.
PDL already tested → weak support, risk of continuation down.
FVG (24,300–24,200) is the natural downside target in the short term.
24,000 OB remains the most important demand zone for reversal.
Scenarios
Bearish Continuation (Most Likely Near Term):
If 24,426 (PDL) breaks clean → quick slide into 24,300–24,200 FVG.
If selling accelerates → test of 24,000 OB.
Bullish Reversal Case:
If 24,426 holds & market reclaims PDH (~24,575) → could trigger short covering.
Targets: 24,700 → 24,800 OB.
Only strong close above 24,800 negates bearish structure.
Neutral/Range Case:
If stuck between 24,426–24,575 → chop zone, liquidity building before big move.
My Perspective
Bias: Bearish to sideways, unless 24,575 is reclaimed.
Expect FVG fill to 24,200 in the short run.
24,000 OB will decide whether bulls regain control or if deeper correction (23,600–23,200 gap) opens up.
Suggested Trading Approach:
Short-term shorts below 24,426 → target 24,300–24,200.
Aggressive longs only from 24,000 OB with confirmation (candle reversal / demand reaction).
Avoid longs in the middle zone (24,400–24,500) since structure favors sellers.
NIFTY KEY LEVELS FOR 01.09.2025NIFTY KEY LEVELS FOR 01.09.2025
RTF: 3 Minutes
If the candle stays above the pivot point, it is considered a bullish bias; if it remains below, it indicates a bearish bias. Price may reverse near Resistance 1 or Support 1. If it moves further, the next potential reversal zone is near Resistance 2 or Support 2. If these levels are also broken, we can expect the trend.
If the range(R2-S2) is narrow, the market may become volatile or trend strongly. If the range is wide, the market is more likely to remain sideways
📢 Disclaimer
I am not a SEBI-registered financial adviser.
The information, views, and ideas shared here are purely for educational and informational purposes only. They are not intended as investment advice or a recommendation to buy, sell, or hold any financial instruments.
Please consult with your SEBI-registered financial advisor before making any trading or investment decisions.
Trading and investing in the stock market involves risk, and you should do your own research and analysis. You are solely responsible for any decisions made based on this research.

Pattern in NiftyNifty 50 showing bearish signals, it may reverse from here or else if it breaks the head and shoulder pattern a nice selling may come, this is a no trade zone for me , it is also following global trade wars.
NIFTY50..... No news to report!Hello Traders,
the NIFTY50 has closed the week with a loss of 443.25 points, or 1.78%!
It dropped back into the sky blue rectangle I have drew at chart. Please note that I have left the forecast arrow unchanged.
Chart analysis:
In my view, is a drop into the retracements to favor. If the low of 24317.55 will be undercut, the door would be open to ~24K area!
Short term, a drop to around 24260 range would be possible, before a wave iv could start. But this is not for sure!
My personal argument is following. Before a "sell-off" hasn't occurred, the downtrend is valid. It needs a gap-down or a dramatic
"sell-off" in the coming days/weeks to end this correction. As I told before: The longer a correction takes to happen, the more severe it will be. That is exactly what we are experiencing now!
While it takes an advance move above the 24991 area to start a new impulsive structure, this is not something that I would wait for.
Seasonally the time is "textbook-like" for a corrective phase off the year and this is what I speculate on!
Ok, the Investors who only trade n a "daily-close" basis should sell their stocks/option on Monday! After they did, a countertrend move to the upside could be possible. After, a decline again is in the cards. This is the "game" big money is playing right now!
So, be prepared for the unexpected and wait for clear structures and the chance to fill the Christmas money box!
That's it for the weekend.
There probably will be no forecast at the coming weekend, 'cause of a short trip for some days. I am offline!
Have a great week.....
Ruebennase
Please ask or comment as appropriate.
Trade on this analysis at your own risk.

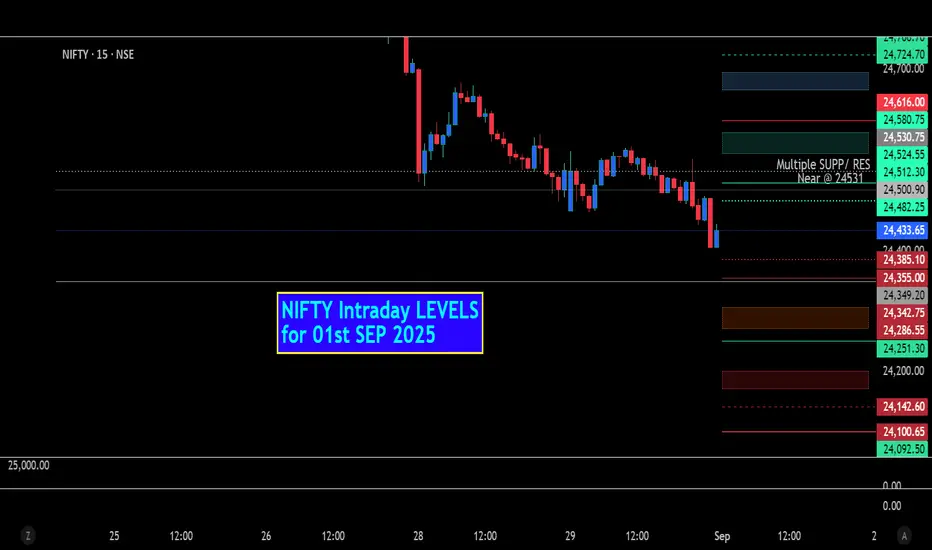
NIFTY Intraday Level for 01st SEP 2025All Plotted and Mentioned on Chart.
Colour code:
Green =. Positive bias.
Red =. Negative bias.
RED in Between Green means Trend Finder / Momentum Change
/ CYCLE Change and Vice Versa.
Notice one thing: HOW LEVELS are Working.
Disclaimer: Study Purpose only.
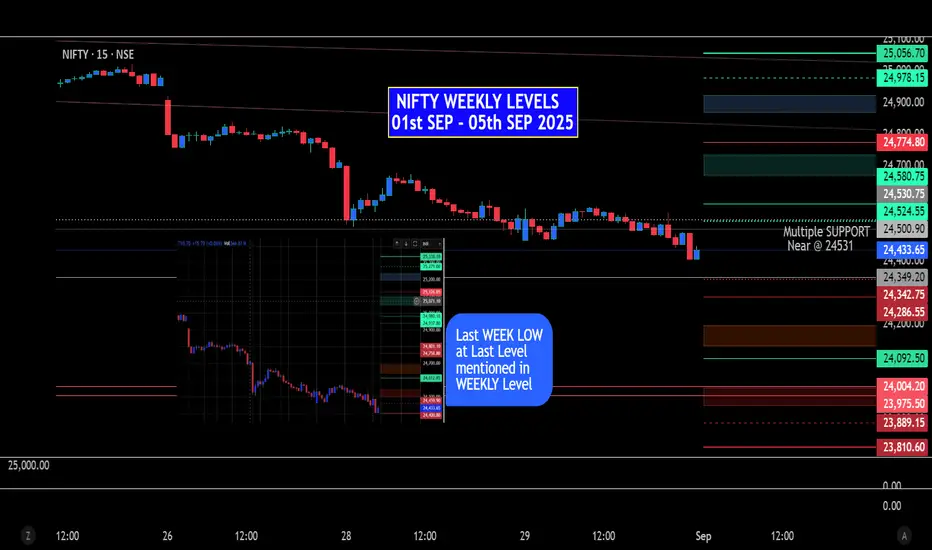
NIFTY WEEKLY Levels from 01st - 05th SEP 025All Plotted and Mentioned on Chart.
Colour code:
Green =. Positive bias.
Red =. Negative bias.
RED in Between Green means Trend Finder / Momentum Change
/ CYCLE Change and Vice Versa.
Notice one thing: HOW LEVELS are Working.
Disclaimer: Study Purpose only.
Nifty September 1st Week AnalysisNifty this week will be crucial , no clear trend on charts right now , important base on the downside is placed between 24072-24000 . While upside momentum to sustain only if nifty crosses and sustains above 24600. This weak move will decide the trend .
All levels are marked in the chart posted.

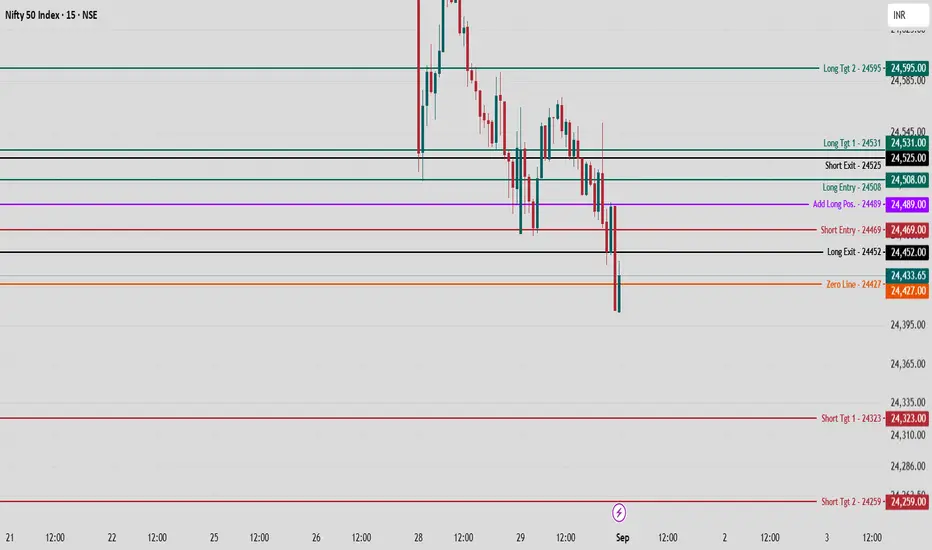
Nifty 50 Intraday Strategy 1 Sept., 2025 — Key Levels to WatchNSE:NIFTY The Nifty 50 Index has shown a narrow recovery after testing support levels, and several key levels are providing actionable insights for intraday traders based on the chart.
Nifty 50 Intraday Strategy — Key Levels to Watch
Nifty 50 is currently resisting downside momentum and holding above the Zero Line at 24,427. Bulls should closely monitor the following critical levels for directional bias and trade setup:
Bullish Scenario
Long Entry Zone: Watch for strength above 24,508—this is a key breakout level for upward momentum.
Add Longs: Momentum confirmation can come above 24,489. If Nifty sustains above here, look for targets at 24,531 (Long Tgt 1) and 24,595 (Long Tgt 2).
Long Exit Level: Book profits or trail stops at 24,452 to lock in gains if the move loses steam.
Bearish Scenario
Short Entry Zone: Breakdown below 24,469 signals weakness. Aggressive traders can consider shorts here with targets at 24,323 (Short Tgt 1) and further down to 24,259 (Short Tgt 2).
Short Exit: A reversal above 24,525 should be a stop for short trades.
Neutral/Balanced Zone
The zone between 24,427 (Zero Line) and 24,452 is a no-trade/consolidation area—wait for a clear breakout or breakdown before taking a position.
Trade with discipline: Always use proper position sizing and respect stop levels as marked. Today’s price actions around these levels can offer both intraday breakout and reversal opportunities for active traders.
Nifty Ends August in Pain: Can September Spark a Turnaround?Nifty slipped nearly 1.8% in the last week of August as global headwinds and US-India tariff concerns weighed on sentiment.
Selling was broad-based, with Banking and Financials dragging the index down the most.
The index currently trades just above 24,400, a crucial support level. Open interest data indicates that the 24,400–24,300 zone may provide short-term support, while the 25,500–25,600 zone remains significant resistance due to heavy call writing. A decisive break below 24,300 could quickly push the index toward 24,000.
Amid the weakness, a silver lining emerges — India’s strong 7.8% GDP growth, the highest in five quarters and well above expectations, may help cushion further downside.
Looking ahead, Monday’s open will set the tone for September—a gap-up above 25,500 could spark a rebound, while staying below may keep Nifty under pressure.
I am not an Advisor this is my Personal View and Knowledge PurpoNSE:NIFTY Sell in CMP Price Foe the Single Target 23824

Nifty at Make-or-Break Zone – Big Move Loading?Nifty ended the week at 24,426, down 444 points from last week’s close. It touched a high of 25,021 and a low of 24,404, once again respecting my projected range of 25,350 – 24,400.
Last week, I highlighted the Shooting Star formation and warned about increasing bearish pressure – this week we saw exactly that play out. Now, Nifty is hovering dangerously close to the strong support of 24,400. A daily close below 24,400 could open the gates for a slide towards 24,000 – 23,900.
Next Week’s Range Expectation:
➡️ Likely range → 24,900 – 23,900
➡️ Below 24,400 = 24,000/23,900 possible
➡️ Sideways consolidation for 1–2 weeks also on the table before momentum resumes
My View:
From the 2nd week of September, I still expect more selling pressure. But before that, big players may try to take markets higher to trap unsuspecting retailers. After all, they need someone to offload their stakes – and who better than us poor retailers 😅.
✅ What Traders & Investors Should Do:
Traders: Stay flexible. Be ready for both sideways action and a breakdown.
Investors: Use upcoming corrections to load quality stocks at attractive prices. Do your research, keep a watchlist ready, and pounce when the opportunity comes.
US Market Update – S&P500
The S&P500 closed at 6,460, almost flat compared to last week. It formed a weak, indecisive candle, signaling hesitation. For bulls to regain control, we need a close above 6,500, which could take the index toward the 6,568 Fibonacci level. On the downside, a break below 6,429 can trigger profit booking, pushing the index toward 6,400/6,373. At 6,373, fresh buyers may step in to drive the next upward leg.
Want me to review any index or cryptocurrency for you? Drop it in the comments and I’ll include it in my next update!
Nifty Analysis EOD – August 29, 2025 – Friday🟢 Nifty Analysis EOD – August 29, 2025 – Friday 🔴
Failed bounce, sellers strike back at higher levels
🗞 Nifty Summary
Nifty opened with a GapDown of 66 points but immediately started moving up with an OL formation (Open = Low at 24,466.60) — a sign of bullish intent.
The first 5-min range of 98 points set the IB (Initial Balance), marking Day Low = Open and Day High = 24,564.35.
Throughout the session, the index attempted multiple IB breakouts but they all turned into false moves until 2:30 PM, when Nifty finally broke down IB Low and tested 24,400 zone before closing weak at 24,426.85 (−74.05 / −0.30%).
This structure suggests bears are still in control, though signs of base-building are emerging.
🛡 5 Min Intraday Chart with Levels
📝 Intraday Walk
GapDown start, but immediate OL formation = bullish sentiment
Quick gap-filling attempt, but resistance capped upside near 24,564
Multiple failed IB breakouts (both sides) = choppy action
Post 2:30 PM → decisive IB Low breakdown toward 24,400
Weak close at 24,426, below the midpoint of the day
📉 Daily Time Frame Chart with Intraday Levels
🕯 Daily Candle Breakdown
Open: 24,466.70
High: 24,572.45
Low: 24,404.70
Close: 24,426.85
Change: −74.05 (−0.30%)
🏗️ Structure Breakdown
Upper Wick (~105 pts): strong selling rejection at higher levels
Lower Wick (~22 pts): weak buyer defense near lows
Body (39.85 pts): indecisive but bearish bias
🕯Candle Type
Rejection-style red candle with small body and long upper wick.
📚 Interpretation
Early rebound attempt failed.
Close well below midpoint = sellers retain control.
Candle resembles a Shooting Star (bearish context) → signals supply pressure at higher levels.
🛡 5 Min Intraday Chart
⚔️ Gladiator Strategy Update
ATR: 201.12
IB Range: 97.75 → Medium
Market Structure: Balanced
Trade Highlights: No trade signal triggered
📌 Support & Resistance Levels
Resistance Zones:
24,585 ~ 24,600
24,675 ~ 24,695
24,745
Support Zones:
24,665 ~ 24,650
24,365 ~ 24,335
🔮 What’s Next? / Bias Direction
If 24,400 holds, short-term base formation could play out.
If 24,400 breaks, expect further downside toward 24,250.
Bias → Bearish continuation unless 24,600 is decisively reclaimed.
💭 Final Thoughts
“Markets don’t reverse in a single day – they build a base. Respect the levels, not the noise.”
✏️ Disclaimer
This is just my personal viewpoint. Always consult your financial advisor before taking any action.

Technical Analysis Report for the NIFTY 50 INDEX.# NIFTY 50 Technical Analysis: Comprehensive Multi-Timeframe Trading Strategy
Executive Summary
Current Price: 24,433.65 (August 29, 2025, 1:5 PM UTC+4)
Market Sentiment: Cautiously Bullish with Consolidation Bias
Primary Trend: Uptrend with potential for continued advancement
Key Resistance: 25,000 (psychological level and technical confluence)
The NIFTY 50 continues to demonstrate resilience in the face of global uncertainties, maintaining its position above key support levels while approaching significant psychological resistance. The index benefits from accommodative monetary policy with the RBI's recent rate cuts and strong domestic fundamentals, though valuations warrant selective positioning.
Market Context & Fundamental Backdrop
Monetary Policy Environment
The Reserve Bank of India has cut its repo rate by 0.25%, which now stands at 6.25%, marking a significant shift in policy stance. Markets expect the RBI may implement one more 25-bps rate cut in August 2025, especially ahead of the festive season which historically shows multiplier effects on consumer demand.
Economic Fundamentals
India's GDP expanded 7.80 percent in the second quarter of 2025 over the same quarter of the previous year, demonstrating robust economic growth. The RBI expects real GDP to grow 6.5% in FY 2025-26, supported by strong domestic demand and government capital expenditures.
Inflation and Growth Balance
Headline inflation in India is expected to average 4.2% year-on-year in the 2025 calendar year, with food inflation at 4.6% — much lower than estimates of 7%-plus for 2024, thanks to adequate rainfall and good sowing.
Earnings Outlook
Consensus expects 11-12% earnings growth for the Nifty 50 in FY26, with the index trading below 20x price-earnings on FY26 estimates, suggesting reasonable valuations at current levels.
Technical Analysis Framework
Japanese Candlestick Analysis
Weekly Pattern: Spinning top formation indicating indecision at current levels
Daily Pattern: Small-bodied candles with narrow ranges suggesting consolidation
Intraday Patterns: Hammer and doji formations prevalent in 1H and 4H timeframes
Volume Confirmation: Average volume during consolidation phase
Elliott Wave Analysis
Primary Wave Count:
Major Degree: Wave 5 of larger bull market cycle potentially in progress
Intermediate Degree: Subwave 3 of 5 showing extension characteristics
Minor Degree: Currently in subwave 4 correction of intermediate wave 3
Alternative Count: Complex correction (WXY) completion targeting 25,200-25,500
Critical Support: Wave 4 support at 23,800-24,000 maintains bullish structure
Harmonic Pattern Analysis
Active Patterns:
Bullish Gartley: Potential completion zone at 23,950-24,100
ABCD Pattern: Current formation targeting 24,800-25,000
Potential Cypher: Formation developing with D point near 25,100
Fibonacci Analysis:
- 50% retracement of major swing: 24,200
- 38.2% retracement: 24,500 (current consolidation area)
- 1.618 extension target: 24,900-25,000
Wyckoff Method Analysis
Phase Assessment: Accumulation Phase C - Testing supply
Characteristics:
- Volume patterns showing accumulation on weakness
- Price holding above composite operator accumulation zone
- Sign of Strength (SOS) evident on recent advances
Distribution Risk: Monitor for climactic volume above 25,000
W.D. Gann Technical Analysis
# Square of 9 Application
Current Position: 24,433.65 = 156.31° on the Gann wheel
Key Resistance Levels:
- 24,481 (156.5°) - immediate minor resistance
- 24,649 (157°) - intermediate resistance
- 25,000 (158.11°) - major psychological and geometric resistance
Support Levels:
- 24,336 (156°) - immediate support
- 24,025 (155°) - strong support zone
- 23,716 (154°) - major support level
# Time Theory Application
Critical Time Windows:
- September 9-12: 45-degree time angle from recent high
- September 23: Autumn equinox - natural market turning point
- October 8-15: 90-degree time cycle completion
# Price and Time Squaring
Square Root Analysis: √24,433.65 = 156.31
Next Square Levels:
- 157² = 24,649 (key resistance)
- 158² = 24,964 (approaching 25,000)
- 160² = 25,600 (extended target)
Ichimoku Kinko Hyo Analysis
Cloud Configuration:
Tenkan-sen (9): 24,445 - Price slightly below, neutral
Kijun-sen (26): 24,380 - Price above, mild bullish bias
Senkou Span A: 24,412 (cloud top)
Senkou Span B: 24,100 (cloud bottom)
Assessment: Price trading within cloud, indicating consolidation phase with neutral bias pending breakout direction.
Multi-Timeframe Technical Indicator Analysis
5-Minute Chart (Scalping Focus)
RSI(14): 49.2 - Neutral territory with no momentum bias
VWAP: 24,428 - Price oscillating around VWAP
Bollinger Bands: Middle band at 24,430, bands contracting (low volatility period)
Moving Averages: EMA(20) = 24,435, SMA(20) = 24,440
15-Minute Chart (Scalping Focus)
MACD: Near zero line, histogram flat - no clear momentum
Stochastic(14,3,3): 52.1 in neutral zone
Williams %R: -48% indicating no extreme conditions
Volume: Below average, typical for consolidation
Key Intraday Levels:
Resistance: 24,460, 24,490, 24,520
Support: 24,400, 24,370, 24,340
1-Hour Chart (Day Trading)
RSI(14): 54.3 - Slight bullish bias but not overbought
VWAP: 24,415 providing dynamic support
ADX(14): 22.1 indicating weak trend strength (consolidation)
Volume Profile: High volume node at 24,380-24,450
Trading Range:
Upper Boundary: 24,520-24,550
Lower Boundary: 24,320-24,350
Breakout Levels: Above 24,580 (bullish) / Below 24,280 (bearish)
4-Hour Chart (Swing Trading)
RSI(14): 57.8 showing mild bullish momentum
MACD: Positive but flattening, momentum slowing
Bollinger Bands: Price near middle band, bands parallel (range-bound)
Moving Averages: All short-term MAs converging around current price
Swing Levels:
Primary Resistance: 24,650-24,700
Secondary Resistance: 24,900-25,000
Primary Support: 24,200-24,250
Secondary Support: 24,000-24,050
Daily Chart (Position Trading)
RSI(14): 59.4 in bullish territory but not extreme
MACD: Positive with slight bullish divergence
Volume: Consolidation pattern with below-average volume
Pattern: Symmetrical triangle formation approaching apex
Key Daily Levels:
Triangle Resistance: 24,700-24,750 (declining)
Triangle Support: 24,150-24,200 (rising)
Breakout Targets: 25,200 (upside) / 23,600 (downside)
Weekly Chart (Long-term Analysis)
RSI(14): 63.2 showing healthy bullish momentum
MACD: Positive momentum but rate of change slowing
Long-term Trend: Intact uptrend since March 2020 low
Major Resistance: 25,000-25,200 zone
Monthly Chart (Strategic Perspective)
RSI(14): 68.1 approaching overbought levels
Long-term Pattern: Multi-year ascending triangle completion
Major Support: 22,000-22,500 zone
Extended Targets: 26,000-27,000 on sustained breakout
Comprehensive Support and Resistance Analysis
Primary Support Zones
1. 24,380-24,420: Kijun-sen and VWAP confluence zone
2. 24,320-24,350: Previous consolidation low and volume support
3. 24,200-24,250: 50% Fibonacci retracement and psychological level
4. 24,100-24,150: Cloud bottom and structural support
5. 24,000-24,050: Major psychological level and trend line support
6. 23,800-23,900: Elliott Wave 4 support and major trend line
7. 23,600-23,700: Extended support and breakout failure target
Primary Resistance Zones
1. 24,460-24,490: Immediate intraday resistance
2. 24,520-24,580: Short-term resistance and breakout level
3. 24,650-24,700: Triangle resistance and swing high
4. 24,850-24,900: Intermediate resistance zone
5. 24,950-25,000: Major psychological resistance and Square of 9
6. 25,100-25,200: Extended targets and measured moves
7. 25,500-25,800: Long-term bull market targets
Weekly Trading Strategy (September 2-6, 2025)
Monday, September 2, 2025
Market Environment: Post-weekend consolidation, range-bound expected
Primary Strategy: Range trading within established boundaries
Volatility: Low to moderate, typical Monday characteristics
Intraday Setup:
Range: 24,380-24,480
Long Entry: 24,390-24,410
- Stop Loss: 24,360
- Target 1: 24,450 (1:1.5 R/R)
- Target 2: 24,480 (1:2.5 R/R)
Short Entry: 24,470-24,490
- Stop Loss: 24,520
- Target 1: 24,430 (1:1.5 R/R)
- Target 2: 24,400 (1:2.5 R/R)
Swing Consideration: Monitor for breakout preparation above 24,500
Tuesday, September 3, 2025
Market Environment: Increased activity expected, potential trending day
Primary Strategy: Momentum trading with breakout preparation
Key Focus: Volume analysis for sustained directional moves
Trading Scenarios:
Bullish Breakout: Above 24,520 with volume
- Entry: 24,530-24,550
- Stop: 24,480
- Targets: 24,600, 24,650, 24,700
Bearish Breakdown: Below 24,360 with volume
- Entry: 24,350-24,330
- Stop: 24,390
- Targets: 24,280, 24,250, 24,200
Risk Management: Reduce position size by 25% on breakout trades
Wednesday, September 4, 2025
Market Environment: Mid-week volatility, economic data focus
Primary Strategy: News-driven trading with technical confirmation
Event Risk: Monitor for any economic announcements
Scalping Strategy:
High-Frequency Range: 24,400-24,460
Long Scalps: 24,405-24,415, Target: 24,445-24,455
Short Scalps: 24,450-24,460, Target: 24,415-24,425
Stop Loss: Maximum 20 points for scalp trades
Swing Setup: Prepare for potential triangle breakout
Thursday, September 5, 2025
Market Environment: Potential high-volatility day
Primary Strategy: Breakout trading with strong risk management
Focus: Triangle resolution expected
Triangle Breakout Strategy:
Upside Breakout: Above 24,580
- Confirmation: Volume > 1.3x average
- Initial Target: 24,700
- Extended Target: 24,850-24,900
Downside Breakdown: Below 24,280
- Confirmation: Volume > 1.2x average
- Initial Target: 24,150
- Extended Target: 24,000-24,050
Position Management: Trail stops after 50% of target achieved
Friday, September 6, 2025
Market Environment: Weekly settlement, profit-taking likely
Primary Strategy: End-of-week positioning and profit-taking
Focus: Weekly close levels for next week setup
Settlement Strategy:
Bullish Close: Above 24,500 supports next week advance
Neutral Close: 24,350-24,500 maintains consolidation
Bearish Close: Below 24,350 suggests correction risk
Day Trading Approach:
Morning: Follow Thursday's direction initially
Afternoon: Expect consolidation and position adjustments
Last Hour: Avoid large new positions
Risk Management Framework
Position Sizing Guidelines
Risk Per Trade by Timeframe:
5M Scalping: 0.25-0.5% of capital
15M Scalping: 0.5-0.75% of capital
1H Day Trading: 1-1.5% of capital
4H Swing Trading: 1.5-2% of capital
Daily Position Trading: 2-2.5% of capital
Stop Loss Framework
Timeframe-Specific Stops:
5-Minute: 15-25 points maximum
15-Minute: 25-40 points maximum
1-Hour: 40-60 points maximum
4-Hour: 80-120 points maximum
Daily: 150-250 points maximum
Profit-Taking Strategy
Systematic Approach:
Target 1 (40%): 1:1 Risk/Reward
Target 2 (35%): 1:2 Risk/Reward
Target 3 (25%): 1:3+ Risk/Reward
Trailing Stops: Activate after Target 1
Maximum Drawdown Limits
Daily Loss Limit: 3% of trading capital
Weekly Loss Limit: 7% of trading capital
Monthly Loss Limit: 15% of trading capital
Geopolitical and Economic Risk Assessment
Domestic Risk Factors
Monetary Policy:
- RBI rate cut cycle supporting liquidity
- Inflation targeting maintaining credibility
- Banking system stability considerations
Fiscal Policy:
- Government capex supporting growth
- Festive season spending boost expected
- Budget allocation efficiency focus
Corporate Earnings:
- Q2 FY26 earnings season approaching
- Margin pressure from input costs
- Sectoral rotation opportunities
Global Risk Factors
US Federal Reserve Policy:
- Rate cut expectations supporting EM flows
- Dollar weakness benefiting Indian markets
- Global liquidity conditions favorable
China Economic Impact:
- Trade relationship developments
- Commodity price implications
- Regional growth spillover effects
Geopolitical Considerations:
- Regional security stability
- Energy security and pricing
- Trade policy developments
Sector-Specific Risks
Banking & Financial Services:
- Credit growth sustainability
- NPA cycle management
- Interest rate sensitivity
Information Technology:
- Global demand patterns
- Currency hedging strategies
- AI and automation impact
Consumer Discretionary:
- Rural demand recovery
- Festive season performance
- Inflation impact on spending
Sectoral Analysis and Rotation Themes
Outperforming Sectors
1. Banking & Financial Services: Rate cut cycle benefits
2. FMCG: Festive season demand and rural recovery
3. Infrastructure: Government capex and policy support
4. Pharmaceuticals: Export competitiveness and domestic growth
Underperforming Sectors
1. Information Technology: Global demand concerns
2. Metals & Mining: Commodity price volatility
3. Real Estate: Interest rate sensitivity despite cuts
4. Telecommunications: Competitive pressure and capex burden
Rotation Indicators
Growth vs Value: Favoring quality growth at reasonable prices
Large Cap vs Mid/Small Cap: Large cap leadership maintained
Domestic vs Export: Domestic consumption themes outperforming
Advanced Technical Patterns
Ichimoku Trading Signals
Current Setup: Price within cloud, neutral bias
Bullish Trigger: Break above Tenkan-sen with volume
Bearish Trigger: Break below cloud with momentum
Long-term View: Future cloud remains bullish
Gann-Based Strategies
Square of 9 Trades:
- Long: 155° (24,025) targeting 158° (24,964)
- Short: 158° (24,964) targeting 155° (24,025)
- Time Cycles: September 9-12 reversal window
Wyckoff Phase Trading
Current Phase: Accumulation Phase C
Next Phase: Markup expected on successful test
Volume Confirmation: Key for phase transition
Distribution Risk: Monitor above 25,200
Market Microstructure Analysis
Algorithmic Trading Impact
High-Activity Zones: 24,000, 24,500, 25,000 levels
Optimal Entry Times: 9:15-9:45 and 14:30-15:15 IST
Liquidity Patterns: Reduced depth during lunch hours
Order Flow Considerations
Institutional Activity: Accumulation evident below 24,400
FII Flows: Recent buying supporting current levels
DII Participation: Consistent buying on weakness
Technology and Tools Integration
Recommended Platforms
1. TradingView: Advanced charting and technical analysis
2. Zerodha Kite: Real-time execution and portfolio management
3. Bloomberg Terminal: Comprehensive market data and news
4. Refinitiv Workspace: Fundamental analysis integration
Alert Configuration
Price Alerts:
- Triangle breakout: 24,580 (up) / 24,280 (down)
- Psychological levels: 24,500, 25,000
- Support/resistance: 24,200, 24,700
Volume Alerts:
- Unusual volume spikes (>150% average)
- Block deal notifications
- Institutional flow changes
Seasonal and Calendar Considerations
Festive Season Impact
Indian markets are entering the 4-month-long festive season from September, which historically shows positive performance. This period typically sees:
- Increased consumer spending
- Corporate bonus distributions
- Portfolio rebalancing by institutions
- Higher retail participation
Economic Calendar
Key Events:
- RBI Monetary Policy (likely September 17)
- Q2 FY26 GDP data (October/November)
- Inflation data (monthly releases)
- FII/DII flow data (weekly)
Holiday Calendar
- Ganesh Chaturthi (September 7) - Market closed
- Dussehra (October 12) - Market closed
- Diwali (November 1) - Market closed
- Guru Nanak Jayanti (November 15) - Market closed
Conclusion and Strategic Outlook
The NIFTY 50 stands at a critical juncture, consolidating near significant resistance levels while benefiting from supportive monetary and fiscal policies. The technical picture suggests a healthy consolidation phase that could resolve in favor of further upside, particularly given the approaching festive season and improving economic fundamentals.
Key Investment Themes:
1. Triangle Resolution: Current consolidation likely to resolve with directional clarity
2. Festive Season Tailwinds: Historical patterns favor bullish bias into year-end
3. Rate Cut Benefits: Lower rates supporting equity valuations and credit growth
4. Earnings Growth: Expected double-digit growth supporting index advancement
Trading Strategy Priorities:
- Focus on triangle breakout trades with volume confirmation
- Favor range trading until clear directional break
- Maintain disciplined risk management given elevated levels
- Prepare for increased volatility around key events
Medium-term Outlook (1-3 months):
The combination of accommodative monetary policy, strong GDP growth, controlled inflation, and seasonal tailwinds provides a constructive backdrop for Indian equities. Technical analysis suggests potential for advancement toward 25,500-26,000 on sustained breakout above current resistance.
Risk Management Focus:
- Triangle breakdown below 24,280 could target 24,000-23,800
- Global risk-off sentiment remains key external risk
- Valuation concerns at higher levels warrant selectivity
- Currency stability important for FII flow continuation
The analysis incorporates multiple technical methodologies while acknowledging the strong fundamental backdrop supporting Indian markets. Traders should remain flexible and prepared for both continuation and reversal scenarios while maintaining strict adherence to risk management protocols.
---
*This comprehensive analysis combines technical and fundamental factors to provide actionable trading strategies. All recommendations should be implemented within individual risk tolerance parameters and current market conditions. Market dynamics can change rapidly, requiring continuous monitoring and strategy adjustments.*
Currency Derivatives in International MarketsIntroduction
Global trade, cross-border investments, and multinational business operations depend heavily on currencies. Whenever goods, services, or capital cross borders, transactions often involve exchanging one currency for another. Because exchange rates constantly fluctuate, this creates both risks and opportunities for businesses, investors, and traders.
To manage these risks or speculate on currency movements, international financial markets provide a sophisticated set of instruments known as currency derivatives.
Currency derivatives are financial contracts whose value is derived from the exchange rate of two currencies. For example, a contract tied to USD/INR, EUR/USD, or JPY/CNY is a currency derivative. These instruments enable market participants to hedge against foreign exchange (forex) volatility, arbitrage between markets, or speculate on price trends.
This article will provide a comprehensive exploration of currency derivatives in international markets, covering their types, mechanisms, uses, risks, regulatory aspects, and global market trends.
1. The Need for Currency Derivatives
1.1 Exchange Rate Volatility
Currencies fluctuate due to factors like interest rate changes, inflation, trade balances, geopolitical events, and capital flows. For instance, when the US Federal Reserve raises interest rates, the US dollar typically strengthens, impacting emerging market currencies.
A European exporter selling machinery to India and receiving payment in Indian Rupees (INR) faces the risk that the INR might depreciate against the Euro before payment, reducing profit margins. Currency derivatives help hedge such risks.
1.2 Globalization and Trade
With the rise of global supply chains, companies constantly deal with multiple currencies. Currency risk can materially impact revenues and costs. Derivatives are necessary tools for financial planning, pricing, and budgeting.
1.3 Capital Flows and Investments
Portfolio investors and institutional funds investing abroad face currency exposure. For instance, a US-based investor holding Japanese equities will see returns influenced not only by the performance of Japanese stocks but also by the movement of USD/JPY.
1.4 Speculation and Arbitrage
Not all currency derivative participants are hedgers. Many are speculators (betting on movements for profit) or arbitrageurs (exploiting price inefficiencies across markets). This mix ensures liquidity and efficient pricing in derivative markets.
2. Types of Currency Derivatives
Currency derivatives exist in both over-the-counter (OTC) and exchange-traded markets. The most common types are:
2.1 Currency Forwards
A forward contract is a private agreement between two parties to exchange a fixed amount of one currency for another at a predetermined exchange rate on a future date.
OTC product: Customized in terms of amount, maturity, and settlement.
Commonly used by corporations for hedging.
Example: An Indian company expects to pay $1 million to a US supplier in 3 months. It enters a forward contract to lock the USD/INR rate at 84.50, ensuring certainty regardless of market fluctuations.
2.2 Currency Futures
Futures are standardized contracts traded on organized exchanges, obligating the buyer and seller to exchange currencies at a specific price and date.
Exchange-traded: Offers liquidity, transparency, and margin requirements.
Example: An investor on the CME (Chicago Mercantile Exchange) may buy a Euro futures contract against the USD, betting on Euro appreciation.
2.3 Currency Options
Options give the right (but not the obligation) to buy (call) or sell (put) a currency at a specified strike price before or at maturity.
Useful for hedgers who want downside protection but retain upside potential.
Example: A US importer buying goods from Japan may purchase a call option on USD/JPY to guard against Yen appreciation.
2.4 Currency Swaps
A currency swap involves exchanging principal and interest payments in one currency for those in another, often for long durations.
Used by corporations and governments to secure cheaper debt or match cash flows.
Example: A European company needing USD may swap its Euro-based loan obligations with a US company holding dollar liabilities.
2.5 Exotic Currency Derivatives
Beyond plain vanilla products, international markets also use structured derivatives:
Barrier options (knock-in, knock-out)
Basket options (linked to multiple currencies)
Quanto derivatives (currency-linked but settled in another currency)
These instruments cater to advanced hedging and speculative needs.
3. Mechanism of Currency Derivatives Trading
3.1 Pricing and Valuation
Forward Rate = Spot Rate × (1 + Interest Rate of Domestic Currency) / (1 + Interest Rate of Foreign Currency)
Futures prices are influenced by forward rates, interest rate parity, and market demand-supply.
Options pricing uses models like Black-Scholes or Garman-Kohlhagen (an extension for forex options).
3.2 Clearing and Settlement
Exchange-traded derivatives use central counterparties (CCPs) to guarantee settlement.
OTC derivatives often settle bilaterally, though post-2008 reforms require central clearing for many contracts.
3.3 Participants
Hedgers: Exporters, importers, MNCs, institutional investors.
Speculators: Traders betting on short-term price swings.
Arbitrageurs: Exploit mispricing between spot, forward, and derivative markets.
4. Role of Currency Derivatives in Risk Management
4.1 Corporate Hedging
Companies hedge to reduce earnings volatility. For example, Apple Inc. uses currency forwards and options to manage exposure to sales in Europe and Asia.
4.2 Portfolio Diversification
Fund managers hedge international portfolios to ensure returns are not eroded by currency losses.
4.3 Central Bank Intervention
Some central banks use derivatives indirectly to manage currency volatility without outright market intervention.
5. Risks in Currency Derivatives
While derivatives mitigate risk, they carry their own risks:
Market Risk – Adverse movements in exchange rates.
Credit Risk – Counterparty default in OTC forwards/swaps.
Liquidity Risk – Difficulty in exiting contracts, especially in exotic currencies.
Operational Risk – Errors in execution, valuation, or reporting.
Systemic Risk – Excessive derivative speculation (as seen in 2008 crisis) can amplify global financial instability.
6. Regulatory Framework in International Markets
US: Commodity Futures Trading Commission (CFTC) regulates currency futures/options.
Europe: European Securities and Markets Authority (ESMA) oversees derivatives under EMIR (European Market Infrastructure Regulation).
Asia: Singapore (SGX), Hong Kong (HKEX), India (SEBI) have their own frameworks.
Global: Bank for International Settlements (BIS) coordinates reporting and risk control.
Post-2008, G20 reforms emphasized:
Mandatory central clearing of standardized OTC contracts.
Reporting of derivatives trades to trade repositories.
Higher capital requirements for banks dealing in derivatives.
7. Major International Markets for Currency Derivatives
7.1 Chicago Mercantile Exchange (CME)
World’s largest market for currency futures and options (USD, Euro, Yen, GBP, CAD, etc.).
7.2 London
Global hub for OTC forex and currency swaps due to deep liquidity and time-zone advantages.
7.3 Asia-Pacific
Singapore Exchange (SGX): Growing hub for Asian currency derivatives.
India’s NSE/BSE: Offers USD/INR, EUR/INR, GBP/INR contracts.
China: Restricted but gradually opening with RMB futures and offshore CNH markets.
7.4 Emerging Markets
Increasing participation as trade volumes grow (e.g., Brazil, South Africa).
8. Case Studies
Case Study 1: Indian IT Companies
Infosys and TCS earn over 70% of revenue in USD/EUR but report in INR. To stabilize earnings, they actively use currency forwards and options.
Case Study 2: European Sovereign Debt
During the Eurozone crisis (2010–2012), several governments used swaps to manage currency-linked borrowings, highlighting both utility and hidden risks of derivatives.
Case Study 3: Hedge Fund Speculation
George Soros’ famous bet against the British Pound in 1992 (Black Wednesday) used massive currency derivative positions, forcing the UK out of the ERM (Exchange Rate Mechanism).
9. Current and Future Trends in Currency Derivatives
Rising Use in Emerging Markets: As Asia, Africa, and Latin America expand global trade.
Digital Platforms: Algorithmic and high-frequency trading dominate currency futures/options.
Clearing Reforms: Push for greater transparency in OTC markets.
Crypto and Digital Currencies: Bitcoin futures/options and central bank digital currencies (CBDCs) are reshaping forex risk management.
Geopolitical Tensions: Currency derivatives are increasingly used to hedge risks from wars, sanctions, and supply-chain disruptions.
ESG-linked derivatives: Growing alignment with sustainable finance trends.
10. Advantages and Criticisms
Advantages:
Hedging reduces business uncertainty.
Enhances global trade and investment flows.
Provides liquidity and efficient price discovery.
Criticisms:
Over-speculation can destabilize economies.
Complex derivatives can hide risks (as seen in 2008 crisis).
Dependence on clearing houses may concentrate systemic risks.
Conclusion
Currency derivatives are the backbone of modern international financial markets, enabling businesses, investors, and governments to manage risks associated with exchange rate fluctuations. They enhance global trade, promote investment flows, and ensure efficient allocation of capital.
However, they are double-edged swords. When used responsibly, they stabilize earnings, reduce volatility, and promote growth. But when misused, they can fuel financial crises.
As globalization deepens and financial technology advances, currency derivatives will only grow in importance. Regulators, corporations, and investors must balance innovation, risk management, and systemic stability to ensure that these instruments continue to support — rather than destabilize — the global economy.