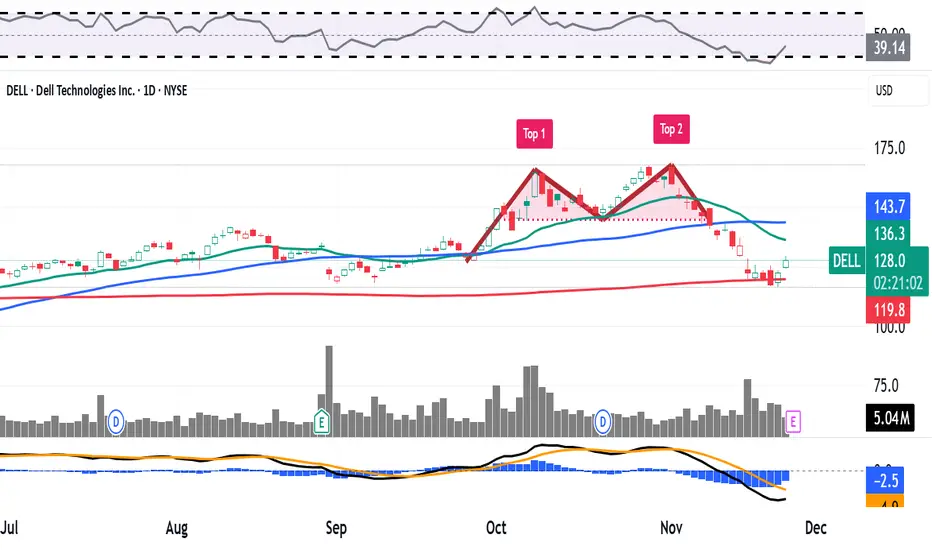
Fading $DELL rallies at the 140 zone
Bullish Scenario (Spring): Watch for a decisive undercut of the $122 support toward $116 (factor-5 Keltner).
Bearish Scenario (UTAD): If price tests $133-$135 zone and fails.
Next report date
—
Report period
—
EPS estimate
—
Revenue estimate
—
7.62 USD
4.59 B USD
95.47 B USD
312.23 M
About Dell Technologies Inc.
Sector
Industry
CEO
Michael Saul Dell
Website
Headquarters
Round Rock
Founded
1984
Identifiers
3
ISINUS24703L2025
Dell Technologies, Inc. is a technology company, providing customers with a broad and innovative solution portfolio to help customers modernize their information technology (IT) infrastructure, address workforce transformation, and offer critical solutions that keep people and organizations connected. It operates through the following segments: Infrastructure Solutions Group (ISG) and Client Solutions Group (CSG). The ISG segment includes servers, networking, and storage, as well as services and third-party software and peripherals that are closely tied to the sale of ISG hardware. The CSG segment includes designs for commercial and consumer customers of desktops, thin client products, and notebooks. The company was founded by Michael Saul Dell in 1984 and is headquartered in Round Rock, TX.
Related stocks

DELL - The Long Climb=======
Volume
=======
- slight increase
==========
Price Action
==========
- Latest downtrend line broken and supported pullback way above line
- Rounded bottom
- Change of trend observed
=========
Oscillators
=========
- Ichimoku
>>> price above cloud
>>> green kumo
>>> base + conv + lagging ab

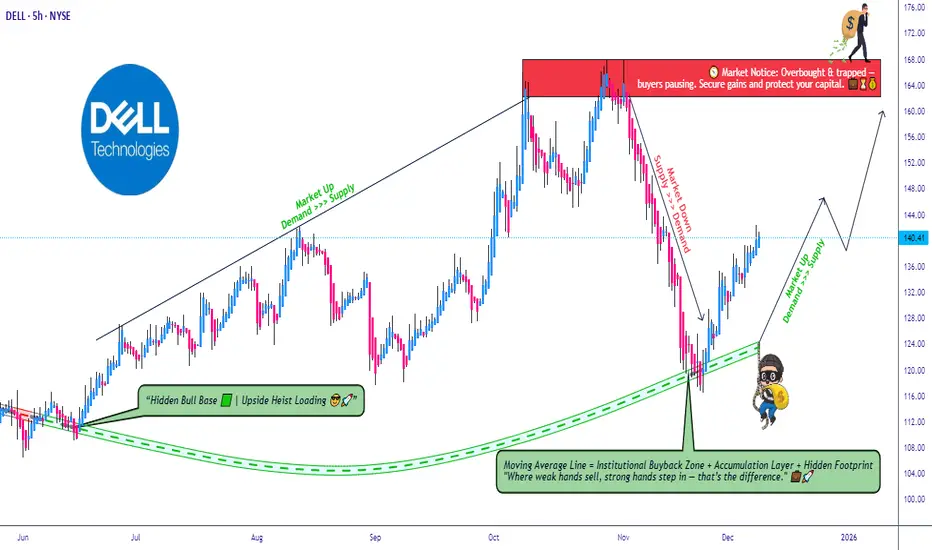
DELL Price Action ⁞ Bullish TMA Structure Offering Clean Entries🎯 DELL Technologies: The "Gentleman Thief" Swing Trade Setup 💼🔓
📊 Market Overview
💰 DELL Technologies Inc. (NYSE: DELL)
Current Price: $138.91
📈52-Week Range: $66.25 - $168.08
Market Cap: $93.10B
Analyst Rating: Strong Buy (18 analysts recommend buying)
Average Price Target: $163.30
🎭 The "Gen
Long bull runThe case here is that DELL will not fall below $130 until Dec 26.
To short a put option at 130@1.40 and long a put at 128@1.03
Max loss -1.63 abt 15% max profit 0.37 abt 85%
R/R=0.23
EMV=0.07

Bull long run at 130To short a put option at 130 with premium 1.40 and long a put at 128 with premium 1.03.
Max loss -1.63 abt 15% max profit 0.37 abt 85%
R/R=0.23
EMV=0.07

Dell Technologies primed for breakout above $140 resistance
Current Price: $138.91
Direction: LONG
Confidence Level: 72% (Several traders and strong X sentiment point to bullish breakout potential; price action near resistance but with oversold RSI suggests upward momentum building)
Targets:
- T1 = $141.50
- T2 = $145.00
Stop Levels:
- S1 = $136.50
- S2

DELL Earnings Alert: High-Conviction Bearish Signal DELL QuantSignals V3 Earnings | 2025-11-25
DELL Earnings Signal | 2025-11-25
• Direction: BUY PUTS | Confidence: 60%
• Entry Plan: Pre-Earnings Close | Expiry: 2025-11-28
• Strike Focus: $117.00
• Entry Range: $1.34
• Target 1: $2.62
• Stop Loss: $0.79
• Implied Move: $9.88 (7.8%)
• 24h Move: +2.20

DELLDELL has pulled back sharply from the September peak & remains below its 50d MA, so trend pressure remains downward heading into earnings since price rejected off it cleanly earlier in November
This makes earnings more binary since support is more vulnerable on a miss
RSI ~38 is still washed out

Dell Has Lost Some 25% in Recent Weeks. What Its Chart Says HereDell Technologies NYSE:DELL has fallen some 25% in just three weeks after hitting an 18-month high earlier this month, and the stock has trailed the S&P 500 SP:SPX in almost every timeframe from one month to five years. Let's check out the computer-hardware and enterprise-solutions firm's chart
DELL - Another Earnings SetupHello Everyone, Followers,
DELL is another one that will release their financial reports on Tuesday next week. Here is my view on it.
DELL is coming into earnings with a sharp pullback after the big run earlier this quarter. Price dropped from the 160s and is now trying to stabilize around 122.51,

See all ideas
Summarizing what the indicators are suggesting.
Neutral
SellBuy
Strong sellStrong buy
Strong sellSellNeutralBuyStrong buy
Neutral
SellBuy
Strong sellStrong buy
Strong sellSellNeutralBuyStrong buy
Neutral
SellBuy
Strong sellStrong buy
Strong sellSellNeutralBuyStrong buy
An aggregate view of professional's ratings.
Neutral
SellBuy
Strong sellStrong buy
Strong sellSellNeutralBuyStrong buy
Neutral
SellBuy
Strong sellStrong buy
Strong sellSellNeutralBuyStrong buy
Neutral
SellBuy
Strong sellStrong buy
Strong sellSellNeutralBuyStrong buy
Displays a symbol's price movements over previous years to identify recurring trends.
DMFP4364659
Diamond 1 Finance Corp. 8.1% 15-JUL-2036Yield to maturity
7.11%
Maturity date
Jul 15, 2036
DMFP4364662
Diamond 1 Finance Corp. 8.35% 15-JUL-2046Yield to maturity
6.88%
Maturity date
Jul 15, 2046
DLTL5317223
Dell International LLC 3.375% 15-DEC-2041Yield to maturity
6.14%
Maturity date
Dec 15, 2041
DELL5208606
EMC Corporation 8.35% 15-JUL-2046Yield to maturity
6.08%
Maturity date
Jul 15, 2046
DLTL5317615
Dell International LLC 3.45% 15-DEC-2051Yield to maturity
6.08%
Maturity date
Dec 15, 2051
DELL5663346
Dell International LLC 3.45% 15-DEC-2051Yield to maturity
5.83%
Maturity date
Dec 15, 2051
DMFP4364655
Diamond 1 Finance Corp. 6.02% 15-JUN-2026Yield to maturity
5.68%
Maturity date
Jun 15, 2026
US24702RAF8
Dell Inc. 6.5% 15-APR-2038Yield to maturity
5.66%
Maturity date
Apr 15, 2038
US24702RAM34
Dell Inc. 5.4% 10-SEP-2040Yield to maturity
5.65%
Maturity date
Sep 10, 2040
DELL5317222
Dell International LLC 3.375% 15-DEC-2041Yield to maturity
5.43%
Maturity date
Dec 15, 2041
DELL5212276
EMC Corporation 8.1% 15-JUL-2036Yield to maturity
5.43%
Maturity date
Jul 15, 2036
See all DELL bonds
Curated watchlists where DELL is featured.


Frequently Asked Questions
The current price of DELL is 127.62 USD — it has increased by 0.80% in the past 24 hours. Watch Dell Technologies Inc. stock price performance more closely on the chart.
Depending on the exchange, the stock ticker may vary. For instance, on NYSE exchange Dell Technologies Inc. stocks are traded under the ticker DELL.
DELL stock has fallen by −2.05% compared to the previous week, the month change is a 7.64% rise, over the last year Dell Technologies Inc. has showed a 9.53% increase.
We've gathered analysts' opinions on Dell Technologies Inc. future price: according to them, DELL price has a max estimate of 200.00 USD and a min estimate of 113.00 USD. Watch DELL chart and read a more detailed Dell Technologies Inc. stock forecast: see what analysts think of Dell Technologies Inc. and suggest that you do with its stocks.
DELL reached its all-time high on May 29, 2024 with the price of 179.70 USD, and its all-time low was 12.92 USD and was reached on Mar 18, 2020. View more price dynamics on DELL chart.
See other stocks reaching their highest and lowest prices.
See other stocks reaching their highest and lowest prices.
DELL stock is 1.82% volatile and has beta coefficient of 2.12. Track Dell Technologies Inc. stock price on the chart and check out the list of the most volatile stocks — is Dell Technologies Inc. there?
Today Dell Technologies Inc. has the market capitalization of 83.90 B, it has decreased by −7.73% over the last week.
Yes, you can track Dell Technologies Inc. financials in yearly and quarterly reports right on TradingView.
Dell Technologies Inc. is going to release the next earnings report on Feb 26, 2026. Keep track of upcoming events with our Earnings Calendar.
DELL earnings for the last quarter are 2.59 USD per share, whereas the estimation was 2.47 USD resulting in a 4.93% surprise. The estimated earnings for the next quarter are 3.52 USD per share. See more details about Dell Technologies Inc. earnings.
Dell Technologies Inc. revenue for the last quarter amounts to 27.00 B USD, despite the estimated figure of 27.15 B USD. In the next quarter, revenue is expected to reach 31.36 B USD.
DELL net income for the last quarter is 1.55 B USD, while the quarter before that showed 1.16 B USD of net income which accounts for 32.99% change. Track more Dell Technologies Inc. financial stats to get the full picture.
Yes, DELL dividends are paid quarterly. The last dividend per share was 0.52 USD. As of today, Dividend Yield (TTM)% is 1.60%. Tracking Dell Technologies Inc. dividends might help you take more informed decisions.
Dell Technologies Inc. dividend yield was 1.72% in 2024, and payout ratio reached 27.91%. The year before the numbers were 1.71% and 32.15% correspondingly. See high-dividend stocks and find more opportunities for your portfolio.
As of Dec 24, 2025, the company has 108 K employees. See our rating of the largest employees — is Dell Technologies Inc. on this list?
EBITDA measures a company's operating performance, its growth signifies an improvement in the efficiency of a company. Dell Technologies Inc. EBITDA is 10.91 B USD, and current EBITDA margin is 10.41%. See more stats in Dell Technologies Inc. financial statements.
Like other stocks, DELL shares are traded on stock exchanges, e.g. Nasdaq, Nyse, Euronext, and the easiest way to buy them is through an online stock broker. To do this, you need to open an account and follow a broker's procedures, then start trading. You can trade Dell Technologies Inc. stock right from TradingView charts — choose your broker and connect to your account.
Investing in stocks requires a comprehensive research: you should carefully study all the available data, e.g. company's financials, related news, and its technical analysis. So Dell Technologies Inc. technincal analysis shows the sell today, and its 1 week rating is neutral. Since market conditions are prone to changes, it's worth looking a bit further into the future — according to the 1 month rating Dell Technologies Inc. stock shows the buy signal. See more of Dell Technologies Inc. technicals for a more comprehensive analysis.
If you're still not sure, try looking for inspiration in our curated watchlists.
If you're still not sure, try looking for inspiration in our curated watchlists.