Siemens Energy: Flag patternHigh Tight Flag for Siemens Energy: This serves as a strong entry signal for a long position. The target is positioned at the yellow resistance area.
TP (Take Profit): 15.500
SL (Stop Loss): 12.730 (flag high)
Next report date
—
Report period
—
EPS estimate
—
Revenue estimate
—
−2.79USD
−4.79 BUSD
32.90 BUSD
544.56 M
About SIEMENS ENERGY AG
Sector
Industry
CEO
Christian Bruch
Website
Headquarters
Munich
Employees (FY)
94 K
Founded
2016
ISIN
DE000ENER6Y0
FIGI
BBG00XRT81M9
Siemens Energy AG engages in the provision of energy technology solutions. It operates through the following segments: Gas Services, Grid Technologies, Transformation of Industry, and Siemens Gamesa. The company was founded in 1866 and is headquartered in Munich, Germany.

ENR halfway to partial recovery, mid-term, still time to runTo Mid and long term investors: (day traders, swingers, flippers and gamblers...this is not for your weak hearts)
The stock never really had meaningful reasons to devalue. Just rumors behind a solid company with plenty of assets and cashflow. Hard times with energy wars waging and still new plans fo

If looking for an opportunity, this could be. Just look.I believe this will close up the gap and continue the upward trend. Siemens Energy will fix the problems and the price gap will be closed in the following weeks.
SIEMENS ENERGY AG NA O.NHello ladies and gentlemen,
XETR:ENR gave us an important signal, wait for the buy signal ichaellah the next months.

ENR Siemens Energy OversoldENR Siemens Energy (Xetra) is currently highly oversold, RSI is above 80, Bollinger Bands are constantly at the upper band - also we do hit now the SMA 200 and entered a support/resistance zone. In my opinion you may think about to create an Alert on this one. Dont forget that Germany is struggling

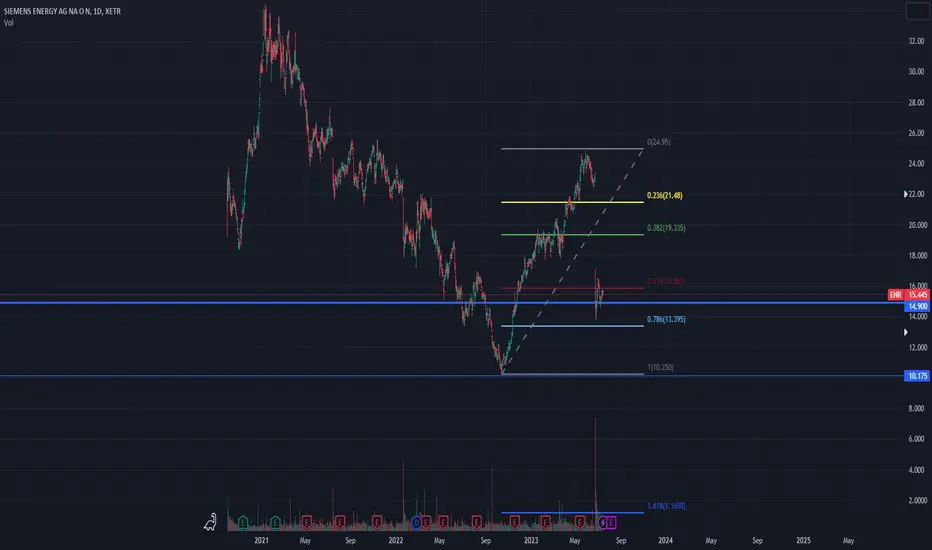
ENR // Inverted shoulder head shoulder formation.Targets are determined according to Fibonacci. Pay attention to the wedge resistance in the weekly time frame.

Siemens Energy - Just some random lines XETR:ENR
Just wanted to see if I can figure out a price trend. Too early to buy? or the current energy crisis could lead to a reversal?


#siemensenergy #enr Great move for energy stocks today
Week 2 of COP26 and it is becoming more and more apparent how important wind energy will be... especially with the price of oil now

Is Siemens Energy building a base? Looks like some kind of base, but we need a bullish breakout and price action to confirm the idea. For now price is still in the thin Kumo, but holding nicely above Kijun Sen.
It is very simple: it needs a break and close above 24.45, where we have the very important weekly Kijun Sen too. Set an

See all ideas
Trade directly on the supercharts through our supported, fully-verified and user-reviewed brokers.


Frequently Asked Questions
The current price of SMEGF is 27.50 USD — it has decreased by 1.79% in the past 24 hours. Watch Siemens Energy AG stock price performance more closely on the chart.
Depending on the exchange, the stock ticker may vary. For instance, on OTC exchange Siemens Energy AG stocks are traded under the ticker SMEGF.
SMEGF stock has risen by 12.24% compared to the previous week, the month change is a 50.03% rise, over the last year Siemens Energy AG has showed a 5.97% increase.
We've gathered analysts' opinions on Siemens Energy AG future price: according to them, SMEGF price has a max estimate of 35.58 USD and a min estimate of 12.41 USD. Watch SMEGF chart and read a more detailed Siemens Energy AG stock forecast: see what analysts think of Siemens Energy AG and suggest that you do with its stocks.
SMEGF reached its all-time high on Jan 13, 2021 with the price of 42.06 USD, and its all-time low was 7.21 USD and was reached on Oct 26, 2023. View more price dynamics on SMEGF chart.
See other stocks reaching their highest and lowest prices.
See other stocks reaching their highest and lowest prices.
SMEGF stock is 2.56% volatile and has beta coefficient of 3.84. Track Siemens Energy AG stock price on the chart and check out the list of the most volatile stocks — is Siemens Energy AG there?
Today Siemens Energy AG has the market capitalization of 22.11 B, it has increased by 3.81% over the last week.
Yes, you can track Siemens Energy AG financials in yearly and quarterly reports right on TradingView.
Siemens Energy AG is going to release the next earnings report on Aug 7, 2024. Keep track of upcoming events with our Earnings Calendar.
SMEGF earnings for the last quarter are 0.10 USD per share, whereas the estimation was 0.15 USD resulting in a −36.37% surprise. The estimated earnings for the next quarter are −0.04 USD per share. See more details about Siemens Energy AG earnings.
Siemens Energy AG revenue for the last quarter amounts to 8.93 B USD despite the estimated figure of 8.89 B USD. In the next quarter revenue is expected to reach 9.16 B USD.
SMEGF net income for the last quarter is 73.37 M USD, while the quarter before that showed 1.71 B USD of net income which accounts for −95.71% change. Track more Siemens Energy AG financial stats to get the full picture.
As of May 16, 2024, the company has 94.00 K employees. See our rating of the largest employees — is Siemens Energy AG on this list?
EBITDA measures a company's operating performance, its growth signifies an improvement in the efficiency of a company. Siemens Energy AG EBITDA is −1.26 B USD, and current EBITDA margin is −5.71%. See more stats in Siemens Energy AG financial statements.
Like other stocks, SMEGF shares are traded on stock exchanges, e.g. Nasdaq, Nyse, Euronext, and the easiest way to buy them is through an online stock broker. To do this, you need to open an account and follow a broker's procedures, then start trading. You can trade Siemens Energy AG stock right from TradingView charts — choose your broker and connect to your account.
Investing in stocks requires a comprehensive research: you should carefully study all the available data, e.g. company's financials, related news, and its technical analysis. So Siemens Energy AG technincal analysis shows the buy rating today, and its 1 week rating is strong buy. Since market conditions are prone to changes, it's worth looking a bit further into the future — according to the 1 month rating Siemens Energy AG stock shows the strong buy signal. See more of Siemens Energy AG technicals for a more comprehensive analysis.
If you're still not sure, try looking for inspiration in our curated watchlists.
If you're still not sure, try looking for inspiration in our curated watchlists.