Our opinion on the current state of NEDNedbank, recognized as the smallest of South Africa's five major banking institutions, boasts a client base exceeding 8 million individuals. Following its separation from Old Mutual on 10th October 2018, which included the latter selling its remaining stake, Nedbank has continued to carve out a dist
Next report date
Report period
H1 2024
EPS estimate
—
Revenue estimate
—
1.77USD
844.72 MUSD
8.22 BUSD
463.80 M
About Nedbank Group, Ltd.
Sector
Industry
CEO
Michael William Thomas Brown
Website
Headquarters
Sandton
Employees (FY)
28.49 K
Founded
1831
ISIN
ZAE000004875
FIGI
BBG000C2N7L7
Nedbank Group Ltd. is a bank holding company, which engages in the provision of financial services through its banking subsidiary, Nedbank Ltd. It operates through the following business segments: Corporate and Investment Banking, Retail and Business Banking, Wealth, Centre, and Africa Regions. The Corporate and Investment Banking segment offers a spectrum of transactional, corporate, investment banking, and market solutions. The Retail and Business Banking segment includes banking assurance products and services, as well as transactional accounts, home loans, vehicle and asset finance, cards, personal loans, and investments. The Wealth segment provides a range of financial services through three divisions of wealth management, asset management, and insurance. The Centre segment consists of various support services. The Africa Regions segment is responsible for the group's banking operations and expansion activities on the rest of the African continent and has client-facing subsidiaries in Eswatini, Lesotho, Namibia, Mozambique, and Zimbabwe. The company was founded in 1831 and is headquartered in Sandton, South Africa.

$JSENED - Nedbank: Still Consolidating SidewaysSee link below for previous update.
Nothing much has changed, price still contained in what looks like a contracting triangle.
I remain neutral as to the direction of the breakout so I will sit on my hands for now.
NEDBANK south Africa chartThe chart herein shows how the NEDBank stock analysis.....
I expect the stock to keep rising to the top. I will thereafter relook at the chart once we hit the top.
Kindly also check teir financials from website
Good luck

NEDBANK - Great performance!The stock has continued to fetch prices since the R195 major support (double bottom) posted in the idea below. We at the top of a channel and major resistance just above at R236. As always, price action will be key to see if the momentum is likely to continue.

NEDNedbank Group Ltd (NED) - Multi-month base with a pivot of 21800c, targeting upside of 23800c (or thereabout). Risk below 20600c.

NEDBANK -- Double Bottom?Price has formed a decent looking double bottom at a key support zone.
We closed above the 20ema daily yesterday so I'll be looking for a continuation today to target
initially R205.50 then R208.50
A daily close below R194 invalidates the idea.

NED MonthlyA chart from today's research. For more research insights, including trade ideas, get in touch today.
Wednesday 25-October-2023, 10h20
Nedbank Group (NED, 19730c). Monthly Chart.
The R200 level is one which I have highlighted in recent months as one to monitor for downside risk. This is a range t

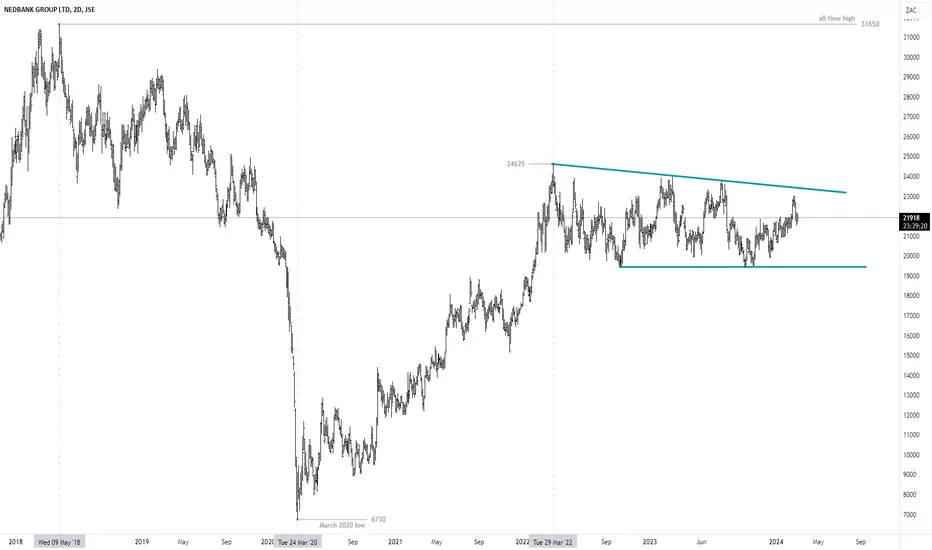
$JSENED - Nedbank: Sideways Consolidation Nedbank had a stellar two year bull run from March 2020 to March 2022.
The consolidation pattern from 24625 looks like a barrier triangle but it can also be viewed as a horizontal rectangle depending on where one starts the upper trendline.
There is no clear direction at this moment so I will sit

NED View #2 (Long Term)Published this morning on our client platform. For more research insights, including trade ideas, get in touch today.
Nedbank Group. View #2 (Long Term): Analyzing the weekly chart, I've noticed that the 14-week RSI is at a 3-year low. New highs on the RSI are bullish. New lows on the RSI are beari

NED View #1 (Short Term)Published this morning on our client platform. For more research insights, including trade ideas, get in touch today.
Tuesday 19-Sep-2023, 08h14 Nedbank (NED, 20107c). Technical views on both the short term and long term time frames. View #1 (Short Term): At yesterday's close of trade, the Tactica

See all ideas
Trade directly on the supercharts through our supported, fully-verified and user-reviewed brokers.


Curated watchlists where NDBKF is featured.

Frequently Asked Questions
The current price of NDBKF is 10.80 USD — it has increased by 1.52% in the past 24 hours.
Depending on the exchange, the stock ticker may vary. For instance, on OTC exchange Nedbank Group, Ltd. stocks are traded under the ticker NDBKF.
Nedbank Group, Ltd. is going to release the next earnings report on Aug 6, 2024. Keep track of upcoming events with our Earnings Calendar.
NDBKF stock is 1.52% volatile and has beta coefficient of 0.91. Check out the list of the most volatile stocks — is Nedbank Group, Ltd. there?
NDBKF earnings for the last quarter are 0.78 USD per share, whereas the estimation was 0.81 USD resulting in a −3.55% surprise. The estimated earnings for the next quarter are 0.91 USD per share. See more details about Nedbank Group, Ltd. earnings.
Nedbank Group, Ltd. revenue for the last quarter amounts to 1.78 B USD despite the estimated figure of 1.94 B USD. In the next quarter revenue is expected to reach 1.97 B USD.
Yes, you can track Nedbank Group, Ltd. financials in yearly and quarterly reports right on TradingView.
NDBKF stock has fallen by 10.46% compared to the previous week, the month change is a 14.49% fall, over the last year Nedbank Group, Ltd. has showed a 0.03% decrease.
NDBKF net income for the last quarter is 441.71 M USD, while the quarter before that showed 390.45 M USD of net income which accounts for 13.13% change. Track more Nedbank Group, Ltd. financial stats to get the full picture.
Today Nedbank Group, Ltd. has the market capitalization of 5.24 B, it has decreased by 0.23% over the last week.
Nedbank Group, Ltd. dividend yield was 8.75% in 2023, and payout ratio reached 58.44%. The year before the numbers were 7.76% and 56.19% correspondingly. See high-dividend stocks and find more opportunities for your portfolio.
Like other stocks, NDBKF shares are traded on stock exchanges, e.g. Nasdaq, Nyse, Euronext, and the easiest way to buy them is through an online stock broker. To do this, you need to open an account and follow a broker's procedures, then start trading. You can trade Nedbank Group, Ltd. stock right from TradingView charts — choose your broker and connect to your account.
As of Apr 26, 2024, the company has 28.49 K employees. See our rating of the largest employees — is Nedbank Group, Ltd. on this list?
Investing in stocks requires a comprehensive research: you should carefully study all the available data, e.g. company's financials, related news, and its technical analysis. So Nedbank Group, Ltd. technincal analysis shows the sell today, and its 1 week rating is sell. Since market conditions are prone to changes, it's worth looking a bit further into the future — according to the 1 month rating Nedbank Group, Ltd. stock shows the sell signal. See more of Nedbank Group, Ltd. technicals for a more comprehensive analysis.
If you're still not sure, try looking for inspiration in our curated watchlists.
If you're still not sure, try looking for inspiration in our curated watchlists.
We've gathered analysts' opinions on Nedbank Group, Ltd. future price: according to them, NDBKF price has a max estimate of 16.22 USD and a min estimate of 12.78 USD. Read a more detailed Nedbank Group, Ltd. forecast: see what analysts think of Nedbank Group, Ltd. and suggest that you do with its stocks.