WCP // Bowl formation Let's look for closing above 11.39Although there is a bowl formation on the chart, let's look for a close above 11.39.
Next report date
Report period
Q2 2024
EPS estimate
0.22USD
Revenue estimate
574.40 MUSD
0.84USD
670.75 MUSD
2.44 BUSD
590.10 M
About WHITECAP RESOURCES INC
Sector
Industry
CEO
Grant Bradley Fagerheim
Website
Headquarters
Calgary
Employees (FY)
542
Founded
2008
FIGI
BBG000H8N7K0
Whitecap Resources, Inc. engages in the acquisition, development, and production of crude oil and natural gas. The company was founded by Grant B. Fagerheim on June 3, 2008, and is headquartered in Calgary, Canada.

WCP longLooking for a break of the smaller trend line for the next run on wave. Not entirely sure if the H&S pattern is valid. Be interested to hear opinions. Bouncing up the fib ladder nicely. Target 50% then H&S pattern limit - Blue line.

Whitecap's silver liningOil, Oil, everywhere, and not a drop to drink.
Pretty obviously breakout pending.
Position:April 16 $5 Call contracts at 0.60 each ($60 each).
PT1 = $6.82 (sell 2 contracts of 3). Potential gain of 300%.
PT2 = $8.26 = PT of 500%
Stop loss at $4.44. We'd likely lose around 50% of the initial inves

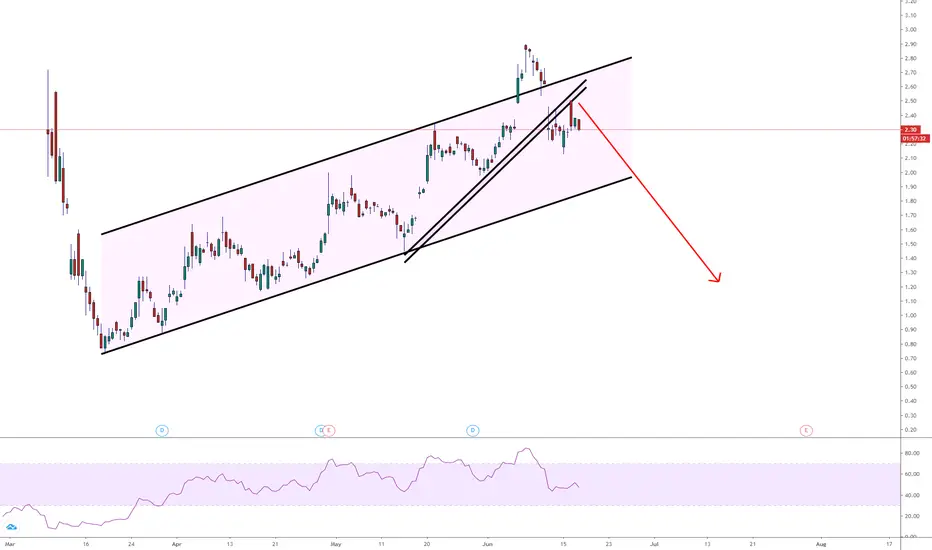
WCP awaiting good entry price. Presently trading in centre of channel. Awaiting for price to drop to lower end of channel.
Indicators show price moving to the lower end of the channel as usual. MACD and RsI dipping into the 0 lines.
Awaiting good point for entry.


Whitecap continued weaknessWaiting for a support level to hold and or bullish divergence to give a sign that a bottom is in. Sentiment in the sector is so negative that a tradeable bounce should occur

WCP - Neutral BullishWCP Observation - Neutral bullish here. Just like the set up. Tapping the trendline again and has poped from the trend-line historically. MACD looks to be slowly turning. RSI is not oversold but looks reset here. Observation shows alot more factors to the upside rather the downside. Just need to hol

See all ideas
Trade directly on the supercharts through our supported, fully-verified and user-reviewed brokers.


Frequently Asked Questions
The current price of SPGYF is 7.89 USD — it has decreased by 0.88% in the past 24 hours.
Depending on the exchange, the stock ticker may vary. For instance, on OTC exchange Whitecap Resources, Inc. stocks are traded under the ticker SPGYF.
Whitecap Resources, Inc. is going to release the next earnings report on Jul 24, 2024. Keep track of upcoming events with our Earnings Calendar.
SPGYF stock is 1.40% volatile and has beta coefficient of 0.88. Check out the list of the most volatile stocks — is Whitecap Resources, Inc. there?
SPGYF earnings for the last quarter are 0.37 USD per share, whereas the estimation was 0.23 USD resulting in a 58.06% surprise. The estimated earnings for the next quarter are 0.19 USD per share. See more details about Whitecap Resources, Inc. earnings.
Whitecap Resources, Inc. revenue for the last quarter amounts to 689.69 M USD despite the estimated figure of 593.10 M USD. In the next quarter revenue is expected to reach 534.61 M USD.
Yes, you can track Whitecap Resources, Inc. financials in yearly and quarterly reports right on TradingView.
SPGYF stock has risen by 3.93% compared to the previous week, the month change is a 6.33% rise, over the last year Whitecap Resources, Inc. has showed a 2.33% increase.
SPGYF net income for the last quarter is 44.14 M USD, while the quarter before that showed 225.07 M USD of net income which accounts for −80.39% change. Track more Whitecap Resources, Inc. financial stats to get the full picture.
Today Whitecap Resources, Inc. has the market capitalization of 4.76 B, it has decreased by 0.20% over the last week.
Yes, SPGYF dividends are paid monthly. The last dividend per share was 0.04 USD. As of today, Dividend Yield (TTM)% is 6.02%. Tracking Whitecap Resources, Inc. dividends might help you take more informed decisions.
Whitecap Resources, Inc. dividend yield was 6.96% in 2023, and payout ratio reached 42.00%. The year before the numbers were 3.59% and 14.17% correspondingly. See high-dividend stocks and find more opportunities for your portfolio.
Like other stocks, SPGYF shares are traded on stock exchanges, e.g. Nasdaq, Nyse, Euronext, and the easiest way to buy them is through an online stock broker. To do this, you need to open an account and follow a broker's procedures, then start trading. You can trade Whitecap Resources, Inc. stock right from TradingView charts — choose your broker and connect to your account.
As of Apr 26, 2024, the company has 542.00 employees. See our rating of the largest employees — is Whitecap Resources, Inc. on this list?
Investing in stocks requires a comprehensive research: you should carefully study all the available data, e.g. company's financials, related news, and its technical analysis. So Whitecap Resources, Inc. technincal analysis shows the buy rating today, and its 1 week rating is strong buy. Since market conditions are prone to changes, it's worth looking a bit further into the future — according to the 1 month rating Whitecap Resources, Inc. stock shows the strong buy signal. See more of Whitecap Resources, Inc. technicals for a more comprehensive analysis.
If you're still not sure, try looking for inspiration in our curated watchlists.
If you're still not sure, try looking for inspiration in our curated watchlists.
We've gathered analysts' opinions on Whitecap Resources, Inc. future price: according to them, SPGYF price has a max estimate of 10.98 USD and a min estimate of 8.42 USD. Read a more detailed Whitecap Resources, Inc. forecast: see what analysts think of Whitecap Resources, Inc. and suggest that you do with its stocks.
EBITDA measures a company's operating performance, its growth signifies an improvement in the efficiency of a company. Whitecap Resources, Inc. EBITDA is 1.40 B USD, and current EBITDA margin is 59.75%. See more stats in Whitecap Resources, Inc. financial statements.