SPX – Investors Are Still Willing to Pay for GrowthSPX continues to display an investment-driven bullish structure rather than simply a short-term rally . Recent pullbacks have yet to show any meaningful signs of capital leaving the market. Instead, buyers continue to step in at lower prices, suggesting that investors are using weakness to adjust a
S&P 500 Index
No trades
No trades
Index info
Standard & Poor’s 500 is an American stock market index consisting of 500 large companies having common stock listed on the NYSE or NASDAQ and their market capitalizations. It captures approximately 80% coverage of available market capitalization. Because it includes both growth stocks and value stocks it is one of the most followed equity indices and is considered to be one of the best representations of the U.S. stock market and a trend indicator for the U.S. economy. S&P introduced its first index in 1923 and its present day form on March 4,1957. It was developed and continues to maintained by S&P Dow Jones Indices, a joint venture majority owned by McGraw Hill Financial.
US500 :Bond Market Stress Builds-7,645 Is the Key LevelUS500 :Bond Market Stress Builds-7,645 Is the Key Level
Today, 10-year Treasury yields briefly hit 5.31% earlier in the day, the highest since 2007. That leaves borrowing costs at uncomfortable levels for stocks, as Treasuries suffered their worst quarter since 1994.
The pressure on US Treasury y
SP500 Consolidation Bearish Pressure Pattern SP500 is showing repeated rejection from the 7,700–7,750 resistance/trading-range area, keeping short-term price action under pressure.
Tecnically current weakness is also supported by the broader macro environment. On September 29, 2026, U.S. Treasury yields pushed to multi-year highs, with the 10
S&P500 This break-out can drop it to 7100 by Midterms.The S&P500 (SPX) is at a critical bearish break-out point where in early February made a decisive drop that kick-started the Feb-March U.S. - Iran War correction to the 1W MA70 (red trend-line).
As you can see both fractals started within a Channel Up and the latest common characteristic has been l
S&P 500 Looks Very Bullish (3H)From the point where we placed the red arrow on the chart, a corrective structure has been developing on the .
Based on the current price action and the internal structure of the correction, this movement appears to be forming a Double Combination. The market has already completed a significant po
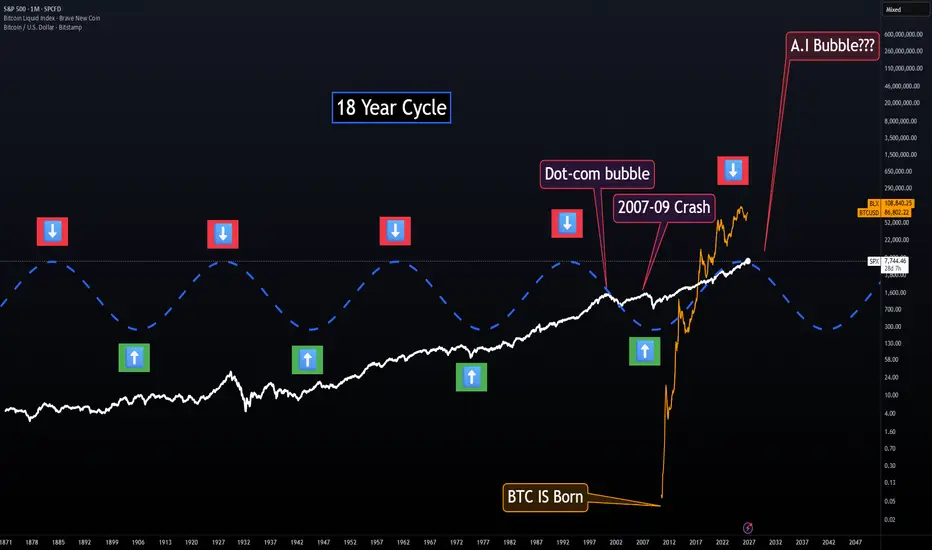
18-Year Cycle — Visual ModelThis is an easy-to-read visual version of my 18-Year Cycle model.
If you’re a visual person like me, this unfinished version makes the cycle much easier to see. The green arrows represent the stronger/good periods of the cycle, while the red arrows represent the higher-risk periods where major mark
See all ideas
Displays a symbol's value movements over previous years to identify recurring trends.
Frequently asked questions
S&P 500 Index reached its highest quote on Aug 13, 2026 — 7,817.45 USD. See more data on the S&P 500 Index chart.
The lowest ever quote of S&P 500 Index is 666.80 USD. It was reached on Mar 5, 2009. See more data on the S&P 500 Index chart.
S&P 500 Index is just a number that lets you track performance of the instruments comprising the index, so you can't invest in it directly. But you can buy S&P 500 Index futures or funds or invest in its components.