US 10Y TREASURY: space for further relaxation?During the previous period the market was trying to price its expectations of a less than three rate cuts during the course of this year, giving up on the Fed's announcement from the latest FOMC meeting. The meeting held on May 1st, showed that the market was right in its assumptions, considering th

The future of Interest RatesRough map pf rate expectation without pretension of accuracy for dates nor timing...

Huge potential implications from YIELD SPREADS (US10y-DE10y)Folks know how I feel about very long term (multi year/decade+) outlook for inflation and yields - they are going higher.
And I have called for higher yields (and spreads) and thus dollar so far this year.
BUT BUT BUT
The yield spread chart is suggesting a potential divergent high which could hav

Powell pullback as Fed will slow QT.The critical support level to watch here is the 50-day MA at 4.38%, as a failed break below this yield will allow yields to spike to 5% off the back of a continued sell-off in US long-term paper despite the Feds efforts to aid the US bond market. Keep an eye on the tail in this week’s US 10-year not

US10Y - Bullish Sentiment ShiftWith predominantly bearish price action during the week, intraday sentiment is more shifted towards a continuation to the downside at this current time.
Due to higher time frame narrative, I am looking out for a retracement to 4.563% hourly fair value gap.
Candle body closure below 4.455% will neg

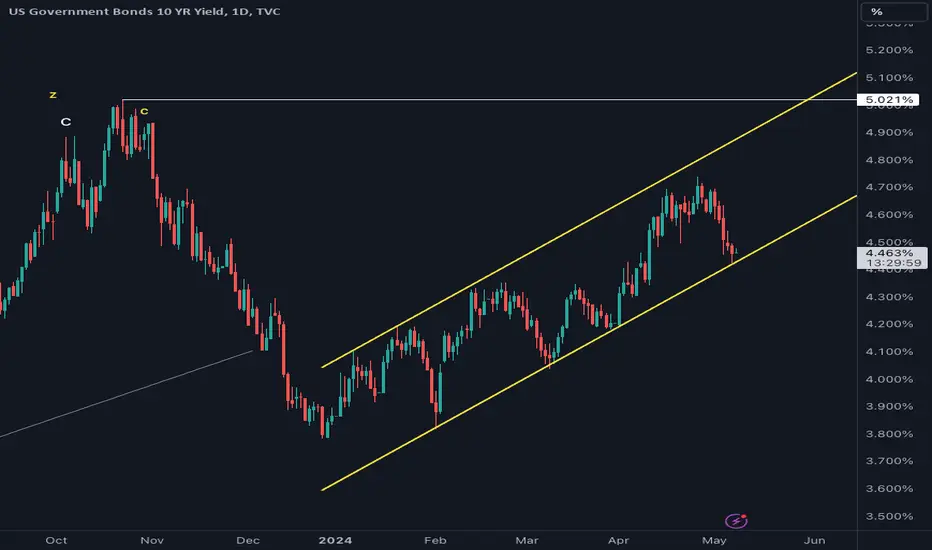
stagflation pattern or parallel channelrate is moving up in yellow parallel channel
lower yellow line is working as perfect trend line
in recent may fomc fed has said he neither see stag or flation
if there are no hike in future then lower trend line must break
if second wave of rate hike is coming then trend line must hold and it can
US10 yield is "far" from long term "peak". 9/May/24US10Y > 8% what happen for those house/ car mortgage? What happen to #gold when big player have "guaranteed" in bank deposits? What happen to "healthy" bank's "stock"?..

US 10Y TREASURY: all eyes on FedReleased data for the US economy during the previous week could point to the stagflation moment in the US during the course of this year. Posted data for core Personal Consumption Expenditures Price index show that in March it increased by 2.8% on a yearly basis, from 2.6% expected by the markets. A

US10Y - Sloppy Bearish BiasThe weekly range spans from 4.570% - 4.739% and with the weekly EQ being tagged alongside buyside getting swiped, I am scoping out for the daily order block which is near the weekly sellside @ 4.593% and the second target being the lows at 4.570%.
Some form of a pullback into the lower displaceme

Rates not looking to slow down, but have to be lowered, dilemma Short term #yield is higher.
Long term has turned & are catching a bid.
At the moment it doesn't look like they're going down any time soon & that is not good longer term.
Was speaking with loan officer yesterday & they believe they must lower before election. But, what if it goes higher before it

See all ideas

Frequently Asked Questions
United States 10 Year Government Bonds trade at 99'00'0 USD. See more price dynamics on the chart.
You can buy United States 10 Year Government Bonds through brokers — choose the one that suits your needs and go ahead. You can also purchase bonds directly from the issuing organization. Closely track the price dynamics and market news before making any decision.
The current yield rate is 4.500% — it's decreased by 1.94% over the past week.
Maturity date is when a debt comes due and all principal and/or interest must be repaid to creditors. For example, the United States 10 Year Government Bonds maturity date is May 15, 2034.
The current yield of United States 10 Year Government Bonds is 4.500%, whereas at the moment of issuance it was 3.520%, which means 27.84% change. Over the week the yield has decrased by 1.94%, the month performance has showed a 1.06% decrease, and it has risen by 32.82% over the year.
A bond is a debt security issued by a corporation or a government. By buying bonds, investors loan the issuer money in return for an interest rate. By issuing bonds, the state receives funds that can then be injected into the economy, and corporations raise funds for new research or other operational activities. The alphanumeric code of government bonds represents the abbreviated name of the issuing state, as well as its time to maturity. For example, United States 10 Year Government Bonds is the US government bonds with the maturity of 10 years.
Bonds can be of various maturities, e.g. short-term (less than three years), medium-term (four to 10 years), or long-term ones (more than 10 years). So United States 10 Year Government Bonds are medium-term bonds — they have the maturity of 10 years.