Visa (V): Emerging Uptrend Backed by Exceptional FundamentalsVisa is showing renewed technical strength, marked by the formation of higher highs and higher lows, with price action firmly holding above both the 20- and 50-day EMAs. This move follows a decisive breakout from a prolonged downtrend, signaling a shift in market structure toward a bullish trend. In
Next report date
—
Report period
—
EPS estimate
—
Revenue estimate
—
10.22 USD
19.85 B USD
40.00 B USD
1.68 B
About Visa Inc.
Sector
Industry
CEO
Ryan McInerney
Website
Headquarters
San Francisco
Founded
1958
IPO date
Mar 19, 2008
IPO offer price
44.00 USD
Identifiers
3
ISINUS92826C8394
Visa, Inc engages in the provision of digital payment services. It also facilitates global commerce through the transfer of value and information among global network of consumers, merchants, financial institutions, businesses, strategic partners, and government entities. It offers debit card, credit card, prepaid products, commercial payment solutions, and global automated teller machine (ATM). The company was founded by Dee Hock in 1958 and is headquartered in San Francisco, CA.
Related stocks

Short sell Visa!!!
If the price rises as expected, then short it. Why do I have this expectation? The principle stems from the order imbalance reaching its limit.I'm from China, but there are too few traders in the Chinese community, and I'm not very good at English. I try my best to explain my ideas using translatio

Is Visa Ready for a Deeper Drop? Key Daily Levels in Focus👋 Hello & Respect to All Traders
Hello and respect to all traders and dedicated TradingView followers 🙌
Wishing you disciplined trades, solid risk management, and consistent execution 📊🧠
💳 Visa Inc. – Company Overview
Visa Inc. (V) is one of the world’s largest electronic payment networks, provid

Visa: Completing Correction, Upside Potential AheadVisa Inc. is a global payments technology company that operates one of the world’s largest electronic payment networks. It enables secure electronic transactions between consumers, merchants, and banks in over 200 countries, focusing on fast, reliable, and cashless payments.
Visa has pulled back ro
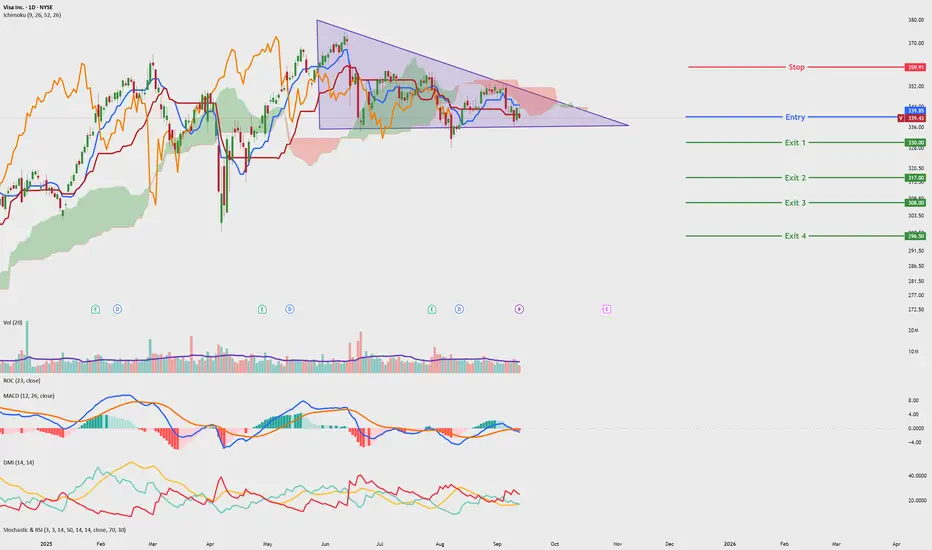
Visa - Potential drop from descending triangleV - Potential Bear Swing
Timeframe - 1 weeks to 3 months
Volume
- Maintained volume
Price Action + Trend
- bullish trend broken
- Price broken out of downtrend line
Ichimoku
- Lagging, base and conversion line below kumo
- Kumo cloud thinning and red cloud forming
Patterns
- Descending trian
V - Can we see a new ATH?=======
Volume
=======
-Neutral
==========
Price Action
==========
- Price broke out of falling wedge
- Rounded bottom observed
- Triple bottom observed
=========
Oscillators
=========
- Ichimoku, price above cloud, green kumo expanding, base + conv + lagging piercing clouds upwards
- MACD bull

Visa (V) breaks out from a year-long symmetricalV has spent almost a year consolidating inside a symmetrical triangle. Today’s candle shows a breakout above the downtrend line.

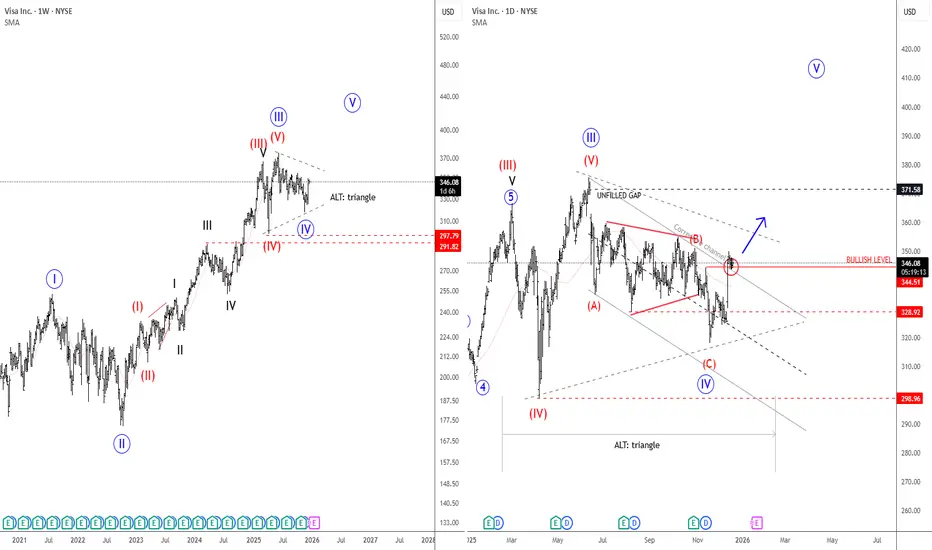
Visa: More Upside PotentialVisa’s blue wave (x) still has significant upside potential before reaching its peak. With price still trading below our resistance level at $375.51, we expect the subsequent wave (y) to take over and guide the stock into our green Long Target Zone between $292.19 and $266.47. Within this range, we

Visa great macro buyVisa presents an opportunity while the world is focused on mag 7 and big tech. I have been slowly diversifying my portfolio away from this by adding stocks like BN and V. I believe visa will perform well in a market downturn and or during re inflation or recession fears. The 21 week ema is a great b


See all ideas
Summarizing what the indicators are suggesting.
Neutral
SellBuy
Strong sellStrong buy
Strong sellSellNeutralBuyStrong buy
Neutral
SellBuy
Strong sellStrong buy
Strong sellSellNeutralBuyStrong buy
Neutral
SellBuy
Strong sellStrong buy
Strong sellSellNeutralBuyStrong buy
An aggregate view of professional's ratings.
Neutral
SellBuy
Strong sellStrong buy
Strong sellSellNeutralBuyStrong buy
Neutral
SellBuy
Strong sellStrong buy
Strong sellSellNeutralBuyStrong buy
Neutral
SellBuy
Strong sellStrong buy
Strong sellSellNeutralBuyStrong buy
Displays a symbol's price movements over previous years to identify recurring trends.
3V69
Visa Inc. 3.65% 15-SEP-2047Yield to maturity
5.41%
Maturity date
Sep 15, 2047
US92826CAQ5
Visa Inc. 2.0% 15-AUG-2050Yield to maturity
5.41%
Maturity date
Aug 15, 2050
V4972835
Visa Inc. 2.7% 15-APR-2040Yield to maturity
4.97%
Maturity date
Apr 15, 2040
US92826CAE2
Visa Inc. 4.15% 14-DEC-2035Yield to maturity
4.52%
Maturity date
Dec 14, 2035
XS306372505
Visa Inc. 3.875% 15-MAY-2044Yield to maturity
4.16%
Maturity date
May 15, 2044
V4972836
Visa Inc. 2.05% 15-APR-2030Yield to maturity
3.91%
Maturity date
Apr 15, 2030
V5028512
Visa Inc. 1.1% 15-FEB-2031Yield to maturity
3.91%
Maturity date
Feb 15, 2031
XS306372475
Visa Inc. 3.5% 15-MAY-2037Yield to maturity
3.59%
Maturity date
May 15, 2037
3V6A
Visa Inc. 2.75% 15-SEP-2027Yield to maturity
3.55%
Maturity date
Sep 15, 2027
V4972834
Visa Inc. 1.9% 15-APR-2027Yield to maturity
3.50%
Maturity date
Apr 15, 2027
XS306372459
Visa Inc. 3.125% 15-MAY-2033Yield to maturity
3.31%
Maturity date
May 15, 2033
See all V bonds
Curated watchlists where V is featured.


Frequently Asked Questions
The current price of V is 346.48 USD — it has decreased by −1.21% in the past 24 hours. Watch Visa Inc. stock price performance more closely on the chart.
Depending on the exchange, the stock ticker may vary. For instance, on NYSE exchange Visa Inc. stocks are traded under the ticker V.
V stock has fallen by −2.43% compared to the previous week, the month change is a 5.12% rise, over the last year Visa Inc. has showed a 9.03% increase.
We've gathered analysts' opinions on Visa Inc. future price: according to them, V price has a max estimate of 450.00 USD and a min estimate of 327.00 USD. Watch V chart and read a more detailed Visa Inc. stock forecast: see what analysts think of Visa Inc. and suggest that you do with its stocks.
V stock is 2.10% volatile and has beta coefficient of 0.89. Track Visa Inc. stock price on the chart and check out the list of the most volatile stocks — is Visa Inc. there?
Today Visa Inc. has the market capitalization of 662.55 B, it has decreased by −0.52% over the last week.
Yes, you can track Visa Inc. financials in yearly and quarterly reports right on TradingView.
Visa Inc. is going to release the next earnings report on Jan 22, 2026. Keep track of upcoming events with our Earnings Calendar.
V earnings for the last quarter are 2.98 USD per share, whereas the estimation was 2.97 USD resulting in a 0.40% surprise. The estimated earnings for the next quarter are 3.14 USD per share. See more details about Visa Inc. earnings.
Visa Inc. revenue for the last quarter amounts to 10.72 B USD, despite the estimated figure of 10.62 B USD. In the next quarter, revenue is expected to reach 10.68 B USD.
V net income for the last quarter is 5.04 B USD, while the quarter before that showed 5.22 B USD of net income which accounts for −3.41% change. Track more Visa Inc. financial stats to get the full picture.
Yes, V dividends are paid quarterly. The last dividend per share was 0.67 USD. As of today, Dividend Yield (TTM)% is 0.70%. Tracking Visa Inc. dividends might help you take more informed decisions.
Visa Inc. dividend yield was 0.69% in 2025, and payout ratio reached 23.37%. The year before the numbers were 0.76% and 21.69% correspondingly. See high-dividend stocks and find more opportunities for your portfolio.
As of Jan 3, 2026, the company has 34.1 K employees. See our rating of the largest employees — is Visa Inc. on this list?
EBITDA measures a company's operating performance, its growth signifies an improvement in the efficiency of a company. Visa Inc. EBITDA is 28.09 B USD, and current EBITDA margin is 70.22%. See more stats in Visa Inc. financial statements.
Like other stocks, V shares are traded on stock exchanges, e.g. Nasdaq, Nyse, Euronext, and the easiest way to buy them is through an online stock broker. To do this, you need to open an account and follow a broker's procedures, then start trading. You can trade Visa Inc. stock right from TradingView charts — choose your broker and connect to your account.
Investing in stocks requires a comprehensive research: you should carefully study all the available data, e.g. company's financials, related news, and its technical analysis. So Visa Inc. technincal analysis shows the buy rating today, and its 1 week rating is buy. Since market conditions are prone to changes, it's worth looking a bit further into the future — according to the 1 month rating Visa Inc. stock shows the buy signal. See more of Visa Inc. technicals for a more comprehensive analysis.
If you're still not sure, try looking for inspiration in our curated watchlists.
If you're still not sure, try looking for inspiration in our curated watchlists.