
Coronavirus disease (COVID-19) is a global problem and there’s no need for us at TradingView to tell you just how serious it is. In response to the ongoing global health crisis affecting millions of people worldwide in over 150 countries, we are working on a number of ways to show the extent of the emergency through data visualization. We’re all waiting for the bearish trend on this one.
Coronavirus charts
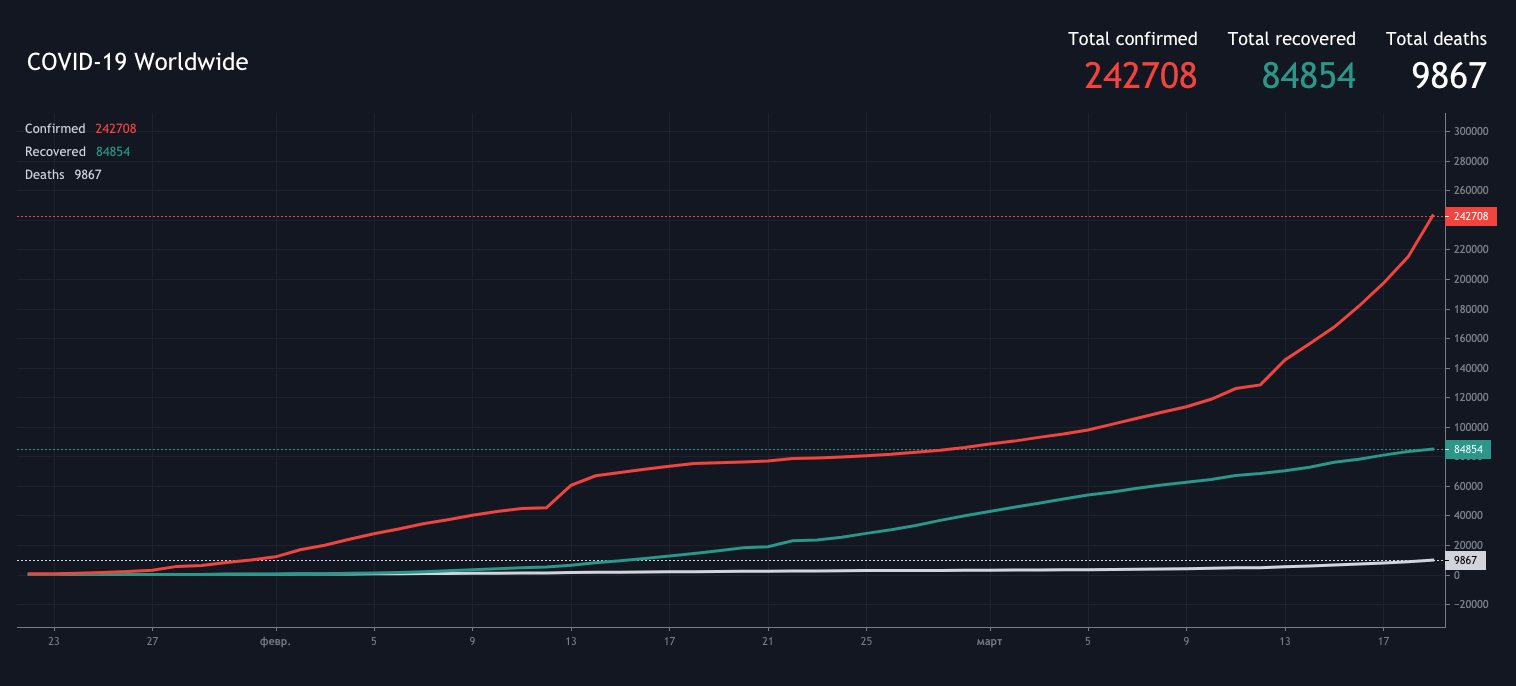
Drawing on real-time data collected by the Center for Systems Science and Engineering (CSSE) at Johns Hopkins University we’ve made a dashboard of lightweight charts, showing the number of infections, deaths and recoveries, broken down by country.
Check out COVID-19 Charts and statistics.
Coronavirus tickers on TradingView
You will now be able to add COVID-19 stats (both global and for a specific country) right on our platform and manipulate the data how you like. For example, you’ll be able to plot the rate of infection in America against the S&P 500 Index.
You can find all the symbols related to the virus outbreak if you start typing COVID19: into the symbol search bar. These include the number of confirmed cases, people who have recovered and deaths for each country, plus the total number of all case types across the world.

Stay safe
See the latest information from the World Health Organization so you can help prevent the spread of coronavirus: go to who.int