
A new ‘box’ drawing has been added to Pine, making it super easy to draw rectangles on charts using the Pine syntax.
//@version=4
study("Box Example", overlay=true)
c_green = color.rgb(33, 150, 243, 80)
ll = lowest(10)
hh = highest(10)
b1 = box(na)
if barstate.islast
    b1 := box.new(bar_index[9], hh, bar_index, ll,
     bgcolor=c_green, border_style=line.style_dashed)
    box.delete(b1[1])

Several new functions have been added to draw and control all the available parameters of the new drawing: for more details see the Pine Script reference and the Pine Script documentation.
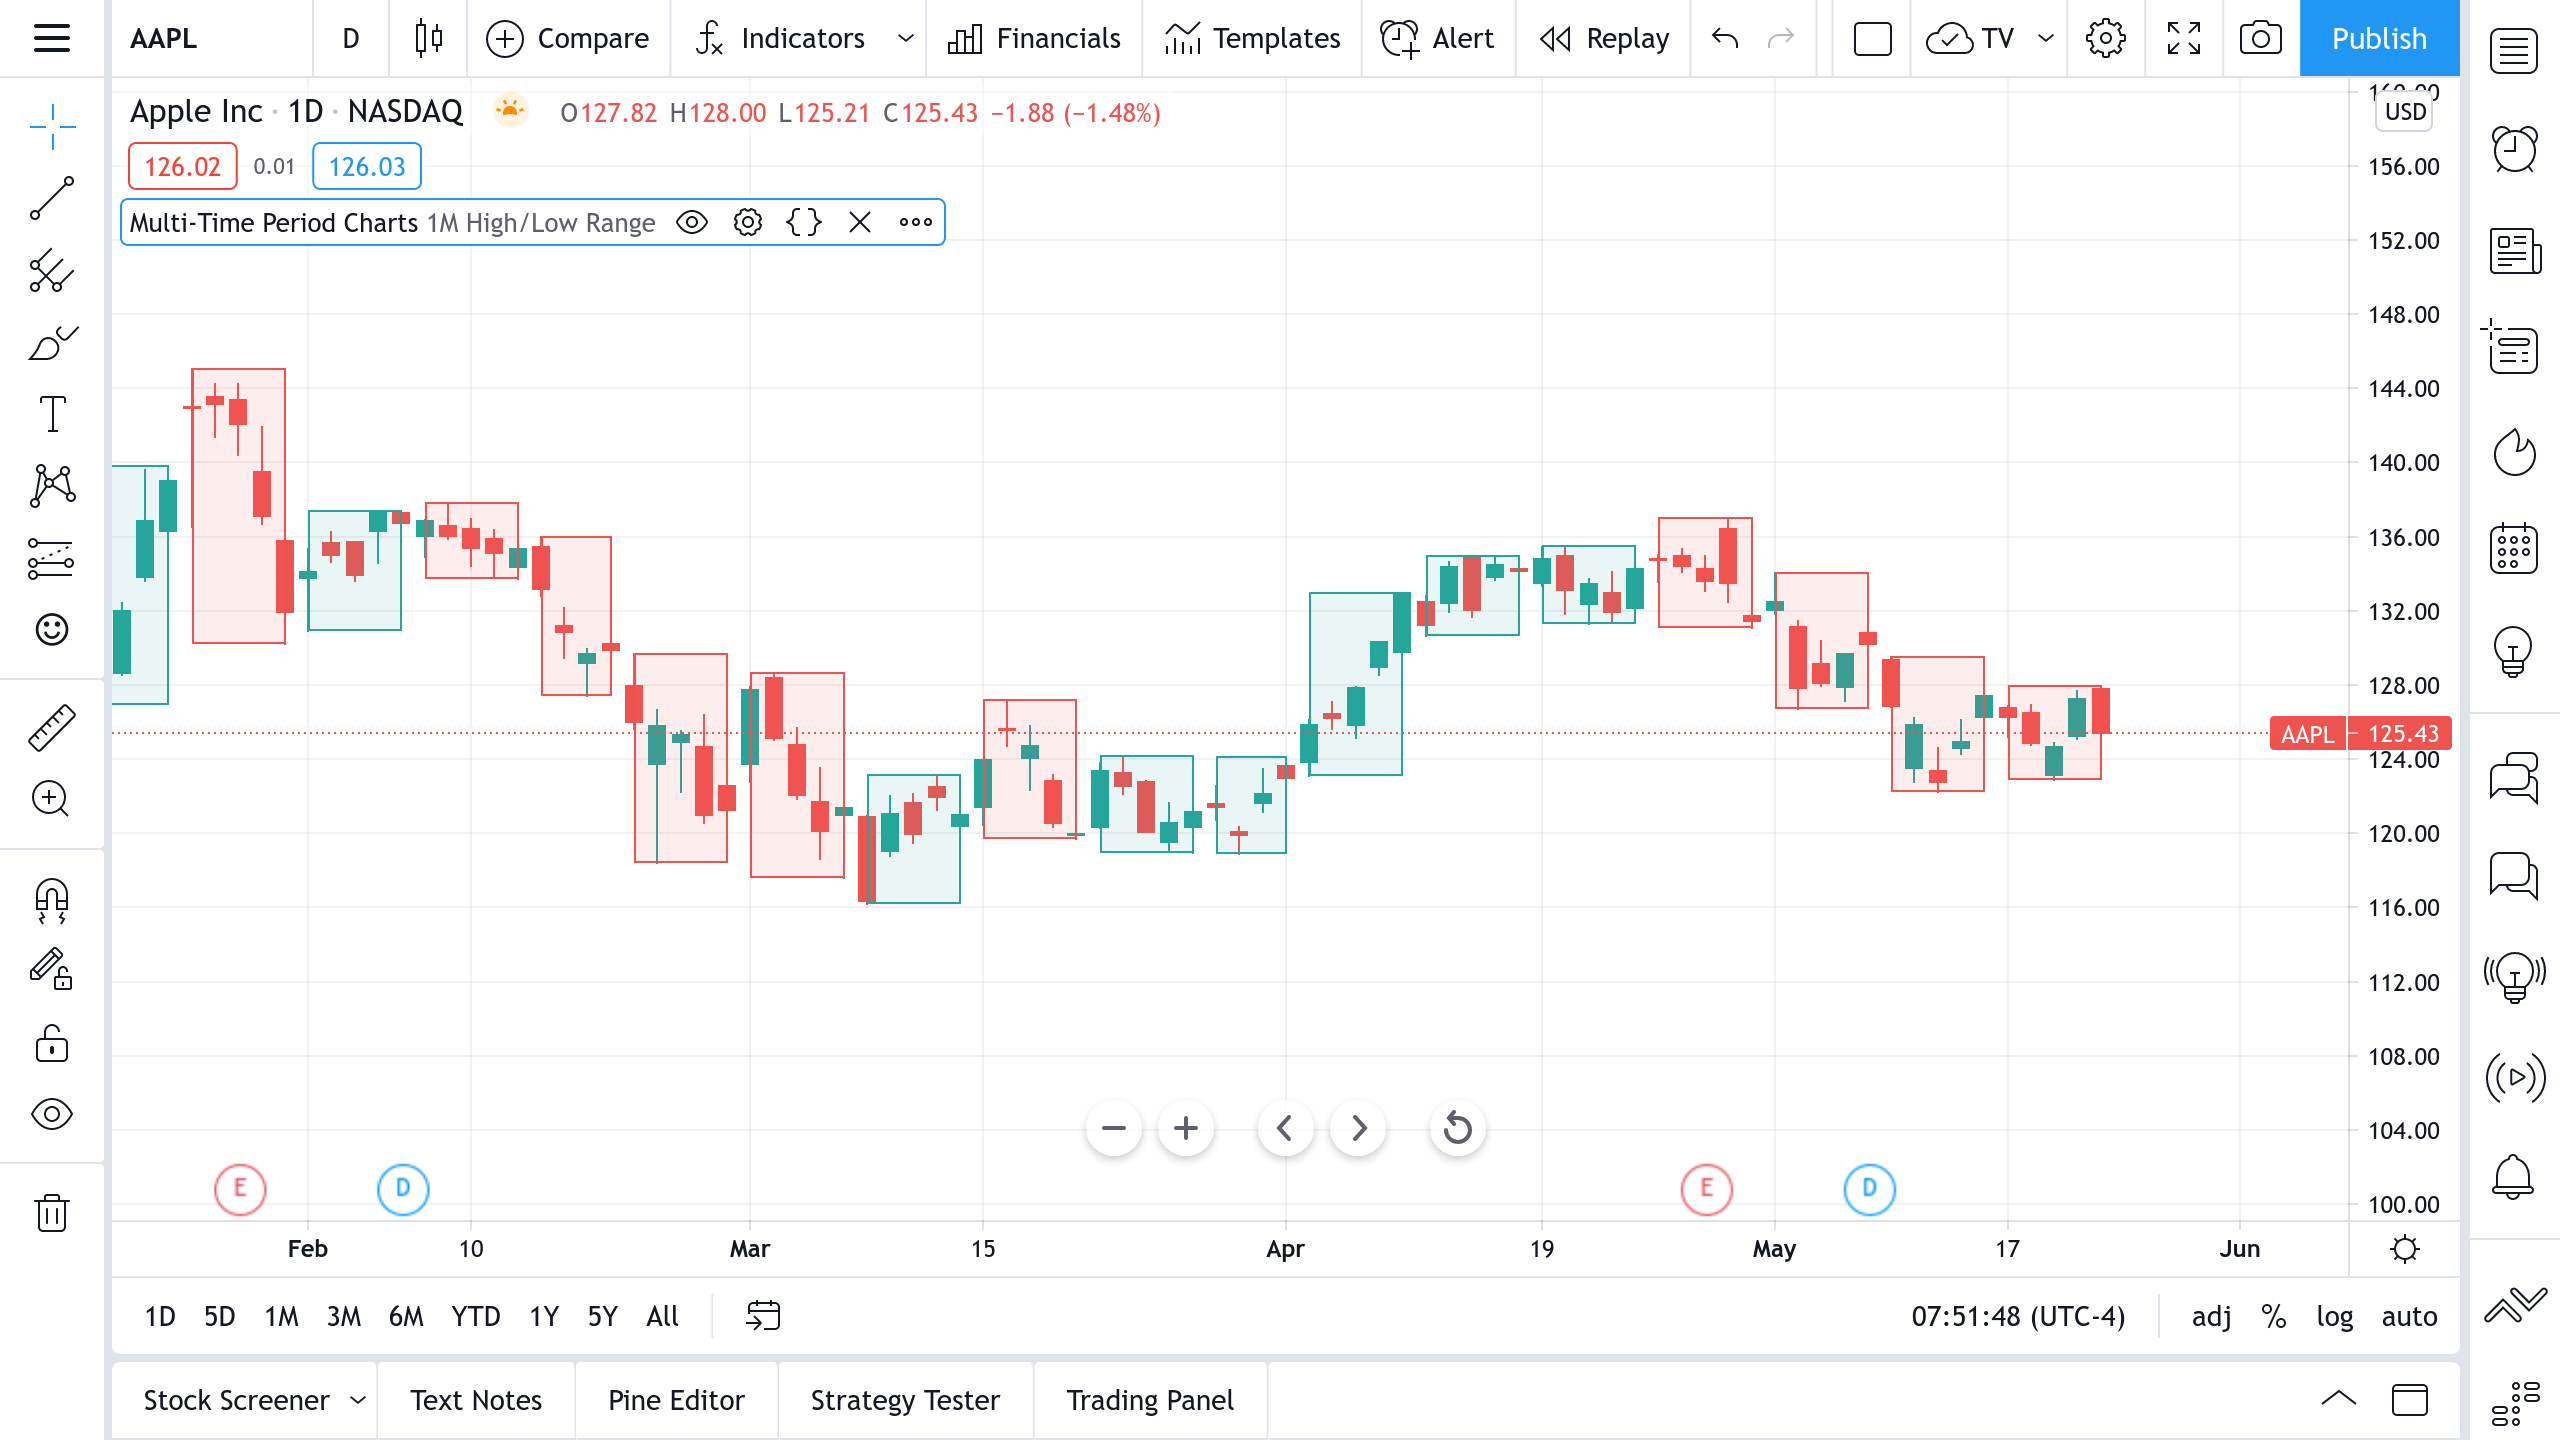
We’ve also updated the built-in Multi-Time Period Charts indicator to add support for the new drawing. Now its source code is available on Pine and you can use it as an example.
We hope you find the new features useful. And please do keep giving us feedback and suggestions — we’re building TradingView for you, and we’re always keen to know what you think about our platform updates.