The AI Bubble's Final Act: Why  SPX 6,700 May Be the Top
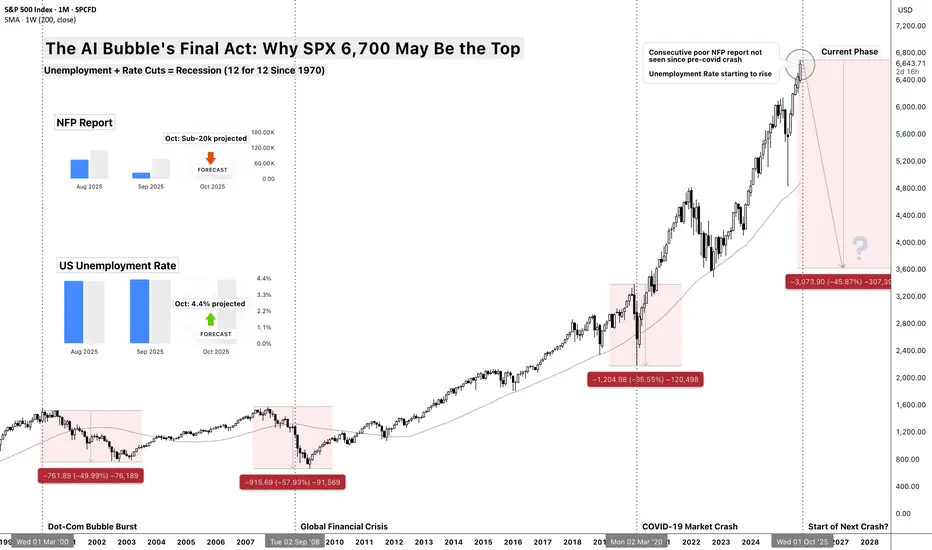
Unemployment + Rate Cuts = Recession (12 for 12 Since 1970)
The Death Cross Pattern
There's a simple rule that's worked for 55 years: When the Fed cuts rates while unemployment is rising from cycle lows, recession follows within 12 months - every single time.
Think of it like a doctor taking your temperature while giving you painkillers. The medicine might make you feel better temporarily, but if the fever is rising, something serious is wrong underneath.

Current Status:
Historical Result: 12/12 times = recession + 35% average equity crash
The Precedent: Crisis Follows a Script
2000 Dot-Com Bubble:
2008 Financial Crisis:
2025 AI Bubble:
The AI Employment Paradox
The Productivity Mirage
Wall Street celebrates AI boosting productivity, but here's the paradox:
productivity gains = job losses = reduced consumer spending = recession.
Think of it like a factory owner celebrating a new machine that replaces 100 workers. Great for margins, terrible for the local economy when those 100 families stop spending.
Jobs USNFP at Risk by Sector:
Total Impact: 10+ million jobs facing displacement over next 2-3 years
Why This Time is Different?
Unlike previous automation waves that created new job categories, AI is targeting cognitive work directly. A factory worker could become a service worker, but what does a displaced knowledge worker become?
Valuation Extremes: 1929 Levels with 2025 Leverage

Current Valuation Metrics:
Valuations today exceed 1929 by most measures - but with far more leverage embedded in the system. If 1929 was a valuation bubble, 2025 is that bubble layered with derivatives, corporate debt, and passive flows.
The Leverage Layer:
When liquidity stress hits, derivatives amplify shocks - notional exposure dwarfs underlying assets.
Think of today's market like a house of cards built on a trampoline. Even small bounces can bring the whole structure down.
Technical Breakdown: The Charts Don't Lie
Major Warning Signals:
Together, these signal fragility beneath the index surface.
The Three-Stage Technical Collapse:
Stage 1 - The Warning (Now-Q4 2025):
Stage 2 - The Cascade (Q4 2025-Q2 2026):
Stage 3 - Capitulation (Q2-Q4 2026):
The Catalyst: When Reality Meets Hype
Q4 2025 Earnings Season - The Reckoning
Companies will face impossible questions:
The Employment Data Domino Effect:
Think of it like the moment in 2000 when investors finally asked: "How exactly does Pets.com make money?" or 2007 when they wondered: "What's actually in these mortgage bonds?"
Sector-by-Sector Breakdown
Technology (-50 to -70%)
Consumer Discretionary (-40 to -55%)
Financials (-30 to -45%)
Relative Outperformers (-15 to -25%)
Key Dates and Catalysts
October 2025:
November 2025:
December 2025:
Q1 2026:
The Recovery Setup
Why This Crash Creates Opportunity:
Recovery Timeline:
Risk Management Rules
This Analysis Fails If:
Probability Assessment:
Conclusion: The End of the Everything Era
At SPX 6,700 with unemployment rising and the Fed cutting rates, we're witnessing the final act of the 15-year "everything bubble."
The AI revolution is real, but like the Internet in 2000, revolutionary technology doesn't prevent financial gravity.
The bubble is ending exactly like the previous ones - with everyone believing "this time is different" right until it isn't.
Smart money is already rotating defensive. The question isn't whether a correction is coming - it's whether you'll be positioned for it.
Unemployment + Rate Cuts = Recession (12 for 12 Since 1970)
The Death Cross Pattern
There's a simple rule that's worked for 55 years: When the Fed cuts rates while unemployment is rising from cycle lows, recession follows within 12 months - every single time.
Think of it like a doctor taking your temperature while giving you painkillers. The medicine might make you feel better temporarily, but if the fever is rising, something serious is wrong underneath.
Current Status:
- ✅ Fed just cut rates USINTR (September 2025)
- ✅ Unemployment USUR rising from 3.4% cycle low
- ✅ SPX at all-time high ($6,700)
Historical Result: 12/12 times = recession + 35% average equity crash
The Precedent: Crisis Follows a Script
2000 Dot-Com Bubble:
- Setup:SPX at ATH (1,550), USUR unemployment at 3.9%, USINTR Fed starts cutting
- Crisis: Technology "revolution" story breaks down
- Result: -49% crash over 2.5 years
- Recovery: 7 years to new highs
2008 Financial Crisis:
- Setup: SPX at ATH (1,576), USUR unemployment at 4.4%, USINTR Fed starts cutting
- Crisis: Housing/credit bubble bursts
- Result: -57% crash over 1.5 years
- Recovery: 5 years to new highs
2025 AI Bubble:
- Setup:SPX at ATH (6,700), USUR unemployment at 3.4%→4.2%, USINTR Fed starts cutting ✅
- Crisis: AI productivity story meets employment reality
- Projection: -35 to -45% crash over 18 months
- Recovery: 3-5 years (faster due to tech infrastructure remaining)
The AI Employment Paradox
The Productivity Mirage
Wall Street celebrates AI boosting productivity, but here's the paradox:
productivity gains = job losses = reduced consumer spending = recession.
Think of it like a factory owner celebrating a new machine that replaces 100 workers. Great for margins, terrible for the local economy when those 100 families stop spending.
Jobs
- Customer Service: 2M jobs (chatbots replacing agents)
- Software Development: 500K jobs (AI-assisted coding reducing teams)
- Transportation: 3M jobs (autonomous vehicles accelerating)
- Administrative: 4M jobs (AI handling routine tasks)
- Content Creation: 1M jobs (AI writing, design, video)
Total Impact: 10+ million jobs facing displacement over next 2-3 years
Why This Time is Different?
Unlike previous automation waves that created new job categories, AI is targeting cognitive work directly. A factory worker could become a service worker, but what does a displaced knowledge worker become?
Valuation Extremes: 1929 Levels with 2025 Leverage
Current Valuation Metrics:
- Shiller CAPE: 38+ (higher than 1929's 33)
- Buffett Indicator: 195% (market cap/GDP, historical average 85%)
- Price/Sales: 3.3x (vs 1.4x historical average)
- Forward P/E: 23x (on optimistic AI earnings assumptions)
Valuations today exceed 1929 by most measures - but with far more leverage embedded in the system. If 1929 was a valuation bubble, 2025 is that bubble layered with derivatives, corporate debt, and passive flows.
The Leverage Layer:
- Margin Debt: $1.023 trillion (record high)(as of July 2025, ycharts )
- Corporate Debt/GDP: 85% (vs 45% in 2000)
- Derivatives Exposure: $700 trillion notional (as of June 2025, BIS semiannual data)
- ETF/Passive Flows: $1.5 trillion annually (forced selling on reversals)
When liquidity stress hits, derivatives amplify shocks - notional exposure dwarfs underlying assets.
Think of today's market like a house of cards built on a trampoline. Even small bounces can bring the whole structure down.
Technical Breakdown: The Charts Don't Lie
Major Warning Signals:
- Market breadth has deteriorated from 90% in Q4 2024 to ~60% today,
- Defensives led earlier in the year,
- VIX Volatility’s floor has shifted higher
- Credit risk appetite (HYG/TLT) is stretched.
Together, these signal fragility beneath the index surface.
The Three-Stage Technical Collapse:
Stage 1 - The Warning (Now-Q4 2025):
- Current Level: $6,700
- Initial Support: $6,200 (previous resistance)
- Character: Failed rallies, rotating leadership, "healthy correction" narrative
- Target: 5,800-6,000 (-10 to -13%)
Stage 2 - The Cascade (Q4 2025-Q2 2026):
- Breaking Point: Below 5,800 triggers algorithmic selling
- Character: "Buy the dip" stops working, margin calls begin
- Target: 4,800-5,200 (-25 to -30%)
Stage 3 - Capitulation (Q2-Q4 2026):
- Final Flush: Panic selling, ETF redemptions
- Character: "Markets will never recover" sentiment peaks
- Target: 3,700-4,200 (-35 to -45%)
The Catalyst: When Reality Meets Hype
Q4 2025 Earnings Season - The Reckoning
Companies will face impossible questions:
- "You spent $50B on AI - where's the revenue growth?"
- "Productivity is up 20%, why are you laying off workers?"
- "If AI is so transformative, why are margins declining?"
The Employment Data Domino Effect:
- October/Nov NFP: First print above 250K unemployment claims
- November Consumer Spending: Down 2%+ as job fears spread
- December Holiday Sales: Weakest since 2008
- January Layoff Announcements: Tech companies start "right-sizing"
Think of it like the moment in 2000 when investors finally asked: "How exactly does Pets.com make money?" or 2007 when they wondered: "What's actually in these mortgage bonds?"
Sector-by-Sector Breakdown
Technology (-50 to -70%)
- AI hype stocks get destroyed first
- Software companies face declining growth + competition
- Semiconductor cycle turns negative
- Biggest Losers: NVDA, MSFT, GOOGL
Consumer Discretionary (-40 to -55%)
- Unemployment hits spending immediately
- High-end retailers crushed first
- Auto sales collapse with higher rates
- Biggest Losers: TSLA, AMZN, NKE
Financials (-30 to -45%)
- Credit losses surge as economy weakens
- Interest margin compression
- Commercial real estate exposure
- Biggest Losers: Regional banks, non-bank lenders
Relative Outperformers (-15 to -25%)
- Utilities, Healthcare, Consumer Staples
- Companies with genuine AI cost savings
- High-dividend yielders in low-rate environment
Key Dates and Catalysts
October 2025:
- Jobs report (first warning?)
- Q3 earnings disappointments
- Fed meeting (dovish pivot?)
November 2025:
- Election aftermath volatility
- Black Friday sales data
- Thanksgiving week low-volume crashes
December 2025:
- Year-end tax selling
- Institutional rebalancing
- Holiday retail reality check
Q1 2026:
- Layoff announcements surge
- Earnings guidance slashed
- Credit events begin
The Recovery Setup
Why This Crash Creates Opportunity:
- Valuation Reset: P/E ratios back to historical norms
- Weak Hands Flushed: Margin traders eliminated
- Government Response: Fiscal + monetary stimulus
- AI Infrastructure Remains: Real productivity gains continue post-bubble
Recovery Timeline:
- Bottom: Q4 2026 around 3,700-4,200
- Initial Rally: 30-50% bounce over 6 months
- New Bull Market: Begins 2027 with stronger foundation
- New Highs: 2029-2030 timeframe
Risk Management Rules
This Analysis Fails If:
- Fed pivots to massive QE before crisis
- Fiscal stimulus exceeds $2 trillion quickly
- AI productivity gains offset job losses faster than projected
- Geopolitical crisis overrides economic fundamentals
Probability Assessment:
- 60%: Correction to 4,800-5,500 range (25-30% decline)
- 25%: Major crash to 3,700-4,200 range (40-45% decline)
- 15%: Continued melt-up through 2026 (soft landing achieved)
Conclusion: The End of the Everything Era
At SPX 6,700 with unemployment rising and the Fed cutting rates, we're witnessing the final act of the 15-year "everything bubble."
The AI revolution is real, but like the Internet in 2000, revolutionary technology doesn't prevent financial gravity.
The bubble is ending exactly like the previous ones - with everyone believing "this time is different" right until it isn't.
Smart money is already rotating defensive. The question isn't whether a correction is coming - it's whether you'll be positioned for it.
Note
Disclaimer: This analysis is for educational purposes only and should not be considered financial advice. Past performance does not guarantee future results. Always conduct your own research and consult with financial professionals before making investment decisions.Note
🔄 Update - October 1, 2025:This thesis now has a sequel: The AI Bubble's Final Act II: The Convergence Tightens
It expands on the macro triggers and confirms the government shutdown as a key inflection point.

Note
🔄 Update - October 10, 2025:While the recent selloff in crypto and U.S. equities stems from Trigger 2 following the trade war re-escalation, I don’t see it as something to celebrate or sensationalize - as I warned earlier. Over 1.8 million crypto traders were liquidated, wiping out more than $19.4B. It hurts, because these are largely fellow retail traders.
I expect further selloff in equities come Monday, as the advantage of the stock market’s weekend closure transfers forced-selling pressure onto crypto.
My bias has become more lenient lately. I no longer hold the same conviction I had last month about a Q4 end - I now believe the major shift could be delayed to 2026. I also don’t believe the current downturn will last long, especially given the speed of this initial move. The bull market could still resume once the shock settles. Bitcoin, in particular, may recover within a month.
Gold, on the other hand, could continue its rally toward the $5,000 territory much sooner than anticipated - driven by sovereign accumulation, persistent geopolitical tension, and the accelerating pace of de-dollarization.
As for equities, I’m less certain. They may continue behaving irrationally, especially as markets begin pricing in an inevitable 50bps rate cut. Still, I believe the Fed will do whatever it takes to defend the dollar - not by strengthening its purchasing power, but by sustaining the dollar-based financial system itself through liquidity and intervention.
We’re now in a transition period that feels structurally similar to the pre–Bretton Woods era - when the old financial order was breaking down and a new one had yet to be defined. The same uncertainty, currency tensions, and power shifts are back, only in a modern form.
Truthfully, no one knows how this ends. Anyone claiming certainty will either be proven wrong - or soon humbled by the market, as it always does.
More on this in the full post soon.
Related publications
Disclaimer
The information and publications are not meant to be, and do not constitute, financial, investment, trading, or other types of advice or recommendations supplied or endorsed by TradingView. Read more in the Terms of Use.
Related publications
Disclaimer
The information and publications are not meant to be, and do not constitute, financial, investment, trading, or other types of advice or recommendations supplied or endorsed by TradingView. Read more in the Terms of Use.