SPX Falls Below the Midpoint of Its 13-Year Uptrend Channel
Primary Chart: Logarithmic Chart with 13-Year Secular Uptrend Defined by Parallel Channel
BRIEF SUMMARY:
SPX has been in what technicians call a secular uptrend for approximately 13 years. A secular trend is an even higher degree of trend than the commonly discussed "primary trend." A primary trend typically ranges from about 9 months to 2 years. Two recent examples illustrate the primary trend: (1) The bull market from the March 2020 lows to the January 2022 highs, and (2) the bear market from the January 2022 high to the present date (9 months exactly).
By contrast, a secular trend is about 12-25 years long according to technical expert Martin Pring. When examining the price on a weekly chart from the lows of the 2008-2009 crash (the Great Financial Crisis) to the present date, one can find that the price has stayed within a trend channel, respecting its upper and lower boundaries more or less.
Will the channel break to show a much larger and longer-term shift in change? That is a question that no one can answer, but it will be worth noting whether price breaks or finds support at the channels lower boundary, the upward trendline.
Recently, price broke through the midpoint of this channel. Last week was the first weekly close below the midpoint. This week followed through with a decisive move lower and a second close below the midpoint—along with a lower weekly low. This is not bullish no matter how oversold oscillators and indicators may be. Speaking of oscillators, what oscillators predicted whether the June 2022 lows would be undercut? None: they all looked like they could be oversold, or close enough to oversold to work for a double bottom.
The double-bottom conversation also suggests that capitulation is not present. The widespread discussion of the term is actually bullish, reflecting hopes that the market will reverse its downtrend and put in a bullish reversal formation that will lead back to all-time highs. Is that the sort of sentiment that is commonly seen at a true bear-market low? The five stages of a bear market include denial, anger, bargaining, depression, and acceptance. Could equity markets still be in denial? Or have markets moved to the third stage of bargaining? With all the talk of "double bottoms," in both equities and crypto, perhaps the current stage is "bargaining." Why? By describing the present selloff in this bear market as a "double bottom," market participants attempt to place the current ugly decline in a positive light. A double bottom, after all, is a pattern that implies a powerful rally after the second bottom, where the rally eventually exceeds the peak between the two bottoms and continues thereafter once confirmed. So all the banter about double bottoms shows that a lot of bullish hopes still have not been crushed. The end of a bear market, however, evidences the fourth and fifth stages of bear-market grief, which is depression and acceptance (capitulation).
Sure, a double bottom could lead to a nice bounce because oversold extremes tend to cause mean reversions anyway, and when everyone is looking at a double bottom, shorts may cover and investors may try to pick the bottom. That is why my hypothetical arrow shows a jagged trip to the lower upward trendline of the parallel channel. First a little lower, then higher in another OS bounce / bear rally, then lower again, then up as people try to catch the low, then lower again, and so on.
Eventually, price may likely come into contact with the lower edge of the channel—and the long-term secular uptrend will still be intact and neatly contain this bear market. In other words, this bear market at the level of primary trend will not invalidate the secular uptrend, unless price breaks that line around SPX 3000-3100 (considering where the line lies in 3 to 6 months).
________________________________________
Author's Comments:
(1) Thank you for reviewing this post and considering its charts and analysis. The author welcomes comments, discussion and debate in the comment section. Shared charts are especially helpful to support any opposing or alternative view.
(2) This technical-analysis view does not constitute a trade recommendation or trade setup. Instead, it attempts to offer technical commentary that describes and analyzes price levels, trends, price action, or the broader technical environment as of the publication date. Technical-analysis commentary does not equate to trade setups or recommendations. Within a given price environment, traders bear responsibility for their own trading strategy, risk tolerance, and time frame, and for any due diligence associated with such trades.
(3) This technical-analysis viewpoint could change at a moment's notice, e.g., when price violates a key level of invalidation for a particular view. Further, proper risk-management techniques are vital to trading success.
(4) To the extent countertrend price moves are discussed, consider that countertrend or mean-reversion trading, e.g., trading a rally in a bear market, remains higher risk and lower probability even for the most experienced traders and investors.
DISCLAIMER: This post contains commentary published solely for educational and informational purposes. This post's content (and any content available through links in this post) and its views do not constitute financial advice or an investment or trading recommendation, and they do not account for readers' personal financial circumstances, or their investing or trading objectives, time frame, and risk tolerance. Readers should perform their own due diligence, and consult a qualified / licensed financial adviser or other financial or investment professional before entering any trade, investment or other transaction.
BRIEF SUMMARY:
- The secular uptrend over the past 13 years is still valid and contains within its boundaries the current bear market, which is at the primary trend level.
- SPX's price has fallen past the midpoint of the channel. Two weekly closes have been below the midpoint of this channel. This week's close was lower than last weeks, which is not bullish at all, even if an oversold relief rally is becoming more likely.
- The lower edge of the channel, called the upward trendline, lies at 3000 to 3200 from year end to about May 2023. If this bear market lasts that long, the lower edge of the channel may provide a good spot for the bear to end—or for a much longer-term shift in trend should that line break.
SPX has been in what technicians call a secular uptrend for approximately 13 years. A secular trend is an even higher degree of trend than the commonly discussed "primary trend." A primary trend typically ranges from about 9 months to 2 years. Two recent examples illustrate the primary trend: (1) The bull market from the March 2020 lows to the January 2022 highs, and (2) the bear market from the January 2022 high to the present date (9 months exactly).
By contrast, a secular trend is about 12-25 years long according to technical expert Martin Pring. When examining the price on a weekly chart from the lows of the 2008-2009 crash (the Great Financial Crisis) to the present date, one can find that the price has stayed within a trend channel, respecting its upper and lower boundaries more or less.
Will the channel break to show a much larger and longer-term shift in change? That is a question that no one can answer, but it will be worth noting whether price breaks or finds support at the channels lower boundary, the upward trendline.
Recently, price broke through the midpoint of this channel. Last week was the first weekly close below the midpoint. This week followed through with a decisive move lower and a second close below the midpoint—along with a lower weekly low. This is not bullish no matter how oversold oscillators and indicators may be. Speaking of oscillators, what oscillators predicted whether the June 2022 lows would be undercut? None: they all looked like they could be oversold, or close enough to oversold to work for a double bottom.
The double-bottom conversation also suggests that capitulation is not present. The widespread discussion of the term is actually bullish, reflecting hopes that the market will reverse its downtrend and put in a bullish reversal formation that will lead back to all-time highs. Is that the sort of sentiment that is commonly seen at a true bear-market low? The five stages of a bear market include denial, anger, bargaining, depression, and acceptance. Could equity markets still be in denial? Or have markets moved to the third stage of bargaining? With all the talk of "double bottoms," in both equities and crypto, perhaps the current stage is "bargaining." Why? By describing the present selloff in this bear market as a "double bottom," market participants attempt to place the current ugly decline in a positive light. A double bottom, after all, is a pattern that implies a powerful rally after the second bottom, where the rally eventually exceeds the peak between the two bottoms and continues thereafter once confirmed. So all the banter about double bottoms shows that a lot of bullish hopes still have not been crushed. The end of a bear market, however, evidences the fourth and fifth stages of bear-market grief, which is depression and acceptance (capitulation).
Sure, a double bottom could lead to a nice bounce because oversold extremes tend to cause mean reversions anyway, and when everyone is looking at a double bottom, shorts may cover and investors may try to pick the bottom. That is why my hypothetical arrow shows a jagged trip to the lower upward trendline of the parallel channel. First a little lower, then higher in another OS bounce / bear rally, then lower again, then up as people try to catch the low, then lower again, and so on.
Eventually, price may likely come into contact with the lower edge of the channel—and the long-term secular uptrend will still be intact and neatly contain this bear market. In other words, this bear market at the level of primary trend will not invalidate the secular uptrend, unless price breaks that line around SPX 3000-3100 (considering where the line lies in 3 to 6 months).
________________________________________
Author's Comments:
(1) Thank you for reviewing this post and considering its charts and analysis. The author welcomes comments, discussion and debate in the comment section. Shared charts are especially helpful to support any opposing or alternative view.
(2) This technical-analysis view does not constitute a trade recommendation or trade setup. Instead, it attempts to offer technical commentary that describes and analyzes price levels, trends, price action, or the broader technical environment as of the publication date. Technical-analysis commentary does not equate to trade setups or recommendations. Within a given price environment, traders bear responsibility for their own trading strategy, risk tolerance, and time frame, and for any due diligence associated with such trades.
(3) This technical-analysis viewpoint could change at a moment's notice, e.g., when price violates a key level of invalidation for a particular view. Further, proper risk-management techniques are vital to trading success.
(4) To the extent countertrend price moves are discussed, consider that countertrend or mean-reversion trading, e.g., trading a rally in a bear market, remains higher risk and lower probability even for the most experienced traders and investors.
DISCLAIMER: This post contains commentary published solely for educational and informational purposes. This post's content (and any content available through links in this post) and its views do not constitute financial advice or an investment or trading recommendation, and they do not account for readers' personal financial circumstances, or their investing or trading objectives, time frame, and risk tolerance. Readers should perform their own due diligence, and consult a qualified / licensed financial adviser or other financial or investment professional before entering any trade, investment or other transaction.
Comment:
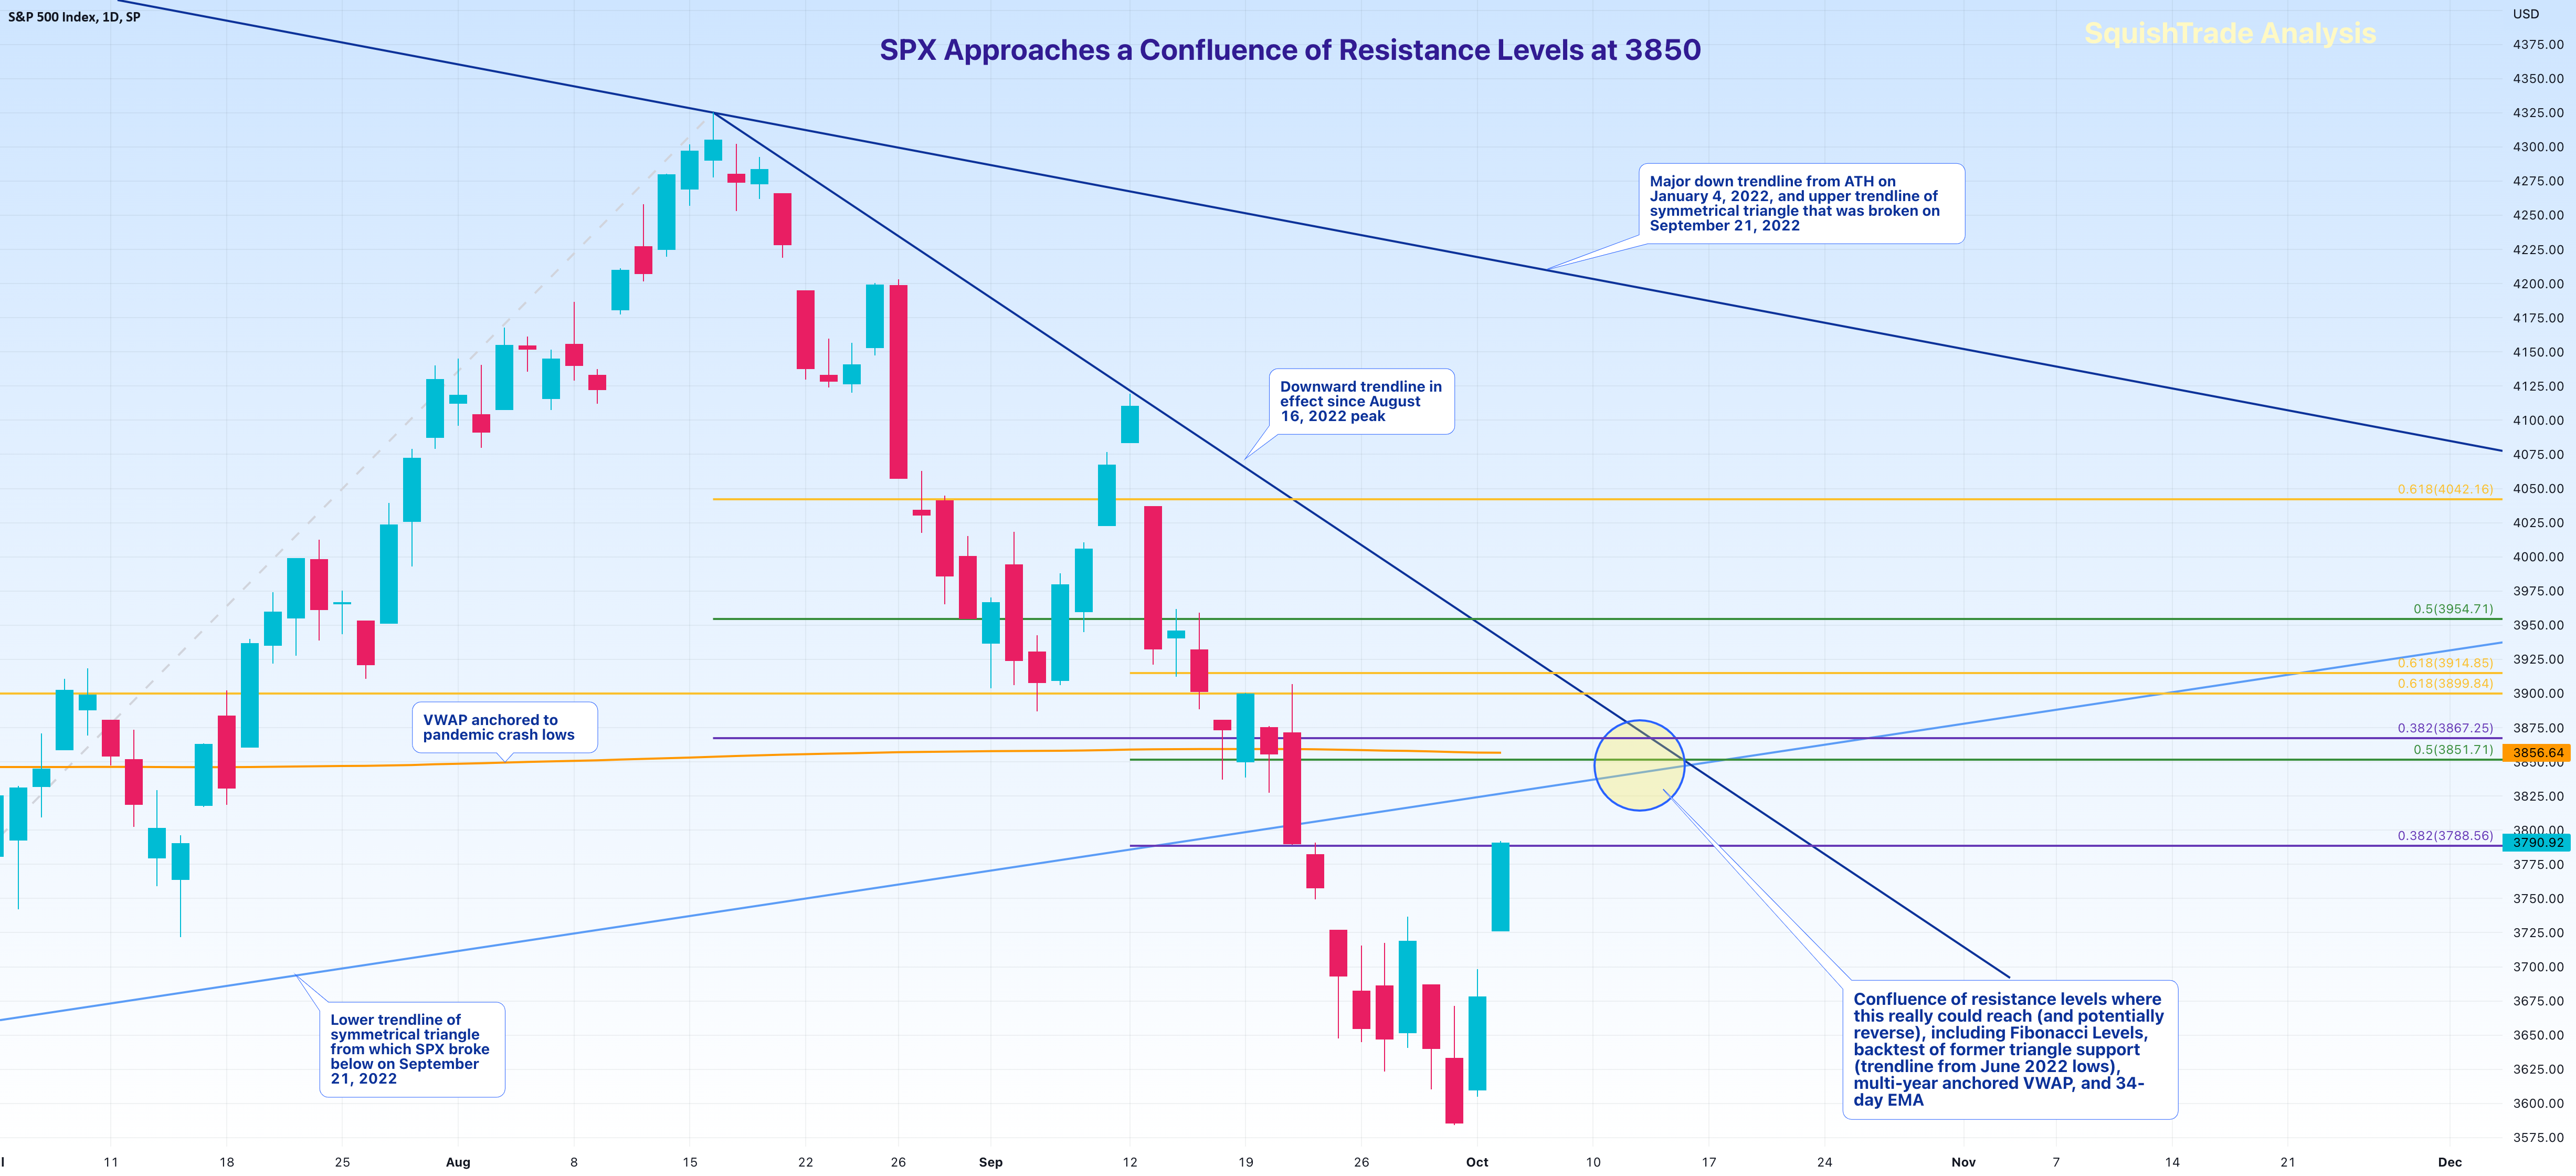
And here are the key levels to watch next week on a daily chart:

Comment:
It looks like SPX is finally responding to the extreme OS conditions with a relief bounce. It may just rise up to backtest the midpoint of the 13-year channel at 3767 (approximately). The Fed has not changed anything, however. This appears to be short covering combined with more hopium.
Comment:
In my last update, I mentioned that SPX may test the midpoint of the 13-year channel. It reached that area today at 3767.
Here is an intraday chart of SPX showing some potential levels and possibilities for this bounce.
Here is an intraday chart of SPX showing some potential levels and possibilities for this bounce.
Comment:
Comment:
SquishTrade's posted a shorter-term technical analysis update on SPX. Thank you for checking it out when you have a moment!

Comment:
The secular uptrend on a 13-year time frame remains intact. SPX's move below the midpoint was not sustained, and price has rallied back above the midpoint of the channel. But on this much larger time frame, it's appears SPX is just making very little progress—other than chopping around the mid-point of the 13-year channel!
Interesting to refresh the chart and consider whether the lower edge of the channel may still be tagged as hypothesized last fall.
Interesting to refresh the chart and consider whether the lower edge of the channel may still be tagged as hypothesized last fall.
SquishTrade