The Christmas Effect: Why Markets Slow Down Before They MoveEvery December, traders ask the same question:
Will we get a Christmas rally?
But the real lesson Christmas teaches the market isn’t about rallies.
It’s about behavior.
1️⃣ Christmas Is a Liquidity Event 🎄
As the year comes to an end:
- institutions reduce exposure
- desks thin out
- volume drops
- participation becomes selective
This doesn’t make markets weak.
It makes them quiet .
And quiet markets are where structure forms.
2️⃣ Low Activity Doesn’t Mean No Opportunity
During Christmas weeks, price often:
- compresses
- ranges tightly
- respects key levels
- moves slowly
Many traders mistake this for boredom.
Professionals see it differently.
Low-volatility environments often act like wrapping paper...
they hide the move that comes after the holidays.
3️⃣ Why Breakouts After Christmas Matter More
When markets return to full participation in January, two things happen:
- liquidity comes back
- intent becomes clear
That’s why post-Christmas breakouts tend to be:
- cleaner
- more directional
- better sustained
The move doesn’t start with fireworks.
It starts with patience.
4️⃣ Christmas Rewards the Prepared Trader
While most traders look for action, experienced ones:
- mark levels
- define scenarios
- reduce overtrading
- protect capital
Christmas is not about forcing trades.
It’s about preparing for the next chapter.
Final Thought 🎄
The market doesn’t move because it’s Christmas.
It moves because participants return.
And the traders who respect the quiet season
are usually the ones best positioned when the noise comes back.
So here’s the question:
Are you trying to trade Christmas… or preparing for what comes after it?
⚠️ Disclaimer: This is not financial advice. Always do your own research and manage risk properly.
📚 Stick to your trading plan regarding entries, risk, and management.
Good luck! 🍀
All Strategies Are Good; If Managed Properly!
~Richard Nasr
Wave Analysis

These Two Patterns Move Markets — Flag & Wedge Explained🎯Professional Guide to Flag and Wedge Patterns
1️⃣ Flag Pattern
Definition
The Flag pattern is a high-probability continuation pattern that forms after a strong impulsive move. It represents a short-term consolidation phase before the market resumes the primary trend.
Standard Flag Structure
Flagpole: A sharp, high-momentum price move with increasing volume
Flag: A brief consolidation in the form of a parallel channel
Breakout: Price continuation in the direction of the prior trend
📌 The correction typically retraces 23%–50% Fibonacci of the impulse move.
Bull Flag
Dominant trend: Uptrend
Consolidation: Shallow downward channel
Valid breakout: Candle close above channel resistance + volume expansion
🎯 Target:
Length of the flagpole projected from the breakout
🛑 Stop Loss:
Below the lower boundary of the flag
Bear Flag
Dominant trend: Downtrend
Consolidation: Weak upward channel
Valid breakdown: Candle close below channel support
🎯 Target and stop logic are the inverse of a Bull Flag
2️⃣ Wedge Pattern
Definition
A Wedge pattern is a price compression structure accompanied by decreasing momentum. It often precedes a strong expansion move and can act as either a continuation or reversal pattern, depending on context.
Key Characteristics
Converging trendlines
Gradually declining volume
Minimum of five valid touches across both trendlines
Rising Wedge
Higher highs and higher lows
Support line rising faster than resistance
Bullish momentum weakening
📉 Primary signal:
Breakdown below support → bearish continuation or reversal
🎯 Target:
Maximum width of the wedge projected from the breakout
🛑 Stop Loss:
Above the last swing high inside the structure
Falling Wedge
Lower highs and lower lows
Resistance line descending faster than support
Selling pressure gradually weakening
📈 Primary signal:
Breakout above resistance → bullish move
🎯 Target = wedge width
🛑 Stop Loss = below the last swing low
3️⃣ Key Differences: Flag vs Wedge
Feature Flag Wedge
Pattern Type Continuation Often Reversal
Structure Parallel channel Converging lines
Formation Time Short-term Medium-term
Volume Behavior Drops during pullback Gradually decreases
Fake Breakout Risk Lower Higher
4️⃣ Advanced Trading Tips
✔️ Flags perform best in strong trending markets
✔️ Wedges gain reliability near major support or resistance zones
✔️ Combining wedges with RSI divergence improves accuracy
✔️ Enter trades only after a confirmed candle close (not wicks)
Final Summary
Flag = Pause → Continuation
Wedge = Compression → Expansion
Volume confirmation defines breakout quality

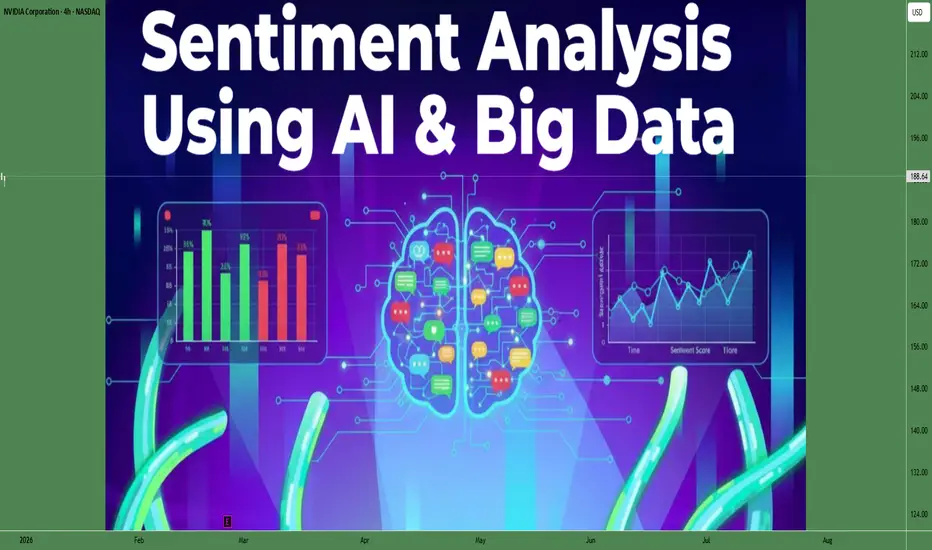
Sentiment Analysis Using AI & Big Data1. Introduction to Sentiment Analysis
Sentiment Analysis refers to the use of Artificial Intelligence (AI) and Big Data technologies to identify, extract, and quantify emotions, opinions, and attitudes expressed in text, speech, or digital content.
It helps organizations understand whether sentiments are positive, negative, or neutral.
With the exponential growth of digital data from social media, reviews, news, blogs, and customer feedback, sentiment analysis has become a critical analytical tool.
AI-driven sentiment analysis goes beyond basic keyword matching and captures context, tone, and intent.
2. Role of Artificial Intelligence in Sentiment Analysis
AI enables machines to mimic human language understanding through Natural Language Processing (NLP).
Machine learning models are trained on massive datasets to recognize patterns in language.
Deep learning techniques allow systems to understand sarcasm, slang, and emotional nuance.
AI models continuously improve accuracy as more data is processed.
Automation through AI allows real-time sentiment detection at scale.
3. Importance of Big Data in Sentiment Analysis
Big Data provides vast volumes of structured and unstructured information.
Data sources include social media posts, online reviews, emails, call transcripts, news articles, and forums.
High velocity data enables real-time analysis of public opinion.
Variety in data sources ensures a comprehensive understanding of sentiment trends.
Big Data frameworks allow efficient storage, processing, and retrieval of large datasets.
4. Types of Sentiment Analysis
Polarity-based Analysis: Classifies text as positive, negative, or neutral.
Emotion-based Analysis: Identifies emotions such as happiness, anger, fear, or sadness.
Aspect-based Analysis: Focuses on specific aspects or features within a text.
Intent-based Analysis: Determines user intention, such as purchase intent or dissatisfaction.
Multilingual Analysis: Processes sentiment across different languages and regions.
5. Key Technologies Used
Natural Language Processing (NLP) for understanding text structure and semantics.
Machine Learning algorithms such as Naive Bayes, SVM, and Random Forest.
Deep Learning models including LSTM, RNN, and Transformer-based models.
Big Data platforms for data ingestion and processing.
Cloud computing for scalability and computational efficiency.
6. Data Collection and Preprocessing
Data is collected from multiple digital platforms.
Preprocessing includes cleaning text, removing noise, and normalizing language.
Tokenization splits text into meaningful units.
Stop-word removal improves analysis efficiency.
Lemmatization and stemming help standardize words.
7. Model Training and Evaluation
Large labeled datasets are used to train sentiment models.
Supervised learning techniques rely on annotated data.
Unsupervised learning helps discover hidden sentiment patterns.
Models are evaluated using accuracy, precision, recall, and F1-score.
Continuous retraining ensures relevance with evolving language.
8. Real-Time Sentiment Analysis
AI systems can analyze live social media feeds and news streams.
Enables instant response to customer feedback or market events.
Helps brands manage reputation proactively.
Supports crisis management by identifying sentiment shifts early.
Enhances decision-making speed and accuracy.
9. Applications in Business and Marketing
Understanding customer satisfaction and brand perception.
Improving product development based on feedback sentiment.
Enhancing targeted marketing campaigns.
Monitoring competitor sentiment in the market.
Optimizing customer service strategies.
10. Financial Market Applications
Analyzing news sentiment to predict stock market movements.
Monitoring social media sentiment for retail investor behavior.
Supporting algorithmic trading strategies.
Assessing market confidence and fear indicators.
Improving risk management decisions.
11. Political and Social Applications
Measuring public opinion on policies and leaders.
Tracking election sentiment trends.
Identifying misinformation and emotional manipulation.
Supporting governance and policy formulation.
Enhancing civic engagement analysis.
12. Healthcare and Public Services
Analyzing patient feedback and reviews.
Monitoring mental health indicators from text data.
Improving healthcare service delivery.
Identifying public health concerns early.
Enhancing patient satisfaction analysis.
13. Challenges in Sentiment Analysis
Handling sarcasm and irony accurately.
Dealing with multilingual and regional language variations.
Managing biased or noisy data.
Interpreting context-dependent sentiments.
Ensuring data privacy and ethical use.
14. Ethical and Privacy Considerations
Responsible data collection and usage.
Avoiding algorithmic bias and discrimination.
Ensuring transparency in AI models.
Complying with data protection regulations.
Maintaining user trust and consent.
15. Accuracy and Reliability Improvements
Combining rule-based and machine learning approaches.
Using ensemble models for better performance.
Incorporating contextual embeddings.
Continuous validation with real-world data.
Human-in-the-loop systems for quality control.
16. Integration with Business Intelligence
Sentiment insights combined with quantitative data.
Enhances dashboards and reporting systems.
Supports strategic planning and forecasting.
Enables data-driven leadership decisions.
Improves organizational agility.
17. Impact on Decision Making
Provides actionable insights from unstructured data.
Reduces reliance on intuition-based decisions.
Enhances predictive analytics.
Improves customer-centric strategies.
Supports long-term planning.
18. Future Trends in Sentiment Analysis
Greater use of multimodal data including text, voice, and video.
More accurate emotion recognition systems.
Increased use of generative AI models.
Expansion into regional and low-resource languages.
Greater focus on explainable AI.
19. Competitive Advantage through Sentiment Intelligence
Organizations gain deeper market understanding.
Faster response to customer needs.
Improved brand loyalty and trust.
Enhanced innovation through feedback analysis.
Sustainable competitive positioning.
20. Conclusion
Sentiment Analysis using AI and Big Data is transforming how organizations interpret human emotions at scale.
It converts vast unstructured data into meaningful insights.
Businesses, governments, and institutions benefit from real-time sentiment intelligence.
While challenges exist, continuous technological advancements are improving accuracy and reliability.
In the digital age, sentiment analysis has become an essential tool for informed, data-driven decision-making.
Managing Currency Pegs1. Introduction to Currency Pegs
A currency peg is an exchange rate policy in which a country fixes the value of its domestic currency to another major currency (such as the US dollar or euro), a basket of currencies, or a commodity like gold. The primary objective of a currency peg is to maintain exchange rate stability, reduce volatility in international trade, and enhance investor confidence. Many developing and emerging economies adopt currency pegs to anchor inflation expectations and stabilize their macroeconomic environment.
However, managing a currency peg is complex and requires strong institutional capacity, sufficient foreign exchange reserves, and disciplined economic policies. Failure to manage a peg effectively can lead to severe financial crises, as seen in historical episodes such as the Asian Financial Crisis (1997) and Argentina’s currency collapse (2001).
2. Types of Currency Peg Systems
a) Fixed Peg
Under a fixed peg, the currency is tied at a constant rate to another currency. The central bank intervenes actively to maintain this rate.
b) Crawling Peg
A crawling peg allows gradual, pre-announced adjustments to the exchange rate, usually to offset inflation differentials.
c) Peg to a Basket of Currencies
Instead of a single currency, some countries peg to a basket, reducing dependence on one economy and smoothing external shocks.
d) Currency Board Arrangement
A currency board is a strict form of peg where domestic currency issuance is fully backed by foreign reserves, leaving little room for monetary discretion.
3. Objectives of Managing Currency Pegs
The management of currency pegs is driven by several economic objectives:
Exchange rate stability to promote trade and investment
Inflation control, especially in high-inflation economies
Policy credibility by anchoring monetary expectations
Reduction of currency risk for exporters and importers
Macroeconomic discipline, forcing governments to limit excessive deficits
For small open economies, these benefits can significantly outweigh the costs, provided the peg is managed prudently.
4. Role of Central Banks in Maintaining a Peg
a) Foreign Exchange Market Intervention
Central banks buy or sell foreign currency to maintain the pegged rate. When domestic currency weakens, reserves are sold; when it strengthens, reserves are accumulated.
b) Interest Rate Adjustments
Interest rates are aligned with the anchor currency to discourage speculative capital flows that could destabilize the peg.
c) Capital Controls
Some countries use capital controls to limit sudden inflows or outflows that may pressure the exchange rate.
d) Reserve Management
Adequate foreign exchange reserves are essential. A commonly used benchmark is reserves sufficient to cover at least 3–6 months of imports.
5. Fiscal Discipline and Policy Coordination
Effective management of a currency peg requires tight coordination between monetary and fiscal policy.
Large fiscal deficits undermine confidence in the peg
Excessive government borrowing can trigger speculative attacks
Structural reforms are often necessary to improve productivity
Without fiscal discipline, central banks may be forced to defend the peg through reserve depletion, eventually leading to collapse.
6. Challenges in Managing Currency Pegs
a) Loss of Monetary Policy Independence
Countries with a peg cannot freely adjust interest rates to respond to domestic economic conditions.
b) Speculative Attacks
If markets believe the peg is unsustainable, large capital outflows can rapidly drain reserves.
c) External Shocks
Global interest rate changes, commodity price swings, or geopolitical tensions can put pressure on pegged currencies.
d) Misalignment Risk
If the pegged rate does not reflect economic fundamentals, exports become uncompetitive and current account deficits widen.
7. Currency Pegs and Emerging Market Economies
Many emerging economies use currency pegs to stabilize volatile financial systems. However, success depends on:
Export competitiveness
Sound banking systems
Political stability
Transparent policy communication
For example, Gulf countries peg their currencies to the US dollar to stabilize oil revenues, while Hong Kong maintains a currency board to ensure financial stability as an international financial hub.
8. Crisis Management and Exit Strategies
Managing a currency peg also involves planning for orderly exit strategies. Abrupt de-pegging can trigger inflation, capital flight, and banking crises.
Common exit approaches:
Gradual shift to a crawling peg
Transition to a managed float
Pre-announced revaluation or devaluation
Clear communication and credibility are essential during transitions to prevent panic.
9. Advantages and Disadvantages of Currency Pegs
Advantages:
Predictable exchange rates
Lower transaction costs
Reduced inflation volatility
Improved trade planning
Disadvantages:
Vulnerability to external shocks
Reserve depletion risks
Reduced policy flexibility
Potential for financial crises
The trade-off between stability and flexibility is the central challenge in managing currency pegs.
10. Conclusion
Managing currency pegs is a delicate balancing act that requires strong institutions, disciplined fiscal policy, and sufficient foreign exchange reserves. While currency pegs can provide stability and credibility—especially for developing economies—they also impose significant constraints on monetary policy and expose countries to external shocks.
Successful peg management depends not only on central bank intervention but also on broader economic fundamentals, transparency, and market confidence. In a globalized financial system with high capital mobility, poorly managed pegs can quickly become unsustainable. Therefore, countries adopting currency pegs must remain vigilant, adaptable, and prepared with clear exit strategies to safeguard long-term economic stability.

Transforming the Future of Financial MarketsTrading with Blockchain
Introduction
Trading with blockchain represents a fundamental shift in how financial markets operate. Traditionally, trading relied on centralized exchanges, intermediaries, clearing houses, and manual reconciliation processes. Blockchain technology introduces a decentralized, transparent, and immutable ledger system that enables peer-to-peer trading without the need for excessive intermediaries. From cryptocurrencies and tokenized assets to smart contracts and decentralized finance (DeFi), blockchain is redefining how assets are created, traded, settled, and stored. This transformation is not limited to crypto markets alone but extends to equities, commodities, bonds, derivatives, and even real-world assets.
Understanding Blockchain Technology in Trading
Blockchain is a distributed ledger technology (DLT) where transactions are recorded across a network of computers (nodes). Each transaction is verified through consensus mechanisms such as Proof of Work (PoW) or Proof of Stake (PoS), ensuring trust without central authority.
In trading, blockchain enables:
Real-time transaction validation
Tamper-proof trade records
Reduction of settlement time
Elimination of duplicate records
Unlike traditional systems where exchanges, brokers, custodians, and clearing corporations maintain separate ledgers, blockchain maintains one shared source of truth.
Role of Blockchain in Financial Trading Markets
Blockchain impacts trading markets in multiple dimensions:
Execution – Orders can be executed peer-to-peer without intermediaries.
Clearing – Blockchain removes the need for separate clearing agencies.
Settlement – Settlement can occur instantly (T+0) instead of T+2 or T+3.
Custody – Digital wallets replace traditional custodians.
This significantly reduces operational risk, cost, and counterparty default risk.
Decentralized Exchanges (DEXs) and Blockchain Trading
Decentralized exchanges are one of the most practical applications of blockchain trading. Unlike centralized exchanges (CEXs), DEXs allow users to trade directly from their wallets using smart contracts.
Key Features of DEXs:
Non-custodial trading (users retain asset control)
Transparent order execution
No central authority or single point of failure
Global accessibility
Examples include Uniswap, PancakeSwap, and SushiSwap. These platforms use Automated Market Makers (AMMs) instead of traditional order books, enabling continuous liquidity through smart contracts.
Smart Contracts: Automating Trading Processes
Smart contracts are self-executing programs stored on the blockchain that automatically execute trade conditions once predefined rules are met.
In trading, smart contracts enable:
Automatic order execution
Margin trading logic
Stop-loss and take-profit automation
Dividend and interest distribution
By removing manual intervention, smart contracts reduce human error, manipulation, and settlement delays, making trading faster and more reliable.
Tokenization of Assets and Blockchain Trading
Tokenization converts real-world assets into digital tokens on a blockchain. These tokens represent ownership rights and can be traded like cryptocurrencies.
Assets That Can Be Tokenized:
Stocks and equities
Bonds and debt instruments
Commodities (gold, oil)
Real estate
Art and collectibles
Tokenized trading allows fractional ownership, increased liquidity, and global investor participation. For example, a high-value asset like commercial real estate can be divided into small tradable tokens, making it accessible to retail traders.
Blockchain Trading in Cryptocurrencies
Cryptocurrency trading is the most mature use case of blockchain. Bitcoin, Ethereum, and other digital assets are traded 24/7 across global markets without centralized control.
Advantages:
Borderless trading
No banking dependency
High liquidity
Transparency of on-chain data
On-chain metrics such as wallet activity, transaction volume, and network fees offer traders new analytical tools beyond traditional technical and fundamental analysis.
Blockchain and Derivatives Trading
Blockchain is increasingly being used in derivatives trading such as futures, options, and perpetual contracts.
Benefits include:
Trustless margin management
Real-time collateral monitoring
Reduced liquidation risk through automation
Transparent funding rates
Decentralized derivatives platforms allow traders to access leveraged products without centralized clearinghouses, though risk management remains crucial.
Benefits of Trading with Blockchain
1. Transparency
All trades are recorded on public ledgers, reducing fraud and insider manipulation.
2. Speed and Efficiency
Instant settlement eliminates delays and capital lock-ups.
3. Lower Costs
Reduced intermediary involvement lowers brokerage, clearing, and settlement fees.
4. Security
Cryptographic protection and immutability reduce hacking and data tampering risks.
5. Financial Inclusion
Anyone with internet access can participate in global trading markets.
Risks and Challenges in Blockchain Trading
Despite its advantages, blockchain trading also presents challenges:
Market volatility, especially in crypto assets
Regulatory uncertainty across countries
Smart contract vulnerabilities
Liquidity risks in smaller protocols
User responsibility, as lost private keys mean lost assets
For traders, understanding these risks is essential before adopting blockchain-based trading strategies.
Regulatory Perspective on Blockchain Trading
Governments and regulators worldwide are gradually developing frameworks to oversee blockchain trading. The focus is on:
Investor protection
Anti-money laundering (AML) compliance
Know Your Customer (KYC) norms
Taxation of digital assets
Balanced regulation will be crucial to ensure innovation without compromising financial stability.
Future of Trading with Blockchain
The future of trading with blockchain points toward hybrid systems, where traditional financial markets integrate blockchain infrastructure. Central Bank Digital Currencies (CBDCs), tokenized stock exchanges, and on-chain settlement systems are expected to become mainstream.
Artificial intelligence combined with blockchain, cross-chain interoperability, and institutional adoption will further expand blockchain trading beyond crypto into global capital markets.
Conclusion
Trading with blockchain is not just a technological upgrade but a structural evolution of financial markets. By enabling decentralized, transparent, and automated trading systems, blockchain reduces inefficiencies that have existed for decades. While challenges remain in regulation, security, and scalability, the long-term potential of blockchain-based trading is transformative. For traders, investors, and institutions, understanding blockchain trading is no longer optional—it is essential for navigating the future of global finance.

WHY TRADING CLARITY COMES ONLY IN 3D ?🔄 Core Principle
• Each timeframe is like an independent world.
• In every world, we use three lenses:
• Macro: The broader outlook within that timeframe.
• Meso: The mid‑range cycles and routines inside that timeframe.
• Micro: The present moment and immediate details of that timeframe.
📊 Example (Daily Timeframe)
• Macro in Daily: The overall trend of daily candles over the past few months — the bigger picture.
• Meso in Daily: Mid‑range waves or corrections lasting several days within the daily chart.
• Micro in Daily: The current daily candle, today’s volume, and the quality of the immediate action.
This way, every timeframe carries its own three‑layered perspective:
big picture, mid‑cycle, and present moment.

Geopolitical Risk and Its Role in Causing Market VolatilityGeopolitical risk refers to the uncertainty and instability arising from political events, international conflicts, diplomatic tensions, trade disputes, sanctions, wars, terrorism, and changes in government policies across countries. In an increasingly interconnected global economy, geopolitical developments in one region can rapidly spill over into global financial markets. As a result, geopolitical risk has become one of the most powerful and unpredictable drivers of market volatility, affecting equities, bonds, commodities, currencies, and even cryptocurrencies.
Understanding the Link Between Geopolitics and Markets
Financial markets thrive on stability, predictability, and confidence. Geopolitical events disrupt these conditions by introducing uncertainty about future economic outcomes. When investors are unable to accurately assess risks or forecast returns due to political instability, they tend to react emotionally—often selling riskier assets and moving capital toward safer investments. This sudden shift in investor behavior leads to sharp price movements, higher volatility, and sometimes prolonged market turbulence.
Markets are forward-looking by nature. Even the expectation of a geopolitical event—such as a potential war, sanctions, or breakdown of trade negotiations—can trigger volatility well before the event actually occurs. This makes geopolitical risk particularly dangerous, as markets may overreact to rumors, media headlines, or speculative assessments.
Types of Geopolitical Events That Trigger Volatility
Several forms of geopolitical risk have historically caused significant market disruptions:
Wars and Military Conflicts: Armed conflicts directly impact global supply chains, energy markets, and investor confidence. Wars often lead to spikes in oil, gold, and defense stocks, while equities and emerging market assets may decline sharply.
Trade Wars and Economic Sanctions: Trade disputes between major economies can disrupt global commerce, raise inflation, and reduce corporate profits. Tariffs and sanctions increase uncertainty for multinational companies, leading to stock market volatility.
Political Instability and Regime Changes: Coups, revolutions, contested elections, or sudden policy shifts can destabilize domestic markets and cause capital flight, especially in developing economies.
Terrorism and Security Threats: Major terrorist attacks often trigger immediate market sell-offs due to fear and uncertainty, particularly in travel, tourism, and financial sectors.
Diplomatic Tensions: Breakdown in diplomatic relations between powerful nations can affect currency markets, defense stocks, and global investor sentiment.
Impact on Different Asset Classes
Geopolitical risk does not affect all markets equally. Its impact varies across asset classes:
Equity Markets: Stock markets usually react negatively to rising geopolitical tensions. Higher uncertainty leads to lower risk appetite, reduced valuations, and sharp intraday swings. Defensive sectors like utilities and consumer staples may outperform, while cyclical sectors suffer.
Bond Markets: Government bonds of stable economies often benefit from “flight-to-safety” behavior. Yields fall as investors seek protection, while bonds from politically unstable regions face rising yields and falling prices.
Commodities: Commodities are highly sensitive to geopolitical risk. Oil prices often surge during Middle East tensions, while gold tends to rise as a safe-haven asset. Agricultural and industrial commodities may also face supply disruptions.
Currency Markets: Safe-haven currencies such as the US dollar, Swiss franc, and Japanese yen usually strengthen during geopolitical crises, while currencies of emerging markets and conflict-affected regions weaken sharply.
Cryptocurrencies: Although sometimes viewed as alternative safe assets, cryptocurrencies often experience heightened volatility during geopolitical shocks due to speculative behavior and liquidity concerns.
Investor Psychology and Volatility Amplification
Geopolitical risk amplifies volatility largely through investor psychology. Fear, uncertainty, and herd behavior play a crucial role in market reactions. News headlines, social media, and 24/7 global media coverage intensify emotional responses, often leading to exaggerated price movements. Algorithmic and high-frequency trading systems further accelerate volatility by reacting instantly to geopolitical news triggers.
In many cases, markets initially overreact to geopolitical events, followed by partial recoveries once the situation becomes clearer. However, prolonged or escalating conflicts can lead to sustained volatility and long-term repricing of assets.
Role of Globalization and Interconnected Markets
Globalization has magnified the impact of geopolitical risk on financial markets. Modern supply chains span multiple countries, meaning disruptions in one region can affect production, inflation, and earnings worldwide. Financial institutions are also deeply interconnected, allowing shocks to spread rapidly across borders. This interconnectedness ensures that geopolitical risk is no longer a local issue—it is a global market concern 🌐.
Risk Management and Strategic Implications
For investors and traders, understanding geopolitical risk is essential for effective risk management. Diversification across asset classes, regions, and sectors helps reduce exposure to political shocks. Hedging strategies using options, commodities like gold, or safe-haven currencies can also mitigate downside risk. Long-term investors often benefit from maintaining discipline and avoiding panic-driven decisions during geopolitical crises.
From a policy perspective, central banks and governments closely monitor geopolitical developments, as they can influence inflation, growth, and financial stability. In extreme cases, geopolitical shocks may prompt emergency monetary or fiscal interventions to stabilize markets.
Conclusion
Geopolitical risk is a persistent and unavoidable feature of global financial markets. By disrupting economic stability, altering investor sentiment, and triggering rapid capital flows, geopolitical events are a major cause of market volatility. As global political dynamics continue to evolve—with rising multipolar tensions, trade fragmentation, and regional conflicts—markets are likely to experience frequent bouts of uncertainty and sharp price swings.
For market participants, the key lies not in predicting geopolitical events—which is often impossible—but in understanding their potential impact and preparing resilient investment strategies. In an era where politics and markets are deeply intertwined, geopolitical risk will remain one of the most powerful forces shaping financial market volatility 📊⚠️.

Global Trade Imbalance: Causes and ConsequencesGlobal trade imbalance refers to a persistent difference between a country’s exports and imports when trading with the rest of the world. When a nation consistently exports more than it imports, it runs a trade surplus; when it imports more than it exports, it runs a trade deficit. While short-term imbalances are a normal part of international trade, long-lasting and large imbalances can shape global economic stability, influence currency movements, affect employment, and even create geopolitical tensions. In today’s interconnected world, understanding global trade imbalance is crucial for policymakers, investors, businesses, and traders.
Understanding the Concept of Trade Imbalance
At its core, a trade imbalance reflects differences in economic structure, productivity, consumption patterns, and savings behavior among countries. Developing economies often run trade deficits as they import capital goods and technology to support growth, while export-oriented economies may generate surpluses by focusing on manufacturing and external demand. Trade imbalances are recorded in a country’s current account, which also includes services, income flows, and transfers, but goods trade usually dominates the discussion.
Trade imbalances are not inherently negative. For example, the United States has run trade deficits for decades while maintaining strong economic growth and attracting global capital. However, when imbalances become excessive or politically sensitive, they can trigger policy responses such as tariffs, currency interventions, or trade agreements.
Major Causes of Global Trade Imbalance
One of the most important drivers of global trade imbalance is differences in savings and investment rates. Countries with high domestic savings and relatively lower consumption—such as China, Germany, and Japan—tend to export more than they import, creating trade surpluses. In contrast, countries with high consumption and lower savings—such as the United States—often rely on imports, resulting in trade deficits.
Exchange rate policies also play a critical role. A weaker currency makes exports cheaper and imports more expensive, supporting trade surpluses. Some countries have historically managed or intervened in their currencies to maintain export competitiveness. Conversely, strong currencies can make exports less competitive, widening trade deficits.
Another key factor is economic structure and competitiveness. Countries specializing in high-value manufacturing, technology, or capital goods often dominate global exports. Meanwhile, economies dependent on commodity imports or consumer goods may experience persistent deficits. Labor costs, productivity levels, infrastructure quality, and innovation capacity all influence trade performance.
Globalization and supply chains have further contributed to trade imbalances. Multinational companies often locate production where costs are lowest, exporting finished goods to consumer markets. As a result, manufacturing hubs accumulate trade surpluses, while consumption-driven economies absorb deficits.
Role of Capital Flows and Financial Markets
Trade imbalances are closely linked to capital flows. A country running a trade deficit must attract foreign capital to finance it, usually through foreign direct investment (FDI), portfolio investment, or borrowing. For example, the U.S. trade deficit is matched by strong inflows into U.S. Treasury bonds, equities, and real estate. This relationship shows that trade deficits are not just about goods, but also about confidence in an economy’s financial markets.
However, reliance on foreign capital can increase vulnerability. Sudden reversals of capital flows may lead to currency depreciation, higher interest rates, and financial instability, especially in emerging markets.
Economic and Social Consequences
Persistent global trade imbalances can have wide-ranging effects. In surplus countries, heavy dependence on exports can make growth vulnerable to external demand shocks. A slowdown in global trade or protectionist policies can quickly hurt employment and industrial output.
In deficit countries, large trade gaps may contribute to industrial decline and job losses in manufacturing sectors. This has been a major political issue in several advanced economies, fueling debates about globalization, outsourcing, and fair trade. Rising income inequality and regional economic disparities are often linked to long-term trade deficits.
Trade imbalances also influence currency markets. Deficit countries may experience downward pressure on their currencies over time, while surplus countries may face appreciation pressure. These movements affect inflation, interest rates, and central bank policies, directly impacting global financial markets.
Trade Imbalances and Geopolitics
Global trade imbalance is not just an economic issue; it is also deeply political. Large imbalances between major economies have led to trade disputes, sanctions, and tariff wars. Governments may accuse trading partners of unfair practices such as subsidies, dumping, or currency manipulation.
Such tensions can disrupt global supply chains, reduce investor confidence, and slow global growth. International institutions like the World Trade Organization (WTO), International Monetary Fund (IMF), and G20 often emphasize the need to reduce excessive imbalances through structural reforms rather than protectionism.
Impact on Emerging and Developing Economies
For emerging markets, trade imbalances present both opportunities and risks. Export-led growth strategies have helped many countries industrialize and reduce poverty. However, over-reliance on exports—especially commodities—can expose economies to volatile global prices and demand cycles.
Trade deficits in developing countries can be manageable if they finance productive investments, such as infrastructure and technology. Problems arise when deficits fund consumption instead of growth, increasing external debt and financial fragility.
Addressing Global Trade Imbalance
Reducing global trade imbalance requires coordinated policy efforts. Surplus countries can encourage domestic consumption, raise wages, and invest more at home. Deficit countries can boost savings, improve productivity, and enhance export competitiveness through innovation and skill development.
Exchange rate flexibility is also crucial. Allowing currencies to reflect economic fundamentals can help correct imbalances over time. Structural reforms, such as improving ease of doing business, strengthening infrastructure, and upgrading manufacturing capabilities, play a long-term role.
At the global level, cooperation is essential. Protectionist measures may reduce deficits temporarily but often lead to retaliation and higher costs. Sustainable solutions focus on balanced growth, open markets, and fair competition.
Conclusion
Global trade imbalance is a complex and multifaceted phenomenon shaped by economic structures, financial flows, currency policies, and global supply chains. While trade surpluses and deficits are natural outcomes of international trade, persistent and large imbalances can create economic vulnerabilities and political tensions. In an increasingly interconnected world, addressing global trade imbalance requires thoughtful domestic reforms and strong international cooperation. Rather than viewing imbalances as purely negative, policymakers and market participants must understand their underlying causes and manage them in a way that supports stable, inclusive, and sustainable global growth.

Global Commodity Impact: The Forces Shaping the Market 1. Introduction to Global Commodities
Global commodities are raw materials or primary agricultural products that are traded internationally, such as oil, gold, wheat, and copper. These commodities form the backbone of the global economy, influencing everything from production costs to geopolitical strategies. Understanding the dynamics of global commodities is crucial for policymakers, investors, and businesses, as fluctuations in these markets can have ripple effects across industries and countries.
The global commodities market operates on supply and demand fundamentals, but it is also heavily influenced by speculative trading, geopolitical events, and macroeconomic policies. For example, a sudden shortage of crude oil due to political unrest can spike prices globally, affecting transportation, manufacturing, and consumer goods.
2. Key Categories of Commodities
Commodities are broadly classified into three main categories:
a. Energy Commodities
Energy commodities include crude oil, natural gas, coal, and renewable energy sources. They are critical because energy costs affect almost every sector of the economy. For instance, a rise in crude oil prices increases transportation costs, which in turn drives up the price of goods.
b. Agricultural Commodities
Agricultural products like wheat, corn, soybeans, coffee, and sugar are subject to seasonal fluctuations, weather conditions, and global demand. Climate change, pests, and natural disasters can disrupt supply chains, leading to price volatility in food markets worldwide.
c. Metals and Minerals
Metals, including gold, silver, copper, and aluminum, are essential for industries such as construction, electronics, and jewelry. Precious metals like gold and silver often act as safe-haven assets during economic uncertainty, while industrial metals are more closely tied to global economic growth and industrial activity.
3. Factors Influencing Global Commodity Prices
The price of commodities is highly sensitive to various global factors, including:
a. Supply and Demand Dynamics
Basic economics governs commodity prices: when demand exceeds supply, prices rise; when supply exceeds demand, prices fall. For example, increased industrial activity in emerging markets can drive up demand for copper, while poor harvests can push grain prices higher.
b. Geopolitical Events
Political instability, wars, and trade sanctions can disrupt the supply of key commodities. For instance, conflicts in the Middle East often lead to higher oil prices due to supply uncertainty. Similarly, export restrictions by major producing countries can impact global food and metal prices.
c. Currency Fluctuations
Commodities are often priced in U.S. dollars. Therefore, fluctuations in the dollar’s value affect commodity prices globally. A weaker dollar can make commodities cheaper for foreign buyers, potentially increasing demand, while a stronger dollar can have the opposite effect.
d. Inflation and Interest Rates
High inflation often leads to increased commodity prices, as raw materials are seen as a hedge against inflation. Conversely, rising interest rates can dampen demand for commodities by increasing borrowing costs and slowing economic growth.
4. Economic Impact of Commodity Price Fluctuations
Commodity price movements can have far-reaching effects on economies worldwide:
a. Impact on Emerging Markets
Emerging economies that rely heavily on commodity exports—such as oil, minerals, or agricultural products—experience significant impacts when prices fluctuate. For instance, a drop in crude oil prices can lead to fiscal deficits in oil-exporting countries.
b. Impact on Consumers
Rising commodity prices translate into higher costs for essential goods and services, including food, fuel, and electricity. This affects household budgets and can lead to inflationary pressures.
c. Impact on Industries
Industries that rely on commodities as raw materials, such as manufacturing, construction, and transportation, are directly impacted by price changes. For example, higher steel prices increase construction costs, which can slow infrastructure development.
5. Environmental and Social Considerations
The extraction, production, and transportation of commodities have profound environmental and social consequences. Mining and drilling can lead to deforestation, water pollution, and loss of biodiversity. Agricultural practices may contribute to soil degradation and greenhouse gas emissions. Socially, commodity booms and busts can affect employment, income distribution, and migration patterns in producing regions.
6. Global Trade and Commodity Markets
Commodity markets are interconnected, and global trade plays a vital role in balancing supply and demand. Key trading hubs such as the New York Mercantile Exchange (NYMEX), London Metal Exchange (LME), and Chicago Board of Trade (CBOT) facilitate price discovery and risk management through futures contracts.
Trade policies, tariffs, and agreements also influence commodity flows. For example, free trade agreements can lower barriers, boosting commodity exports, whereas protectionist policies may restrict trade and create supply imbalances.
7. The Role of Technology and Innovation
Advancements in technology, data analytics, and artificial intelligence are transforming commodity markets. Precision agriculture, for instance, enhances crop yields and reduces waste, impacting global food supply. Similarly, digital trading platforms and algorithmic trading improve market efficiency and liquidity. Renewable energy technologies, such as solar and wind, are reshaping energy commodity demand by gradually reducing reliance on fossil fuels.
8. Future Outlook and Challenges
The global commodity landscape faces multiple challenges and opportunities:
Climate Change: Extreme weather events and changing precipitation patterns may disrupt agricultural and energy production.
Geopolitical Tensions: Conflicts, sanctions, and trade wars will continue to create volatility.
Sustainable Practices: Increasing global demand for sustainable and ethical commodities will shape production and trade policies.
Technological Disruption: Automation, renewable energy adoption, and smart supply chains will redefine commodity production and consumption.
Investors, businesses, and policymakers must adapt to these trends to manage risks and seize opportunities in the global commodity ecosystem.
9. Conclusion
Global commodities are more than just raw materials—they are the lifeblood of the world economy. Their prices influence production costs, consumer prices, and international trade, while their supply and sustainability impact environmental and social structures. Understanding the intricate web of factors that affect commodities—from geopolitics and macroeconomics to technology and climate—is essential for navigating the modern global market. Stakeholders must be proactive, resilient, and innovative to thrive amid the volatility and opportunities that global commodities present.

Understanding U.S. Federal Reserve PoliciesThe Federal Reserve (Fed), established in 1913, is the central bank of the United States. Its primary role is to maintain financial stability, ensure maximum employment, and control inflation. To achieve these objectives, the Fed implements various monetary policies, which are broadly categorized as expansionary or contractionary, depending on the economic conditions. These policies influence the supply of money, interest rates, and credit availability in the economy.
1. Structure of the Federal Reserve
The Federal Reserve consists of three key components:
Board of Governors: Located in Washington, D.C., the Board oversees the Fed’s operations and sets key policies.
Federal Open Market Committee (FOMC): Responsible for open market operations, interest rate decisions, and guiding monetary policy.
12 Regional Federal Reserve Banks: Operate across the U.S., monitoring local economic conditions and implementing Fed policies regionally.
This structure ensures that the Fed can respond both nationally and regionally to economic challenges.
2. Objectives of Federal Reserve Policies
The Fed has three main policy objectives:
Price Stability: Controlling inflation to maintain the purchasing power of the U.S. dollar.
Maximum Employment: Supporting a labor market where everyone who wants a job can find one.
Moderate Long-term Interest Rates: Ensuring borrowing costs are sustainable for businesses and households.
Balancing these objectives requires careful calibration of monetary tools, as aggressive measures to curb inflation may slow employment growth, and vice versa.
3. Tools of Monetary Policy
The Federal Reserve uses several tools to influence the economy:
a. Open Market Operations (OMO)
Open market operations are the Fed’s most frequently used tool. This involves the buying and selling of U.S. Treasury securities in the open market.
Buying securities injects liquidity into the banking system, lowers interest rates, and encourages borrowing and investment (expansionary policy).
Selling securities withdraws liquidity, raises interest rates, and helps control inflation (contractionary policy).
OMO allows the Fed to quickly adjust short-term interest rates and stabilize the financial system.
b. Discount Rate
The discount rate is the interest rate the Fed charges commercial banks for short-term loans.
Lowering the discount rate makes borrowing cheaper, increasing credit availability.
Raising the rate discourages borrowing and slows down economic activity to control inflation.
c. Reserve Requirements
Banks are required to hold a certain percentage of deposits as reserves.
Reducing reserve requirements frees up more money for lending.
Increasing reserve requirements reduces the money supply and helps manage inflation.
d. Interest on Excess Reserves (IOER)
The Fed pays interest on excess reserves held by banks.
Higher IOER encourages banks to hold more reserves, reducing lending.
Lower IOER encourages banks to lend more, stimulating economic activity.
4. Types of Federal Reserve Policies
a. Expansionary Monetary Policy
Used during economic slowdowns or recessions to stimulate growth. Key actions include:
Lowering the federal funds rate.
Reducing reserve requirements.
Buying government securities through OMOs.
The goal is to increase liquidity, boost consumer spending, and encourage business investments.
b. Contractionary Monetary Policy
Used when inflation is high or the economy is overheating. Key actions include:
Raising the federal funds rate.
Increasing reserve requirements.
Selling government securities through OMOs.
This policy reduces money supply, slows down borrowing, and helps stabilize prices.
5. Recent Trends in Federal Reserve Policies
In recent years, the Fed has adapted to modern economic challenges:
Quantitative Easing (QE): In response to financial crises, the Fed has purchased long-term securities to inject liquidity into the economy. QE lowers long-term interest rates and encourages lending.
Forward Guidance: The Fed communicates its future policy intentions to shape market expectations, providing clarity to investors and businesses.
Crisis Management Tools: During economic shocks, such as the 2008 financial crisis or the COVID-19 pandemic, the Fed employed emergency lending programs and expanded its balance sheet to stabilize markets.
6. Impact on the Economy
Federal Reserve policies directly influence:
Interest Rates: Lower interest rates encourage borrowing and investment, while higher rates control inflation.
Employment: Expansionary policies can stimulate job creation, while contractionary measures may slow employment growth.
Inflation: By controlling the money supply, the Fed can maintain price stability.
Financial Markets: Policy decisions affect stock and bond markets, exchange rates, and investor sentiment.
7. Challenges in Federal Reserve Policy
The Fed faces several challenges:
Lag Effect: Monetary policy takes time to impact the economy, sometimes months or years.
Global Factors: Global trade, geopolitical tensions, and foreign central bank policies can influence U.S. economic outcomes.
Balancing Act: The Fed must simultaneously manage inflation and employment, which often require conflicting approaches.
8. Conclusion
The U.S. Federal Reserve plays a crucial role in maintaining economic stability. Through a combination of interest rate adjustments, reserve requirements, open market operations, and unconventional tools like quantitative easing, the Fed influences economic growth, inflation, and employment. Understanding these policies is essential for businesses, investors, and policymakers to navigate the complex U.S. and global financial environment.
In an increasingly interconnected world, the Fed’s decisions not only impact the domestic economy but also have far-reaching implications for global markets. Its policies remain central to understanding the health and direction of the U.S. economy.

Whale Watching: What Institutional Flow Actually Tells Us
In the Ocean of Markets, the Biggest Players Leave the Deepest Wakes
Most retail traders stare at price.
Serious traders watch who is behind the move.
In the era of AI and real‑time data, you don't have to guess what the "smart money" might be doing. You can read their footprints in volume, order flow, and on‑chain behavior — then decide whether to swim with them or stay out of the way.
Who Are the Whales, Really?
"Whales" aren't mythical creatures. They're large players whose orders are big enough to move the market:
Hedge funds and prop firms
Pension and mutual funds
Investment banks and market‑making desks
In crypto: early adopters, exchange wallets, protocol treasuries and large funds
They don't trade like retail because they can't . Size forces them to:
Enter and exit over time
Hide intent with execution algorithms
Use levels where liquidity is deep enough to absorb flow
That's why their activity leaves patterns you can study.
Why Following Flow Matters More in the AI Era
AI and automation haven't made whales less important — they've made them more efficient:
Execution algos slice large orders into small pieces
Smart routing hunts for the best liquidity across venues
Portfolio models rebalance at increasingly precise trigger points
That means big decisions (accumulation, distribution, hedging, de‑risking) still show up in:
Unusual volume where price barely moves
Levels that absorb wave after wave of orders
On‑chain flows into and out of exchanges (for crypto)
You don't need to know who the whale is. You just need to recognize when "someone big" is quietly changing their exposure.
Three Practical Ways to Spot Whale Footprints
Volume That Doesn't Match the Candle
High volume but small candle body can signal accumulation or distribution.
Repeated volume spikes at the same level hint at a large resting order being filled.
Order Flow and Liquidity Behavior
Blocks and icebergs: large orders sliced into many smaller prints at the same price.
Support that "refuses" to break despite aggressive selling.
Resistance that repeatedly rejects pushes higher.
On‑Chain Flows (Crypto)
Big transfers to exchanges often precede potential selling pressure.
Big transfers from exchanges into cold wallets often align with accumulation.
Concentration in a few wallets can increase systemic risk.
AI tools can monitor all this in the background, pinging you only when something unusual happens.
Thinking in Terms of the Accumulation/Distribution Cycle
Zoom out and you see the same story play out over and over:
Accumulation – Big players quietly build positions while sentiment is bearish.
Markup – Price trends higher as demand overwhelms supply.
Distribution – Whales offload to latecomers near highs.
Markdown – Price grinds or flushes lower as supply dominates.
You can't know every motive behind every print. But you can ask:
"Does the current behavior look more like quiet accumulation or organised distribution?"
"Is volume confirming or contradicting the move?"
"Am I buying from strong hands or selling to them?"
How AI Can Help You Track Whales Smarter
Instead of manually staring at raw volume all day, AI‑driven tools can:
Tag and classify large prints and block trades
Detect recurring absorption at key levels
Aggregate on‑chain flows into simple dashboards (net inflows/outflows)
Alert you when "unusual" activity appears relative to normal behavior
Your edge isn't memorizing every tick — it's designing the rules for what counts as meaningful whale activity, and letting systems watch for you.
Staying Grounded: What Whale Watching Can't Do
It can't guarantee direction — whales hedge, scale, and reposition.
It can't replace risk management — big players can be early or wrong.
It can't turn a bad strategy into a good one — it can only improve timing and context.
Treat whale analysis as an extra lens, not a green‑light signal by itself.
Your Turn
How much weight do you give to institutional flow in your trading decisions?
Do you focus more on volume, order flow tools, or on‑chain metrics if you trade crypto?
Share what has (and hasn't) worked for you — your process might help someone else stop swimming blind.

“Know the Market Cycle — Don’t Enter Too Late📚 Complete Guide to Market Cycles
1️⃣ What Is a Market Cycle?
A market cycle means:
Markets move repeatedly between fear and greed.
📌 No market moves in a straight line.
All markets rotate through four main phases.
2️⃣ The Four Main Phases of a Market Cycle
① Accumulation
• After a major sell-off
• Price ranges near the bottom
• Low but smart volume
• Institutions start buying
📌 Best phase for gradual and patient buying
② Markup
• Range breakout
• Higher highs & higher lows
• Positive news increases
• Smart money flows in
📌 Best phase to hold and add to positions
③ Distribution
• Price near all-time highs
• Slow, choppy price action
• High volume with little progress
• Smart money starts selling
📌 Exit phase for professionals
④ Markdown
• Support levels break
• Fear and negative news dominate
• Liquidations and panic selling
📌 Worst phase for emotional buying
3️⃣ Market Emotion Cycle (Very Important)
Order of emotions:
Despair → Hope → Optimism → Excitement → Greed → Euphoria → Denial → Fear → Panic → Capitulation → Depression
📌 Price reverses before emotions do
4️⃣ Market Cycles Across Timeframes
Cycles exist on all timeframes:
Timeframe
Monthly Multi-year cycles
Daily Annual cycles
4H / 1H Weekly cycles
5m Intraday cycles
📌 The higher-timeframe cycle controls the lower one
5️⃣ Cycle vs Trend
• Trend = price movement
• Cycle = market’s position in the bigger story
📌 A market can be in an uptrend but still be in the Distribution phase.
6️⃣ Tools to Identify Cycle Phases
🔹 Price Action
• HH/HL vs LH/LL structures
• Support & resistance behavior
🔹 Volume
• Rising volume without price progress → Distribution
• Falling volume at lows → Accumulation
🔹 RSI
• Below 30 → selling exhaustion
• Divergences = phase change
🔹 Moving Averages
• Above MA200 → Markup
• Below MA200 → Markdown
7️⃣ Market Cycles & Smart Money
Smart money:
• Buys at lows
• Sells at highs
• Acts against crowd emotion
📌 Smart money footprints = price behavior + volume
8️⃣ Famous Market Cycles
🔸 Economic Cycle
Recession → Recovery → Expansion → Inflation → Recession
🔸 Interest Rate Cycle
Rate cuts → asset growth
Rate hikes → market pressure
🔸 Commodity Cycle
Supply shortage → price spike → production increase → oversupply → collapse
9️⃣ Practical Application
Steps:
1️⃣ Start with higher timeframe (Weekly / Daily)
2️⃣ Mark major highs and lows
3️⃣ Identify the cycle phase
4️⃣ Drop to lower timeframe for entries
📌 Cycle first, strategy second
🔟 Simple Cycle-Based Strategy
• Buy only in Accumulation or early Markup
• Sell in Distribution
• Avoid buying in Markdown
• Risk per trade: 1–2%
1️⃣1️⃣ Common Mistakes
❌ Buying during euphoria
❌ Selling during panic
❌ Ignoring higher timeframes
❌ Trading against the cycle phase
1️⃣2️⃣ Quick Checklist
☑️ Which phase is the market in?
☑️ What is volume saying?
☑️ What is market sentiment?
☑️ Is the higher timeframe aligned?
🧠 Golden Summary
Amateur traders watch price
Professional traders read cycles 📊

Central Bank Policies Explained for BeginnersWhat Is a Central Bank?
A central bank is the main monetary authority of a country. Examples include the Reserve Bank of India (RBI), Federal Reserve (USA), European Central Bank (ECB), and Bank of England. Unlike commercial banks, central banks do not deal directly with the public. Instead, they regulate banks, manage money supply, and guide the economy through policy decisions.
The central bank’s primary objectives usually include:
Price stability (controlling inflation)
Economic growth
Financial system stability
Employment support (in some countries)
Currency stability
Monetary Policy: The Core Tool
Central bank policies are mainly executed through monetary policy, which controls the supply and cost of money in the economy. Monetary policy is broadly divided into two types:
1. Expansionary Monetary Policy
This policy is used when the economy is slowing down or facing recession. The central bank increases money supply to encourage spending and investment.
Key features:
Lower interest rates
Cheaper loans
Increased borrowing by businesses and consumers
Boost to economic growth
Example: During an economic slowdown, the central bank may reduce interest rates so that businesses invest more and consumers spend more.
2. Contractionary Monetary Policy
This policy is used when inflation is too high. The central bank reduces money supply to control rising prices.
Key features:
Higher interest rates
Costlier loans
Reduced borrowing and spending
Inflation control
Example: When prices of goods rise rapidly, the central bank may increase interest rates to slow down excessive demand.
Key Central Bank Policy Tools
To implement monetary policy, central banks use several important tools:
1. Interest Rates (Policy Rates)
Interest rates are the most visible and powerful policy tool. In India, these include:
Repo Rate: The rate at which banks borrow money from the central bank.
Reverse Repo Rate: The rate at which banks lend excess funds to the central bank.
When the repo rate is reduced, banks can borrow cheaply and pass on lower rates to customers. When increased, borrowing becomes expensive.
2. Open Market Operations (OMO)
Open Market Operations involve buying or selling government securities in the open market.
Buying securities → increases money supply
Selling securities → reduces money supply
This tool helps control liquidity in the banking system.
3. Cash Reserve Ratio (CRR)
CRR is the percentage of deposits that banks must keep with the central bank in cash form.
Lower CRR → banks have more money to lend
Higher CRR → banks have less money to lend
4. Statutory Liquidity Ratio (SLR)
SLR requires banks to maintain a portion of deposits in safe assets like government bonds.
Lower SLR → more lending capacity
Higher SLR → tighter liquidity
5. Moral Suasion
This is an informal method where the central bank persuades banks to follow certain practices, such as reducing risky lending or supporting specific sectors.
Inflation Control and Price Stability
One of the most important roles of a central bank is controlling inflation. Inflation means a continuous rise in prices, which reduces purchasing power.
Central banks usually set an inflation target. If inflation goes above this target, contractionary policies are applied. If inflation falls too low (deflation risk), expansionary measures are used.
Stable inflation:
Protects savings
Encourages investment
Maintains economic confidence
Central Bank and Banking System Stability
Central banks act as the lender of last resort. When banks face liquidity problems, the central bank provides emergency funds to prevent bank failures and protect depositors.
They also:
Regulate and supervise banks
Set capital and risk guidelines
Ensure financial discipline
This role became especially important during financial crises, such as global recessions or banking failures.
Currency and Exchange Rate Management
Central banks manage the country’s currency and foreign exchange reserves. They may intervene in currency markets to prevent extreme volatility.
Strong currency → cheaper imports, controlled inflation
Weak currency → boosts exports but increases import costs
Balanced currency management helps maintain economic competitiveness and investor confidence.
Central Bank Independence
Most modern economies emphasize central bank independence, meaning the central bank can make policy decisions without political pressure. This independence helps ensure long-term economic stability rather than short-term political gains.
However, central banks still coordinate closely with governments, especially during crises.
Impact on Common People
Central bank policies directly affect everyday life:
Home loan and car loan interest rates
Fixed deposit and savings returns
Stock market and bond market movements
Employment and business growth
Inflation and cost of living
For example, when interest rates fall, EMIs become cheaper, but fixed deposit returns may decline.
Why Beginners Should Understand Central Bank Policies
For beginners in finance, trading, or investing, understanding central bank policies is crucial because:
Markets react strongly to policy announcements
Interest rate changes affect asset prices
Currency movements influence global trade
Long-term financial planning depends on monetary conditions
Even non-investors benefit by understanding why prices rise, why loans become expensive, or why the economy slows or accelerates.
Conclusion
Central bank policies may seem technical at first, but they are designed to balance growth, inflation, and financial stability. By adjusting interest rates, managing money supply, and regulating banks, central banks guide the economy through booms and downturns. For beginners, learning the basics of central bank policies builds a strong foundation for understanding economics, making smarter financial decisions, and navigating markets with confidence. Over time, this knowledge becomes a powerful tool in both personal finance and professional growth.
Risk Management Is Not Protection... It’s Your Edge!!!Most traders treat risk management like a seatbelt.
Something you use just in case.
🧳Professionals treat risk management as their main edge.
Because in trading, you don’t get paid for being right...
you get paid for staying in the game long enough for probabilities to work.
1️⃣ Risk Is Defined Before the Trade Exists
Before you think about entries or targets, one question must already be answered:
Where am I wrong?
If you don’t know where your idea fails,
you’re not managing risk... you’re hoping.
Professionals define risk first.
The trade only exists after invalidation is clear.
2️⃣ Small Risk Creates Big Freedom
When risk is small and predefined:
- hesitation disappears
- emotions calm down
- execution improves
Why?
Because no single trade matters anymore.
You stop needing trades to work, and that’s when trading becomes objective.
3️⃣ Risk Management Turns Losses Into Data
Losses are unavoidable.
Damage is optional.
A controlled loss is not a failure; it’s information.
Every loss tells you:
- the market condition wasn’t right
- the timing was early
- or the structure changed
When risk is managed, losses educate instead of punish.
4️⃣ Consistency Is Built on Risk, Not Wins
Winning streaks feel good.
They don’t build careers.
Surviving losing streaks does.
Proper risk management ensures:
- drawdowns stay shallow
- confidence stays intact
- discipline stays repeatable
That’s how traders last long enough to improve.
💡The Real Truth
You don’t need a better strategy.
You need better control over downside.
Risk management is what allows:
- imperfect strategies to work
- average win rates to grow accounts
- traders to evolve instead of quit
⚠️ Disclaimer: This is not financial advice. Always do your own research and manage risk properly.
📚 Stick to your trading plan regarding entries, risk, and management.
Good luck! 🍀
All Strategies Are Good; If Managed Properly!
~Richard Nasr

A Strategic Approach to Profiting from Market InformationNews Trading Without Noise
In modern financial markets, news travels faster than ever. Economic data releases, central bank statements, corporate earnings, geopolitical developments, and even social media posts can move prices within seconds. While news creates opportunities, it also creates noise—misleading signals, emotional reactions, rumors, and short-term volatility that can trap unprepared traders. News trading without noise is the disciplined practice of extracting high-quality, actionable information from news while filtering out distractions, overreactions, and irrelevant data. This approach allows traders to participate in major market moves with clarity, confidence, and consistency.
Understanding the Difference Between News and Noise
Not all news is equal. Markets react strongly only to information that changes expectations. Noise, on the other hand, consists of repetitive commentary, speculative opinions, exaggerated headlines, and minor developments that do not materially alter fundamentals. For example, a central bank interest rate decision that deviates from expectations is meaningful news, while repeated media debates about possible outcomes before the announcement are often noise. Successful news traders focus on what is new, unexpected, and impactful, rather than what is loud or popular.
Noise is dangerous because it triggers emotional trading—fear of missing out (FOMO), panic selling, or impulsive entries. News trading without noise requires emotional detachment and a rules-based mindset, where decisions are driven by predefined criteria rather than instant reactions.
Focusing on High-Impact News Events
A noise-free news trading strategy begins with selectivity. Traders should focus only on high-impact, scheduled, and well-defined events such as:
Central bank interest rate decisions and policy statements
Inflation data (CPI, PPI), employment reports, and GDP figures
Corporate earnings from market leaders
Major geopolitical events that affect global risk sentiment
Low-impact data releases and speculative breaking news should be ignored unless they directly affect market expectations. By limiting attention to a small set of powerful events, traders reduce cognitive overload and improve decision quality.
Trading Expectations, Not Headlines
Markets move based on the gap between expectations and reality. A positive news headline does not always lead to rising prices if the market had already priced in better outcomes. News trading without noise means understanding consensus forecasts, market positioning, and sentiment before the event.
For instance, if inflation data comes in high but slightly below expectations, markets may rally despite inflation remaining elevated. Traders who focus only on the headline number may misinterpret the move, while those who analyze expectations understand the true driver. This expectation-based approach helps traders align with institutional flows rather than fighting them.
Using Price Action as the Final Filter
Price action is the most reliable filter against noise. Before acting on news, traders should observe how the market reacts in the first few minutes or hours. Strong, sustained moves with high volume often indicate genuine institutional participation, while sharp spikes followed by quick reversals usually signal noise-driven volatility.
News trading without noise does not mean reacting instantly. Instead, it means waiting for confirmation. Breakouts above key resistance levels, breakdowns below support, or continuation patterns after news provide clearer, lower-risk entry points. Letting price validate the news helps traders avoid false signals.
Timeframe Alignment and Patience
Many traders lose money by trading news on timeframes that do not match the event’s significance. Short-term scalping during major news releases is extremely risky due to slippage and whipsaws. Noise-free news traders often prefer higher timeframes—15-minute, 1-hour, or even daily charts—where the true impact of news becomes clearer.
Patience is critical. Not every news event needs to be traded immediately. Sometimes the best opportunity emerges hours or days later, once the market digests the information and establishes a clear trend.
Risk Management Over Prediction
A core principle of news trading without noise is accepting uncertainty. News outcomes are unpredictable, and even correct analysis can result in losses due to unexpected market reactions. Therefore, risk management is more important than prediction.
Traders should use predefined stop-loss levels, conservative position sizing, and avoid overexposure during high-volatility periods. Protecting capital ensures longevity and reduces emotional pressure, making it easier to stay disciplined and ignore noise.
Avoiding Media and Social Media Traps
Financial media and social platforms often amplify noise. Sensational headlines, conflicting expert opinions, and real-time commentary can distort perception and push traders into impulsive decisions. Noise-free traders limit exposure to such inputs, relying instead on primary data sources, official releases, and their own analysis frameworks.
Developing a personal trading plan and sticking to it is the best defense against external influence. When traders know exactly what they are looking for, irrelevant information naturally fades into the background.
Building a Structured News Trading Framework
To trade news without noise, traders should create a structured framework that includes:
A predefined list of tradable news events
Clear rules for pre-news preparation and post-news execution
Specific technical levels for confirmation
Strict risk management guidelines
This structure transforms news trading from reactive gambling into a professional, repeatable process.
Conclusion
News trading without noise is not about being the fastest or reacting to every headline. It is about clarity, selectivity, and discipline. By focusing on high-impact information, understanding expectations, waiting for price confirmation, and managing risk carefully, traders can turn news from a source of confusion into a powerful trading edge. In an age of information overload, the ability to filter noise is not just an advantage—it is a necessity for consistent success in financial markets.

Global Soft Commodity Trading: Dynamics and StrategiesUnderstanding the Global Soft Commodity Market
Soft commodity markets operate on a global scale, with production concentrated in specific regions and consumption spread worldwide. For example, coffee production is dominated by Brazil, Vietnam, and Colombia, while cocoa largely comes from West African nations such as Ivory Coast and Ghana. Sugar production is led by Brazil and India, whereas wheat and corn are heavily produced in the United States, Russia, and parts of Europe.
This geographical imbalance between producers and consumers makes international trade essential. Prices are generally discovered on major commodity exchanges such as the Chicago Board of Trade (CBOT), Intercontinental Exchange (ICE), and Euronext. These exchanges provide standardized futures and options contracts that allow producers, consumers, traders, and investors to hedge risk or speculate on price movements.
Key Drivers of Soft Commodity Prices
Soft commodity prices are influenced by a wide range of interconnected factors:
Weather and Climate Conditions
Weather is the single most important factor affecting soft commodities. Droughts, floods, cyclones, frost, and changing rainfall patterns can significantly impact crop yields. Climate phenomena such as El Niño and La Niña often cause global supply disruptions, leading to sharp price volatility.
Supply and Demand Dynamics
Changes in population, income levels, dietary habits, and industrial usage directly affect demand. For instance, rising coffee consumption in Asia or increased ethanol production boosting corn demand can alter global price trends.
Government Policies and Trade Regulations
Export bans, import duties, subsidies, and minimum support prices play a crucial role, especially in emerging economies. Policies in major producing countries like India, Brazil, or the United States can influence global supply availability and price stability.
Currency Movements
Since most soft commodities are priced in U.S. dollars, fluctuations in currency exchange rates impact international trade. A weaker dollar generally supports higher commodity prices, while a stronger dollar can suppress demand.
Logistics and Geopolitical Factors
Transportation costs, port congestion, trade routes, and geopolitical tensions can disrupt supply chains. Conflicts, sanctions, or shipping bottlenecks often translate into sudden price spikes.
Market Participants in Soft Commodity Trading
The global soft commodity market includes diverse participants, each with different objectives:
Producers and Farmers use futures contracts to hedge against adverse price movements and protect their income.
Processors and End Users such as food manufacturers and textile companies hedge to stabilize input costs.
Traders and Merchants act as intermediaries, managing storage, transportation, and arbitrage opportunities.
Speculators and Investors, including hedge funds and institutional investors, aim to profit from price movements and market trends.
Retail Traders increasingly participate through online platforms offering commodity derivatives and ETFs.
Trading Instruments and Strategies
Soft commodities can be traded through several financial instruments:
Futures Contracts are the most common, providing standardized exposure to commodity prices.
Options allow traders to manage risk with limited downside.
ETFs and ETNs offer indirect exposure for investors who do not wish to trade futures directly.
Spot and Physical Trading is mainly used by large commercial participants.
Successful soft commodity trading often relies on a blend of strategies:
Fundamental Analysis, focusing on crop reports, weather forecasts, acreage data, and inventory levels.
Technical Analysis, using price charts, trends, support-resistance levels, and momentum indicators.
Seasonal Trading, which takes advantage of recurring patterns related to planting and harvesting cycles.
Spread Trading, involving the price difference between related commodities or different contract months.
Risks and Volatility in Soft Commodity Markets
Soft commodities are known for high volatility due to their dependence on uncontrollable natural factors. Sudden weather changes or policy announcements can cause rapid price movements. Additionally, leverage in futures trading can amplify both profits and losses. Effective risk management through position sizing, stop-loss strategies, and diversification is essential for long-term success.
Another key risk is market uncertainty due to climate change, which has increased the frequency of extreme weather events. This has made price forecasting more challenging, increasing both risk and opportunity for traders.
Role of Emerging Markets and Sustainability
Emerging markets play a growing role in global soft commodity trading, both as producers and consumers. Rising incomes in Asia and Africa are driving demand for food commodities, while technological advancements are improving agricultural productivity.
Sustainability and ESG (Environmental, Social, and Governance) considerations are also reshaping the market. Ethical sourcing, carbon footprints, and sustainable farming practices increasingly influence investment decisions and trade flows. Certifications such as Fair Trade and organic labeling are becoming important price differentiators in global markets.
Future Outlook of Global Soft Commodity Trading
The future of global soft commodity trading is expected to be shaped by several long-term trends: climate variability, population growth, technological innovation in agriculture, and digitalization of trading platforms. Data analytics, satellite imagery, and AI-driven weather models are enhancing market transparency and decision-making.
At the same time, increased financial participation is likely to keep volatility elevated, offering both risks and opportunities. Traders who can combine strong fundamental understanding with disciplined technical execution will be better positioned to navigate these evolving markets.
Conclusion
Global soft commodity trading is a dynamic and multifaceted market that reflects the intersection of nature, economics, and finance. From coffee and cocoa to grains and sugar, these commodities are essential to everyday life and global trade. While the market carries significant risks due to volatility and uncertainty, it also offers substantial opportunities for informed and disciplined traders. A deep understanding of global supply chains, weather patterns, policy impacts, and market behavior is essential for success in the ever-evolving world of soft commodity trading.
EURUSD: Wave Structure Education - Understanding Wave CountsEducational breakdown of wave structure counting using current EURUSD as a live example.
📚 WAVE STRUCTURE FUNDAMENTALS
Understanding wave counts is essential for identifying high-probability setups. Let's break down the key concepts using EURUSD's current structure.
🌊 WAVE 1 - The Foundation
Most Important Aspect: Wave 1 has two variations
Variation 1 - ABC Pattern:
Wave 1 forms as a corrective ABC structure before the main trend establishes.
Variation 2 - Straight Away:
Bearish: Higher High (HH) directly to Lower Low (LL)
Bullish: Lower Low (LL) directly to Higher High (HH)
Why This Matters:
Identifying which Wave 1 variation you're seeing helps you understand the strength and nature of the trend forming.
📈 EXTENSION WAVES - The Power Moves
Bearish Extension Pattern:
The sequence for bearish extensions:
Lower High (LH)
Higher Low (HL)
Lower High (LH)
Lower Low (LL)
Bullish Extension Pattern:
The sequence for bullish extensions:
Higher Low (HL)
Lower High (LH)
Higher Low (HL)
Higher High (HH)
Key Principle:
Extensions follow a specific pattern. Recognizing these sequences allows you to anticipate the completion point and trade accordingly.
💼 CURRENT EURUSD WAVE COUNT
Position: Bearish Wave 2 Extension (3 of 5)
What This Means:
We're in Wave 2 of the larger structure
Wave 2 is extending (showing the extension pattern)
Currently at position 3 within the 5-wave extension sequence
More downside expected to complete the extension
Trading Application:
Understanding we're in position 3 of 5 tells us:
Two more wave points to complete (4 and 5)
Wave 4 will be a pullback (selling opportunity)
Wave 5 will be the final leg down in this extension
🎓 Educational Takeaways:
1. Wave 1 Sets The Stage:
Always identify which Wave 1 variation you're seeing. ABC or Straight Away? This determines your initial bias.
2. Extensions Follow Patterns:
Both bullish and bearish extensions have specific sequences. Learn to recognize them.
3. Count = Roadmap:
When you know where you are in the wave count (like "3 of 5"), you know what's coming next.
4. Practice Required:
Wave counting takes time to master. Watch price action create these patterns repeatedly until recognition becomes second nature.
Summary:
Wave 1 has two variations: ABC or Straight Away (HH→LL / LL→HH)
Extensions follow patterns: Specific sequences for bullish/bearish
Current EURUSD: Bearish Wave 2 Extension, position 3 of 5
Next: Expect Wave 4 pullback, then Wave 5 completion
👍 Boost if you found this educational
👤 Follow for more wave structure lessons
💬 Questions? Drop them in comments

Why the Market Loves to Trap Traders!!!If trading ever feels personal, it’s not.
The market isn’t hunting you; it’s hunting liquidity.
Understanding this single idea changes how you read charts forever.
1️⃣ The Market Moves Toward Liquidity, Not Logic
Most traders expect price to move because a pattern is “complete” or a level is “perfect.”
In reality, price moves to where orders are sitting.
Where is liquidity usually found?
- Above obvious highs
- Below obvious lows
- Around round numbers
- Near breakout levels everyone is watching
The market goes where the orders are, not where traders hope it goes.
2️⃣ Breakouts Are the Most Common Liquidity Pools
When price approaches a clear resistance, traders place:
- breakout buys above
- stop-losses from shorts just above
That creates a liquidity magnet.
Price spikes above the level, fills those orders…
and often reverses sharply once liquidity is consumed.
That’s not manipulation... that’s mechanics.
3️⃣ Traps Reveal Who’s Really in Control
A trap happens when price:
- breaks a key level
- fails to follow through
- returns back inside the range
This tells you something critical:
➡️ The side that should have won… didn’t.
4️⃣ Professionals Don’t Chase; They Wait
Retail traders react to the breakout.
Professionals wait for the reaction after the breakout.
They ask:
- Did price accept above the level?
- Did momentum expand or fade?
- Did structure shift or snap back?
Patience turns traps into opportunities.
📚The Core Lesson
The market’s job is not to reward anticipation. It’s to test conviction.
Once you stop trading where everyone else enters and start observing who gets trapped,
price action becomes clearer, calmer, and more logical.
⚠️ Disclaimer: This is not financial advice. Always do your own research and manage risk properly.
📚 Stick to your trading plan regarding entries, risk, and management.
Good luck! 🍀
All Strategies Are Good; If Managed Properly!
~Richard Nasr
ESG and Carbon Credit TradingThe New Architecture of Sustainable Finance
In the modern global economy, sustainability has shifted from being a moral consideration to a strategic and financial imperative. At the center of this transformation lie ESG (Environmental, Social, and Governance) principles and carbon credit trading, two closely linked frameworks that are reshaping how businesses, investors, and governments measure value, manage risk, and pursue long-term growth. Together, they form the backbone of sustainable finance and climate-aligned markets.
Understanding ESG: Beyond Profits
ESG refers to a set of non-financial criteria used to evaluate a company’s operations and long-term resilience.
Environmental (E): How a company manages its impact on nature—carbon emissions, energy usage, waste management, water conservation, and biodiversity.
Social (S): How it treats employees, customers, and communities—labor practices, human rights, diversity, workplace safety, and customer responsibility.
Governance (G): How it is managed—board structure, executive compensation, transparency, shareholder rights, and ethical conduct.
Unlike traditional financial metrics that focus mainly on short-term profitability, ESG frameworks aim to capture long-term sustainability and risk-adjusted performance. Investors increasingly believe that companies with strong ESG practices are better positioned to handle regulatory changes, reputational risks, climate shocks, and social disruptions.
Why ESG Matters in Capital Markets
ESG has become a decisive factor in global capital allocation. Institutional investors, sovereign wealth funds, pension funds, and asset managers now integrate ESG scores into portfolio decisions. This shift is driven by three powerful forces:
Risk Management: Climate change, social unrest, and governance failures can destroy shareholder value. ESG analysis helps identify hidden risks.
Regulatory Pressure: Governments worldwide are mandating ESG disclosures, forcing companies to report sustainability metrics alongside financial results.
Investor Preference: A growing base of investors prefers companies aligned with ethical, environmental, and social responsibility.
As a result, ESG is no longer a “nice-to-have” feature—it directly affects stock valuations, borrowing costs, and access to global capital.
Carbon Credit Trading: Putting a Price on Pollution
Carbon credit trading is a market-based mechanism designed to reduce greenhouse gas emissions by assigning a monetary value to carbon dioxide and other greenhouse gases.
A carbon credit typically represents the right to emit one metric ton of CO₂ (or equivalent gases). Companies that emit less than their allowed quota can sell surplus credits, while high emitters must buy credits to offset excess emissions.
There are two major carbon markets:
Compliance Markets: Mandated by governments (e.g., cap-and-trade systems). Companies must comply with legally binding emission limits.
Voluntary Carbon Markets (VCMs): Companies voluntarily purchase credits to meet sustainability goals, net-zero pledges, or ESG commitments.
By attaching a financial cost to emissions, carbon trading incentivizes businesses to innovate, adopt cleaner technologies, and improve energy efficiency.
The Link Between ESG and Carbon Credit Trading
Carbon credit trading is a practical tool that directly supports the Environmental pillar of ESG. Companies with strong ESG strategies often use carbon credits to:
Offset unavoidable emissions
Achieve carbon neutrality or net-zero targets
Demonstrate measurable climate action to investors
Improve ESG ratings and sustainability scores
In essence, carbon markets convert climate responsibility into a tradable financial instrument, aligning environmental goals with market incentives.
Carbon Credits as a Financial Asset
Over time, carbon credits have evolved from regulatory instruments into tradable assets. They are now bought and sold by:
Corporations managing emissions
Financial institutions and hedge funds
ESG-focused investment funds
Commodity traders and exchanges
This financialization has increased liquidity, price discovery, and global participation, while also introducing volatility and speculation. Carbon prices now respond to policy changes, economic growth, energy transitions, and geopolitical developments—much like traditional commodities.
ESG Ratings and Corporate Strategy
Companies are increasingly embedding ESG into their core strategies rather than treating it as a compliance exercise. Carbon credit trading plays a critical role in this shift:
Operational Strategy: Firms invest in renewable energy, efficiency upgrades, and carbon offsets to reduce exposure to carbon costs.
Reputation Management: Transparent use of high-quality carbon credits enhances credibility with stakeholders.
Capital Access: Strong ESG performance lowers financing costs and attracts long-term investors.
However, the effectiveness of ESG depends on authentic action, not cosmetic compliance.
Challenges and Criticism
Despite their promise, ESG and carbon credit markets face several challenges:
Greenwashing: Some companies exaggerate ESG claims or rely excessively on low-quality carbon offsets.
Lack of Standardization: ESG ratings vary widely across agencies, creating confusion and inconsistency.
Carbon Credit Quality: Not all credits deliver real, additional, and permanent emission reductions.
Market Transparency: Voluntary carbon markets still lack unified oversight and pricing benchmarks.
These issues have sparked calls for stricter regulation, better disclosure standards, and improved verification mechanisms.
The Role of Technology
Technology is accelerating trust and efficiency in ESG and carbon markets:
Blockchain: Ensures traceability and prevents double-counting of carbon credits.
AI and Data Analytics: Improve ESG scoring, emissions tracking, and risk assessment.
Satellite Monitoring: Verifies forest conservation, renewable energy output, and land-use projects.
These innovations are helping transform ESG and carbon trading into more reliable and scalable systems.
Future Outlook: ESG and Carbon Trading as Economic Pillars
Looking ahead, ESG and carbon credit trading are expected to become central pillars of the global financial system. As climate risks intensify and governments tighten emissions regulations, carbon prices are likely to rise, making sustainability a competitive advantage rather than a cost burden.
Key future trends include:
Integration of carbon pricing into mainstream financial models
Expansion of regulated carbon markets across emerging economies
Greater convergence of ESG reporting standards
Increased investor scrutiny of carbon offset quality
Conclusion
ESG and carbon credit trading represent a fundamental shift in how markets define value, risk, and responsibility. By embedding environmental and social costs into financial decision-making, they bridge the gap between economic growth and planetary limits. While challenges remain, their evolution signals a future where sustainability and profitability are no longer opposing goals—but interconnected drivers of long-term success.
In this new financial architecture, companies that adapt early and authentically will not only comply with regulations but also gain strategic, reputational, and financial advantages in a rapidly changing world.

Why Risk–Reward Matters More Than Win Rate!!One of the biggest myths in trading is this:
“I need to win more trades to be profitable.”
✖️You don’t...
Some of the most profitable traders in the world win less than 50% of their trades.
So what’s the real edge?
👉 Risk–reward.
1️⃣ Win Rate Without Risk–Reward Is Meaningless
A trader who wins 70% of the time but risks 3 to make 1 is still bleeding slowly.
Meanwhile, a trader who wins only 40% of the time
but risks 1 to make 3 can grow consistently.🪜
Win rate tells you how often you’re right.
Risk–reward tells you how much it matters when you are.
2️⃣ Risk Defines the Trade Before Entry
Professionals don’t start with targets.
They start with invalidation.
They ask:
- Where is my idea wrong?
- Where does structure break?
- Where must I be out?
Only after risk is defined, do rewards become meaningful.🏆
If you don’t know where you’re wrong,
you don’t know what you’re trading.
3️⃣ Good Risk–Reward Creates Emotional Stability
When your risk is small and predefined:
- losses feel normal
- hesitation disappears
- overtrading drops
Why?
Because no single trade can hurt you badly❗️
Risk–reward doesn’t just protect your account.
It protects your mindset.
4️⃣ Risk–Reward Is What Builds Consistency
Consistency doesn’t come from winning streaks.
It comes from surviving losing streaks.📉
Proper risk–reward ensures:
- drawdowns stay shallow
- confidence stays intact
- discipline stays repeatable
That’s how traders last long enough to let probabilities work.
📚The Big Lesson
✔️You don’t need to be right more often.
✖️You need your winners to matter more than your losers.
When risk is controlled and reward is logical, trading stops feeling like gambling and starts feeling like execution.
⚠️ Disclaimer: This is not financial advice. Always do your own research and manage risk properly.
📚 Stick to your trading plan regarding entries, risk, and management.
Good luck! 🍀
All Strategies Are Good; If Managed Properly!
~Richard Nasr

Pharmaceutical Stocks: Growth, Stability, and OpportunitiesThe Healthcare Market
Pharmaceutical stocks represent companies engaged in the research, development, manufacturing, and marketing of medicines and healthcare products. These stocks play a crucial role in global equity markets because healthcare is a basic necessity, largely independent of economic cycles. As populations grow, age, and face new health challenges, the demand for medicines continues to rise, making the pharmaceutical sector one of the most resilient and strategically important industries worldwide.
Nature and Importance of the Pharmaceutical Sector
The pharmaceutical industry is built on innovation and scientific research. Companies invest heavily in research and development (R&D) to discover new drugs, improve existing treatments, and address unmet medical needs. This long-term focus makes pharma stocks unique compared to other sectors. While technology companies innovate in software or electronics, pharma firms innovate in human health, often requiring years of clinical trials, regulatory approvals, and large capital investments.
Pharma stocks are important not only for investors but also for society. Breakthrough drugs for cancer, diabetes, cardiovascular diseases, and infectious illnesses can significantly improve quality of life and extend life expectancy. Governments and healthcare systems depend on pharmaceutical companies to maintain public health, which ensures consistent demand for their products.
Types of Pharmaceutical Companies
Pharmaceutical stocks can broadly be divided into different categories. Large-cap pharmaceutical companies, often called “big pharma,” have diversified product portfolios, global distribution networks, and strong balance sheets. These companies usually provide stable revenues, regular dividends, and lower risk compared to smaller firms.
Mid-cap and small-cap pharma companies often focus on niche therapies, generic drugs, or contract manufacturing. While they carry higher risk, they can deliver higher growth if they succeed in expanding markets or securing regulatory approvals. Biotechnology companies, which are closely linked to pharma stocks, focus on cutting-edge research such as gene therapy, vaccines, and biologics. These stocks can be highly volatile but offer substantial upside potential.
Drivers of Growth in Pharma Stocks
Several factors drive the growth of pharmaceutical stocks. One of the most important is demographic change. Aging populations, especially in developed countries, increase demand for chronic disease treatments such as diabetes, arthritis, and heart-related conditions. At the same time, rising healthcare awareness and improving access to medicines in emerging markets support long-term growth.
Innovation is another key driver. Companies that successfully develop patented drugs enjoy pricing power and exclusivity for several years, leading to high profit margins. Vaccines, specialty drugs, and biologics have become major growth areas, particularly after global health crises highlighted the importance of rapid drug development.
Government healthcare spending and insurance coverage also influence pharma stocks. Increased public and private investment in healthcare infrastructure supports pharmaceutical sales. In many countries, policies encouraging generic drug use create opportunities for companies specializing in cost-effective medicines.
Risks Associated with Pharma Stocks
Despite their defensive nature, pharmaceutical stocks carry specific risks. One of the biggest challenges is regulatory uncertainty. Drug approvals depend on strict regulatory authorities, and delays or rejections can significantly impact a company’s share price. Even after approval, drugs may face post-marketing safety issues that lead to recalls or legal action.
Patent expiration is another major risk. When a blockbuster drug loses patent protection, generic competitors enter the market, sharply reducing revenues. This “patent cliff” can negatively affect earnings if companies fail to replace lost sales with new products.
Pricing pressure is also a growing concern. Governments and insurers often push for lower drug prices to control healthcare costs. This can reduce profit margins, particularly in developed markets. Currency fluctuations, especially for companies with global operations, can further affect financial performance.
Pharma Stocks as Defensive Investments
Pharmaceutical stocks are often considered defensive because demand for medicines remains relatively stable during economic downturns. Unlike sectors such as real estate or luxury goods, healthcare spending cannot be easily postponed. As a result, pharma stocks tend to show lower volatility during market corrections and provide portfolio stability.
Many large pharmaceutical companies pay consistent dividends, making them attractive to long-term and income-focused investors. Their strong cash flows allow them to reinvest in R&D while also rewarding shareholders. During periods of high inflation or market uncertainty, pharma stocks are often viewed as a safe haven.
Role of Emerging Markets and India
Emerging markets play an increasingly important role in the pharmaceutical industry. Countries like India and China have become major hubs for generic drug manufacturing and contract research. Indian pharmaceutical companies, in particular, are known for producing affordable medicines and supplying a large share of global generic drugs.
For investors, pharma stocks in emerging markets offer a balance of growth and cost efficiency. Expanding healthcare access, government support, and export opportunities contribute to long-term potential. However, these stocks may also face regulatory scrutiny from international markets, especially related to quality standards.
Investment Approach to Pharma Stocks
Investing in pharmaceutical stocks requires a long-term perspective. Fundamental analysis is crucial, focusing on a company’s product pipeline, R&D capabilities, regulatory track record, and financial strength. Diversification within the sector helps reduce risk, as not all drugs or companies succeed at the same time.
Some investors prefer large-cap pharma stocks for stability, while others allocate a smaller portion of their portfolio to high-growth biotech or specialty pharma companies. Monitoring clinical trial results, patent timelines, and policy changes is essential for informed decision-making.
Conclusion
Pharmaceutical stocks occupy a unique and powerful position in the global equity market. They combine elements of stability, innovation, and long-term growth driven by healthcare needs. While the sector faces challenges such as regulatory risks, patent expirations, and pricing pressures, its fundamental importance to society ensures sustained demand.
For investors, pharma stocks can serve as a defensive core holding while also offering opportunities for capital appreciation through innovation and emerging market growth. With careful analysis and a balanced approach, pharmaceutical stocks can play a vital role in building a resilient and diversified investment portfolio.

Why the Reaction Matters More Than the Level!!!Most traders spend their time hunting for the perfect level.✖️
Support. Resistance. Demand. Supply.
They draw the zone… and assume price must react.
But professionals know something crucial:
The level itself is not the edge.
The reaction is.
Here’s why.
1️⃣ Levels Are Common Knowledge
Everyone sees the same support.
Everyone sees the same resistance.
If levels alone were enough, everyone would be profitable.
A level is just a location.📍
It doesn’t tell you who is in control.
2️⃣The Reaction Reveals Intent
What matters is how price behaves at the level.
Ask yourself:
- Does price reject immediately or hesitate?
- Are candles impulsive or overlapping?
- Does price leave the level with strength or drift away slowly?
A strong reaction tells you:
➡️ One side stepped in aggressively.
A weak reaction tells you:
➡️ The level exists… but conviction doesn’t.
3️⃣ Clean Rejections Beat Perfect Levels
A slightly imperfect level with a violent reaction
is far more valuable than a textbook level with no follow-through.
Professionals wait for:
- sharp rejections
- momentum expansion
- structure confirmation
They don’t assume... they observe.
4️⃣ Failed Reactions Are Warnings
When price reaches a level and does nothing…
that silence is information.
Failed reactions often lead to:
- level breaks
- deeper moves
- trend continuation
The market is telling you:
➡️ “This level no longer matters.”
📚The Big Lesson
Levels tell you where to look.
Reactions tell you what to do.
If you shift your focus from drawing levels to reading behavior at levels,
your trading instantly becomes clearer and more objective.
⚠️ Disclaimer: This is not financial advice. Always do your own research and manage risk properly.
📚 Stick to your trading plan regarding entries, risk, and management.
Good luck! 🍀
All Strategies Are Good; If Managed Properly!
~Richard Nasr
Risk Psychology and Performance in Global Markets1. Defining Risk Psychology
Risk psychology, sometimes referred to as behavioral finance, examines how emotions, cognitive biases, and mental frameworks shape perceptions of risk and influence decision-making. Traditional economic theory assumes that market participants are rational actors who always make decisions based on complete information and logical analysis. However, decades of research, particularly by psychologists like Daniel Kahneman and Amos Tversky, have shown that human behavior often deviates from rationality. Traders may overreact to news, underestimate the probability of rare events, or follow herd behavior—actions that directly impact performance in global markets.
Risk psychology can be divided into several key dimensions:
Risk Perception: How individuals interpret and assess potential losses and gains.
Risk Tolerance: The degree to which an individual or organization is willing to accept uncertainty or potential financial loss.
Cognitive Biases: Systematic errors in thinking, such as overconfidence, anchoring, or confirmation bias.
Emotional Responses: Reactions such as fear, greed, panic, or euphoria that can override logical decision-making.
2. Cognitive Biases and Market Behavior
One of the central insights from risk psychology is that cognitive biases can significantly distort market performance. Some of the most influential biases include:
Overconfidence: Traders often overestimate their knowledge or forecasting ability, leading to excessive risk-taking or frequent trading. In global markets, overconfident investors may underestimate geopolitical risks or macroeconomic uncertainties, which can result in large losses.
Loss Aversion: This is the tendency to weigh potential losses more heavily than equivalent gains. In volatile markets, loss-averse behavior can lead investors to exit positions prematurely, missing potential recoveries.
Herding: Many investors follow the actions of the majority rather than independent analysis, leading to bubbles and crashes. The 2008 global financial crisis and other market corrections illustrate how herding behavior amplifies systemic risk.
Anchoring: Market participants often rely too heavily on a reference point, such as a stock's past high, when making decisions. This can lead to mispricing in fast-moving global markets.
These biases illustrate that market performance is as much about managing internal psychological factors as it is about external economic conditions. Recognizing and mitigating these biases is essential for achieving consistent performance.
3. Emotional Drivers in Global Markets
Emotions are another powerful factor affecting performance. Fear and greed are two dominant emotions influencing trading decisions:
Fear: Sudden market downturns, geopolitical events, or economic crises can trigger fear, leading to panic selling. Fear-driven actions often exacerbate volatility and can result in substantial losses.
Greed: Conversely, the desire for high returns can push investors into over-leveraged positions or speculative assets. Excessive greed may lead to ignoring warning signals, contributing to financial bubbles.
In global markets, these emotions are amplified by the 24/7 nature of trading, high-speed information flow, and exposure to international geopolitical and macroeconomic events. Investors must develop emotional discipline to withstand market volatility and maintain long-term performance.
4. Risk Tolerance and Portfolio Management
Risk psychology directly informs risk tolerance, which is crucial for portfolio construction and investment strategy. Understanding one’s own risk profile—or that of an organization—is essential for aligning investment choices with financial goals and market conditions.
Conservative Investors: Prefer stable, low-risk assets even if returns are modest. They may underperform in bullish markets but avoid significant drawdowns during crises.
Aggressive Investors: Willing to take on higher risk for the potential of greater returns. Their performance can be stellar in favorable conditions but highly volatile during downturns.
Institutional Risk Management: Large global institutions often implement structured risk management frameworks that combine quantitative models with psychological insights to mitigate irrational decision-making among traders.
Balancing risk tolerance with market opportunities is a core component of consistent performance. Investors who fail to match their strategies with their psychological profile often make impulsive decisions that negatively affect returns.
5. The Impact of Risk Psychology on Market Trends
Risk psychology doesn’t just affect individual investors—it can influence global market trends. Collective human behavior, shaped by shared perceptions of risk and sentiment, can drive market cycles:
Bull Markets: Optimism and reduced risk perception fuel buying, often inflating asset prices beyond fundamental values.
Bear Markets: Pessimism and heightened fear lead to selling, creating sharp declines.
Volatility Spikes: Emotional reactions to unexpected events, such as geopolitical crises or central bank announcements, can result in abrupt market swings.
Market sentiment indicators, like the Volatility Index (VIX), are essentially measures of collective risk psychology. Traders and institutions often use these tools to gauge sentiment and anticipate potential market movements.
6. Strategies to Mitigate Psychological Risk
Given the profound influence of risk psychology on performance, it is crucial for market participants to implement strategies to manage these effects:
Education and Awareness: Understanding common biases and emotional triggers helps investors make more rational decisions.
Structured Decision-Making: Using checklists, rules-based systems, and quantitative models reduces the influence of emotion on trading decisions.
Diversification: Spreading investments across asset classes, geographies, and strategies mitigates the impact of unexpected events and reduces stress.
Regular Reflection and Journaling: Tracking decisions, outcomes, and emotional states helps identify patterns and improve future performance.
Stress Testing: Simulating adverse scenarios allows traders and institutions to anticipate emotional responses and refine risk management.
7. Conclusion
Performance in global markets is a complex interplay of economic fundamentals, technical analysis, and, importantly, human psychology. Risk psychology illuminates the ways in which emotions, cognitive biases, and perception of uncertainty influence market behavior. Traders and investors who cultivate self-awareness, emotional discipline, and structured decision-making frameworks can navigate market volatility more effectively and improve long-term performance.
Global markets are inherently uncertain, and even the most sophisticated models cannot fully predict outcomes. By understanding risk psychology, market participants gain a powerful tool: insight into their own behavior and the collective behavior of others. This understanding not only enhances individual performance but also contributes to a more stable and resilient financial system.
In essence, mastering risk psychology is not about eliminating risk—it’s about managing human responses to risk, aligning decisions with long-term goals, and leveraging an understanding of human behavior to thrive in the complex world of global finance.
