Fade Silver In JanuarySilver is exhausted and overcrowded at +$75 and I expect a revision back down to low $60s. Leverage gets unwound and you get forced selling sub $70.
Centered Oscillators

First 2026 Shot on #NZDUSD ?📊 Morning Market Brief | London Session Prep
🔎 Instrument Focus: #NZDUSD
⚠️ Risk Environment: High
📈 Technical Overview:
I'm Not a fan of it but , lets see . with a valid momentum Structure we can take it as a QuickScalp
🚀 Trading Plan:
• Wait for Momentum around key levels
• No chasing moves, let price come to you
• Manage risk aggressively, protect capital first
🧠 Stay updated with real time news and macro events, visit 👉 @News_Ash_TheTrader_Bot
#Ash_TheTrader #Forex #EURUSD #MarketInsight #PriceAction #TradingPlan #RiskManagement #LondonSession #Scalping #Futures #NQ #Gold

LOOKS token to print a 10,000% move?On the above 4-day chart price action has corrected 99% since January 2022. A number of reasons now exist to be long, including.
1) Price action and RSI resistance breakouts.
2) Multiple oscillators print positive divergence with price action. The higher the time frame you go the stronger the divergence.
3) While the market has been in full panic mode volume has only increased on this token. I don’t know why. Every sell off is met with a large volume increase.
4) Not listed on major exchanges. Get in before crowd.
5) The falling wedge forecast. The forecast is measured from the highest to the lowest touch points. (Red circles). This is how a target from a wedge is forecast.
Is it possible price action continues correcting? Sure.
Is it probable? No.
Ww
Type: trade
Risk: <=6%
Timeframe for long: Yesterday
Return: 100x

Alphabet May Be OversoldAlphabet has pulled back after hitting a new all-time high, and some traders may think it’s oversold.
The first pattern on today’s chart is the rally between November 14 and November 25. The Internet giant held its ground yesterday after retracing half the advance, which may confirm its direction is pointing higher.
Second, GOOGL has bounced multiple times at its 21-day exponential moving average (EMA). It returned to the same EMA yesterday. Will that lure trend followers?
Next, stochastics have dipped to an oversold condition.
Finally, GOOGL is an active underlier in the options market. That could help traders take positions with calls and puts.
TradeStation has, for decades, advanced the trading industry, providing access to stocks, options and futures. If you're born to trade, we could be for you. See our Overview for more.
Past performance, whether actual or indicated by historical tests of strategies, is no guarantee of future performance or success. There is a possibility that you may sustain a loss equal to or greater than your entire investment regardless of which asset class you trade (equities, options or futures); therefore, you should not invest or risk money that you cannot afford to lose. Online trading is not suitable for all investors. View the document titled Characteristics and Risks of Standardized Options at www.TradeStation.com . Before trading any asset class, customers must read the relevant risk disclosure statements on www.TradeStation.com . System access and trade placement and execution may be delayed or fail due to market volatility and volume, quote delays, system and software errors, Internet traffic, outages and other factors.
Securities and futures trading is offered to self-directed customers by TradeStation Securities, Inc., a broker-dealer registered with the Securities and Exchange Commission and a futures commission merchant licensed with the Commodity Futures Trading Commission). TradeStation Securities is a member of the Financial Industry Regulatory Authority, the National Futures Association, and a number of exchanges.
Options trading is not suitable for all investors. Your TradeStation Securities’ account application to trade options will be considered and approved or disapproved based on all relevant factors, including your trading experience. See www.TradeStation.com . Visit www.TradeStation.com for full details on the costs and fees associated with options.
Margin trading involves risks, and it is important that you fully understand those risks before trading on margin. The Margin Disclosure Statement outlines many of those risks, including that you can lose more funds than you deposit in your margin account; your brokerage firm can force the sale of securities in your account; your brokerage firm can sell your securities without contacting you; and you are not entitled to an extension of time on a margin call. Review the Margin Disclosure Statement at www.TradeStation.com .
TradeStation Securities, Inc. and TradeStation Technologies, Inc. are each wholly owned subsidiaries of TradeStation Group, Inc., both operating, and providing products and services, under the TradeStation brand and trademark. When applying for, or purchasing, accounts, subscriptions, products and services, it is important that you know which company you will be dealing with. Visit www.TradeStation.com for further important information explaining what this means.

Nasdaq-100: Lower Low and Lower High?The Nasdaq-100 made a lower low, and now it might have made a lower high.
The first pattern on today’s chart is the November 21 low of 23,854, some 353 points below the October trough. That broke a series of higher lows since April.
Second, the tech-heavy index peaked at 25,835 on December 10. That was 347 points under the all-time record on October 29. That could represent a lower high after the lower low, potentially breaking seven months of uptrend.
Third, NDX stalled last week near October 31’s weekly close. That could suggest resistance has developed below the recent high.
Next, stochastics are dipping from an overbought condition.
Finally, prices are sliding below their 21-day exponential moving average and 50-day simple moving average. Those signals may reflect emerging weakness in the short- and intermediate-term timeframes.
TradeStation has, for decades, advanced the trading industry, providing access to stocks, options and futures. If you're born to trade, we could be for you. See our Overview for more.
Past performance, whether actual or indicated by historical tests of strategies, is no guarantee of future performance or success. There is a possibility that you may sustain a loss equal to or greater than your entire investment regardless of which asset class you trade (equities, options or futures); therefore, you should not invest or risk money that you cannot afford to lose. Online trading is not suitable for all investors. View the document titled Characteristics and Risks of Standardized Options at www.TradeStation.com . Before trading any asset class, customers must read the relevant risk disclosure statements on www.TradeStation.com . System access and trade placement and execution may be delayed or fail due to market volatility and volume, quote delays, system and software errors, Internet traffic, outages and other factors.
Securities and futures trading is offered to self-directed customers by TradeStation Securities, Inc., a broker-dealer registered with the Securities and Exchange Commission and a futures commission merchant licensed with the Commodity Futures Trading Commission). TradeStation Securities is a member of the Financial Industry Regulatory Authority, the National Futures Association, and a number of exchanges.
TradeStation Securities, Inc. and TradeStation Technologies, Inc. are each wholly owned subsidiaries of TradeStation Group, Inc., both operating, and providing products and services, under the TradeStation brand and trademark. When applying for, or purchasing, accounts, subscriptions, products and services, it is important that you know which company you will be dealing with. Visit www.TradeStation.com for further important information explaining what this means.

Extreme Fear Marks Historic Lows in Bitcoin SentimentQuinten Francois posted a brief but effective statement. He explained that all seasons of excessive fear were followed up by regrets. The market indicator he referred to is famous. The Crypto Fear and Greed Index triggered the high levels of fear again. The index fell to under the 20 level. Such a zone is typical of panic conditions. During such stages, retail confidence is undermined. Markets become increasingly intense in selling. The Bitcoin has just fallen short of major psychological milestones. The volatility rose drastically. The social media were dominated by negative sentiment. Merchants were emotional. There were well-established trends as seen by long-term investors.
What the Fear and Greed Index Tells you
The Fear and Greed Index follows the sentiment of the investors. It is a combination of volatility, volume, social sentiment, and momentum. Capitulation is indicated by extreme fear. Sellers scramble out of positions. Liquidations through force are accelerating declines. Weak hands are flushed out by leverage. In the past, such occurrences were bottoms in the market. Bitcoin usually backtracked soon thereafter. The recovery of prices was quicker than anticipated. Late sellers faced regret. The chart that is available in the post brings out several cycles. All of the extremes fear readings were followed by drastic rebounds. The information confirms the principles of contrarian investing.
Pattern Explained by Behavioral Finance
A significant role is taken by the human psychology. Investors are terrified of the losses than they appreciate gains. This idea is based on the behavioral finance studies. Research by Kahneman and Tversky describes loss aversion. Irrational decisions are inspired by fear. During uncertainty, panic selling is higher. Markets are ruthless to emotional responses. Composed persons have an advantage. Radical fear results in wrong pricing. Assets are traded at a low price. Patience is a virtue of long term capital. This is the psychological reality behind the message Quinten puts across. History repeats itself since a behavior is unchanging.
After price recovery is regret. Investors sell near lows. They wait for confirmation. Markets turn back against the expectation. Re-entry feels risky. Prices move higher quickly. Lack of opportunity induces emotional suffering. The same is the case with previous cycles. Fear peaks close to bottoms. Greed returns near tops. Emotions are hard to time. Punishment is more important than prophecy. Supreme fear puts faith to the test. Ready investors are the only ones who take decisive action.
Implications of this to the existing market
The present world is reminiscent of the previous recessions. The feeling is still highly negative. News cycles enhance negative thinking. There is the pressure of Macroeconomic uncertainty. Nevertheless, accumulation is observed on-chain. The long-term holders increase positions. Supply tightens gradually. The weak hands are shaken out by volatility. These are those conditions that had historically favored patient capital. The post by Quinten is an acknowledgment. During times of downfall, fear is forever. History shows otherwise. Markets eventually recover. Emotional exits are followed by regrets.

Eli Lilly May Be OversoldEli Lilly surged last month, and now it’s pulled back.
The first pattern on today’s chart is the 50 percent retracement of the advance. That may suggest its direction is pointing higher. Prices have also stabilized at the psychologically important $1,000 level.
Second, the 50-day simple moving average (SMA) had a “golden cross” above the 200-day SMA in early November. That could reflect a bullish long-term uptrend.
Third, the 8-day exponential moving average (EMA) has remained above the 21-day EMA. That may reflect a bullish short-term uptrend.
Finally, stochastics have dipped to an oversold condition.
TradeStation has, for decades, advanced the trading industry, providing access to stocks, options and futures. If you're born to trade, we could be for you. See our Overview for more.
Past performance, whether actual or indicated by historical tests of strategies, is no guarantee of future performance or success. There is a possibility that you may sustain a loss equal to or greater than your entire investment regardless of which asset class you trade (equities, options or futures); therefore, you should not invest or risk money that you cannot afford to lose. Online trading is not suitable for all investors. View the document titled Characteristics and Risks of Standardized Options at www.TradeStation.com . Before trading any asset class, customers must read the relevant risk disclosure statements on www.TradeStation.com . System access and trade placement and execution may be delayed or fail due to market volatility and volume, quote delays, system and software errors, Internet traffic, outages and other factors.
Securities and futures trading is offered to self-directed customers by TradeStation Securities, Inc., a broker-dealer registered with the Securities and Exchange Commission and a futures commission merchant licensed with the Commodity Futures Trading Commission). TradeStation Securities is a member of the Financial Industry Regulatory Authority, the National Futures Association, and a number of exchanges.
TradeStation Securities, Inc. and TradeStation Technologies, Inc. are each wholly owned subsidiaries of TradeStation Group, Inc., both operating, and providing products and services, under the TradeStation brand and trademark. When applying for, or purchasing, accounts, subscriptions, products and services, it is important that you know which company you will be dealing with. Visit www.TradeStation.com for further important information explaining what this means.

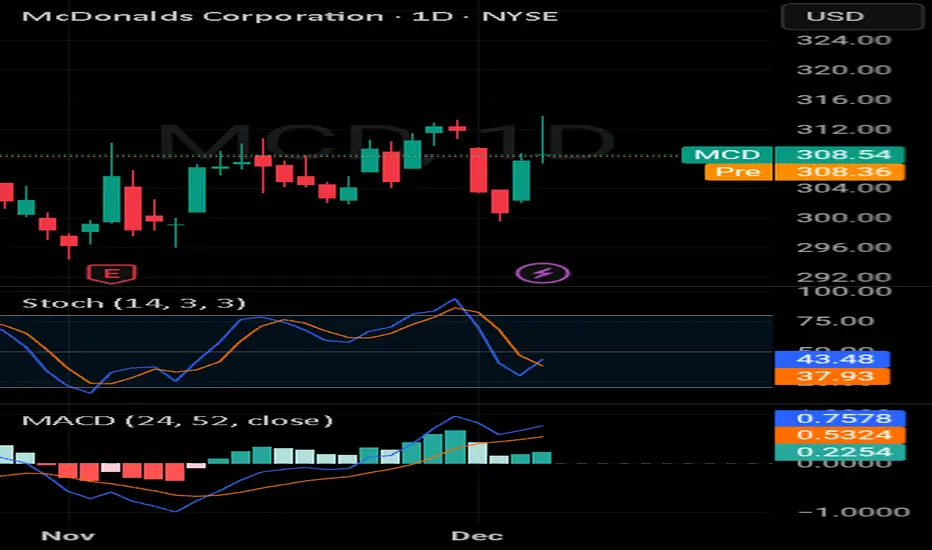
Marriott Pulls Back Following RallyMarriott rallied last month and now it’s pulled back.
The first pattern on today’s chart is the surge to a new record high above $300. The move followed better-than-expected earnings and revenue on November 4, which may reflect improved fundamentals in the hotel stock.
Second is July’s peak of $283.75. MAR bounced at that level in mid-November and may be trying to hold it again this week. Has old resistance become new support?
Third, MAR made a higher high on Wednesday and a lower low compared with the previous session. That bullish outside day could suggest its recent slide is ending.
Fourth, stochastics have dipped toward oversold territory.
Finally, the 50-day simple moving average (SMA) had a “golden cross” above the 200-day SMA in July. It’s stayed there since and is now expanding away from the slower SMA. That may potentially represent the start of a longer-term uptrend.
TradeStation has, for decades, advanced the trading industry, providing access to stocks, options and futures. If you're born to trade, we could be for you. See our Overview for more.
Past performance, whether actual or indicated by historical tests of strategies, is no guarantee of future performance or success. There is a possibility that you may sustain a loss equal to or greater than your entire investment regardless of which asset class you trade (equities, options or futures); therefore, you should not invest or risk money that you cannot afford to lose. Online trading is not suitable for all investors. View the document titled Characteristics and Risks of Standardized Options at www.TradeStation.com . Before trading any asset class, customers must read the relevant risk disclosure statements on www.TradeStation.com . System access and trade placement and execution may be delayed or fail due to market volatility and volume, quote delays, system and software errors, Internet traffic, outages and other factors.
Securities and futures trading is offered to self-directed customers by TradeStation Securities, Inc., a broker-dealer registered with the Securities and Exchange Commission and a futures commission merchant licensed with the Commodity Futures Trading Commission). TradeStation Securities is a member of the Financial Industry Regulatory Authority, the National Futures Association, and a number of exchanges.
TradeStation Securities, Inc. and TradeStation Technologies, Inc. are each wholly owned subsidiaries of TradeStation Group, Inc., both operating, and providing products and services, under the TradeStation brand and trademark. When applying for, or purchasing, accounts, subscriptions, products and services, it is important that you know which company you will be dealing with. Visit www.TradeStation.com for further important information explaining what this means.

Stripe Latest Move Signals a New Phase in Its Crypto AmbitionsStripe continues to push deeper into digital assets as the company acquires the Valora team, marking a decisive step in its broader global vision. This move gives Stripe stronger technical muscle and sharper product experience as it builds out services connected to blockchain payments. The self-custody Valora wallet will still operate under cLabs, but the talent behind it now strengthens Stripe’s growing crypto direction. This shift reflects Stripe’s steady push toward a stronger and more versatile it crypto expansion strategy.
Crypto adoption grows rapidly across global markets, and Stripe wants a larger share of this evolving space. The company sees new opportunities across borderless payments, stablecoin settlements, and wallet-based commerce. The addition of the Valora team brings product intuition and deep mobile wallet expertise that aligns with Stripe’s long-term roadmap. Brands, creators, and users want faster and cheaper payment options, and Stripe plans to meet this demand through smart innovation and a focused crypto payment strategy.
With digital asset-based transactions increasing worldwide, Stripe positions itself for the next phase of financial technology. Developers demand more tools, consumers expect frictionless experiences, and businesses want secure global payment rails. Stripe responds to these expectations by strengthening its technical base and integrating teams that deeply understand crypto usability. The Valora acquisition gives it an edge as it builds a resilient and modern payment ecosystem built for global scale.
How the Valora Team Strengthens Crypto Ambitions
Stripe gains a talented team with strong expertise in mobile-first crypto experiences. Valora builds user-friendly tools that make blockchain payments simple and intuitive. This fits directly into it stated goal to make cryptocurrencies useful in daily transactions. The Valora acquisition also offers it valuable experience in scaling consumer-facing digital asset products.
The team adds years of technical understanding that supports Stripe crypto expansion plans. It wants to create seamless systems that handle stablecoin payments, cross-border flows, and merchant integrations. Valora’s experience helps Stripe design better products that reduce friction for users and businesses. These improvements support the company’s broader crypto payment strategy that reaches global merchants and fintech developers.
Why Stripe Keeps Expanding Its Presence in Crypto
Stripe sees rising global demand for fast and low-cost payment systems. Stablecoins and blockchain networks allow near-instant settlement without traditional friction. Stripe wants to support businesses that serve cross-border markets, and crypto offers an efficient solution. Developers also want easy tools that integrate modern payment features with minimal complexity.
Stripe’s cryptocurrency expansion plans are more about providing value than excitement. By using digital currencies, Stripe strives to establish a way of paying with stablecoins; create ways to convert into and back out from cryptocurrency; introduce tools for businesses to easily enter into/leave from the world of digital finance; and create better methods for individuals and businesses to gain access to all these different types of financial instruments.
The latest piece of this strategy builds off of the company’s re-establishment of cryptocurrency Payment Services into Stripe earlier this year. Stripe’s vision is to enable merchants around the world to connect to their customers through simple, reliable blockchain-based payment workflows.
Stripe’s Long-Term Vision for a Smarter Crypto Future
Stripe aims to shape the future of cross-border payments with a modern approach. The company believes that digital assets offer practical solutions to long-standing financial hurdles. The crypto expansion strategy blends deep engineering talent with a focus on real-world utility. The Valora acquisition strengthens this mission and prepares it for the next stage of global payment innovation.
Stripe plans to support stablecoin growth, simplify global payouts, and power new economic connections. The company now holds stronger expertise to design modern tools for millions of users and businesses. This shift signals a new era for Stripe and a more connected financial ecosystem.

3 Reasons Oil Prices Are Falling — The Rocket Booster Strategy The Rocket Booster Strategy Explained
🔥 The Rocket Booster Strategy:
Why Oil Prices Are Falling Right Now
==
In the current market environment,
Oil has entered a powerful bearish phase,
and the chart is telling the whole
story. One of the simplest yet most
effective technical confirmations is
what I call
The Rocket Booster Strategy — a momentum
-based system built
around the 50 EMA and 200 EMA.
🚀 What Is the Rocket Booster Strategy?
Think of the 50 EMA and 200 EMA
as “boosters” that guide trend
direction and strength.
When price is above both EMAs,
the trend has bullish thrust.
When price is below both, the boosters
point downward, signaling
strong downside momentum.
Right now, Oil is experiencing exactly that.
📉 Why Oil Is Falling
1. Price Has Broken Below the 50 EMA
The 50 EMA is the first momentum filter.
When price closes below it, short-term
strength weakens and buyers lose control.
2. Price Is Also Below the 200 EMA
This is the bigger confirmation.
The 200 EMA represents long-term trend direction.
Once price sits below it together
with the 50 EMA, the market enters a
“gravity zone,” where selling pressure accelerates.
3. EMAs Are Widely Spread
The distance between the two EMAs
is expanding — a sign that the bearish
momentum is not just a pullback
but a trend continuation.
This is a classic rocket-booster
alignment but pointed downward.
🧭 What This Means for Traders
The Rocket Booster Strategy tells
you one thing:
➡️ The path of least resistance for
Oil right now is DOWN.
This setup is often used by
trend followers to:
Take short positions on pullbacks
to the 50 EMA
Ride momentum moves as long
as price stays below both EMAs
Target previous swing lows or
major demand zones
It’s not about predicting — it’s about
trading with the flow.
⚠️ Risk Notes
No strategy is perfect.
Always watch for:
Fakeouts above the 50 EMA
Sudden news-driven spikes
Oversold conditions on
higher timeframes
Key support levels that
may attract buyers
📌 Final Thoughts
The Rocket Booster Strategy is powerful
because it keeps trading simple.
When the 50 EMA and 200 EMA are
stacked above price, the boosters
are firing downward.
Oil is currently in this
formation, meaning
sellers still control the market.
Until price climbs back above the
EMAs with strong candles, rallies
may simply be
opportunities to sell into
strength.
Rocket boost this content to learn more.
Disclaimer: Trading is risky please learn risk
management and profit
taking strategies
also feel free to use a simulation
trading account before
you trade with real money

Te 2 Biggest Problems When Buying Stock Options My body is in pain.
Because I have been exercising.
Also I did yard work.
Determining the whether is not easy.
Just when you think it's raining.
It doesn't rain.
When you think it won't rain.
Then it rains.
Look at this chart.
The stochastic has crossed.
The %k above the %d
Below the 50 level.
The MACD Histogram is green.
This green is on the weekly time.
Finally the 4h entry.
The sentiment analysis is green.
This shows you that buying pressure.
The pressure is building.
This gives you a good support.
You will need support.
This support will help your broker.
How?
You see the problems are these:
⚠️ Buying on a breakout
⚠️ Brokers poor execution during a breakout.
This is what you are avoiding.
When you enter on 4hour time frame sentiment.
Will you ever be right when predicting the weather?
Will you ever be right when predicting the market sentiment analysis?
These are some questions to 🤔 about.
Rocket boost 🚀 this content to learn more.
Disclaimer ⚠️ Trading is risky please learn about risk management and profit taking strategies.
Also feel free to use a simulation trading account before you use real money.
The #1 Indicator For Stop LossesOne time I had to defend myself
because a person I thought was my friend
approached when he was drunk.
I recently just had eye surgery so
I told him about it..
for some odd reason, he thought
he could take advantage of me.
I then defended myself.
He tried again when he was drunk
I then walked away from him
But I give him a "middle finger"
in words..
He retaliated and came back with a gang
and with
insults.
I didn't hear him because
I was on the phone talking to a girl
that I dig...lol!
Today I saw him a distance
and I recognised his walk.
Then he saw me and walked away instantly
Keep in mind this was at a distance.
while he was sober..
He didn't want that smoke.
He knew once he get that smoke
with me.He's gonna shiver in
his little baby boy pants.
The point am trying to make to you
is that it takes time to master something
and as we journey
together on this trading.
I need you to be patient
and learn not only
from my mistakes
but also from yours
am now the O.G I used to look up
to.
On this chart, I have used the
parabolic
to set my stop loss and buy stop
order
And so far I think its a good trade.
A good Buy trade
plus, sentiment is very strong.
its perfect- I think
it will turn out well.
Trade safely out there.
Rocket boost this content to learn more
Disclaimer: Trading is risky. Please use risk management
and profit taking
strategies
Also feel free to use a simulation trading account
before you trade with real money.

XAUUSD | Gold Signal |Dec 3,2025📌 MARKET ASSESSMENT
Gold in yesterday’s session continued to face selling pressure, correcting down to the 4160 zone before bouncing back strongly with a range of roughly 500 pips. Currently, the market is opening above the 4205 level, in a context where gold seems to be widening its volatility range despite previously breaking the short-term uptrend.
However, overall, this may simply be a compression phase of the market.
For today’s session, gold is expected to fluctuate within the 4150–4220 range. Personally, I still prioritize a long-term bullish bias, so I recommend a buy limit around the 4150 zone.
The target is a move back to 4250 or even higher in the near future.

XAUUSD | Gold Signal |Dec 2,2025BUY TREND TARGET FOR TODAY 📊
The market is pricing in a near-certain rate cut in December. Dovish comments from Fed officials from Waller to Williams, coupled with weak manufacturing data, reinforce the argument that growth risks are rising faster than inflation risks. Gold reacted sensitively to this backdrop, with the dollar falling to a two-week low before recovering slightly. I believe the gold-silver market is entering a period of high volatility, but the bullish structure remains intact.
Rate cut expectations, a weaker dollar, and weak economic data continue to be the three main pillars supporting prices. However, rising bond yields and uncertainty over Fed leadership mean the rally could be interrupted in the short term. Powell’s speech this week will play a guiding role, especially on Q1 2026 interest rate expectations.1
Strategically, investors should keep a close eye on employment, PCE, and bond developments. In an environment where the monetary policy cycle is pivoting, gold plays the role of portfolio insurance, while silver continues to be the asset that responds most strongly to market sentiment and macro expectations, with higher returns but also greater risk.1% The main trend of gold remains bullish in structure.
♾️Gold BUY @ 4215- 4220
💰TP1 - 4225
💰TP1 - 4230
🚨Sl: 4210

Estimated Bullish Probability: 80%
Weekly: Hammer+ → Light Green (strong weekly bullish hammer)
Daily: Hammer → Light Green (bullish daily hammer)
4H: Rising Three Soldiers+ → Light Red (bullish candlestick pattern, but 4H MACD is a short-term pullback)
Step 1 — base MACD color probability
Row Weekly Light Green / Daily Light Green / 4H Light Red → Low–Moderate (55–65%).
Use the midpoint for calculation:
Base MACD probability = 60%.
(Arithmetic check: 55 + 65 = 120; midpoint = 120 ÷ 2 = 60.)
Step 2 — adjust for candlestick patterns (how strong each pattern is on its timeframe)
Weekly Hammer+ (strong weekly bullish hammer) → +10% (weekly patterns carry heavy weight).
Daily Hammer (daily bullish hammer) → +8% (meaningful daily confirmation).
4H Rising Three Soldiers but MACD = Light Red → the candle is bullish, but the MACD color is a short-term pullback, so we give a small +2% (pattern helps, but momentum mismatch reduces its effect).
Step 3 — digit-by-digit arithmetic (exact)
Start with base: 60
Add Weekly hammer+: 60 + 10 = 70
Add Daily hammer: 70 + 8 = 78
Add 4H rising three soldiers (small bump): 78 + 2 = 80
Final result = 80%
Final answer
➡️ Estimated Bullish Probability: 80%
Quick interpretation / trade guidance
Weekly + Daily both show bullish hammers → strong higher-timeframe bias is up.
4H shows a bullish candle pattern (Rising Three Soldiers) but MACD is Light Red — that indicates a short-term pullback or consolidation. The candlestick pattern reduces the risk of immediate reversal but the MACD color suggests waiting for a 4H flip to green for the cleanest entry.
Practical entries: scale in on strength, or wait for 4H Light Red → Light Green flip (or a strong bullish 4H close). Use a stop below the 4H structure; consider a larger position if 4H confirms.
Rocket boost this content to learn more.
Warning!! Trading is risky please use a simulation trading account before you trade with real money

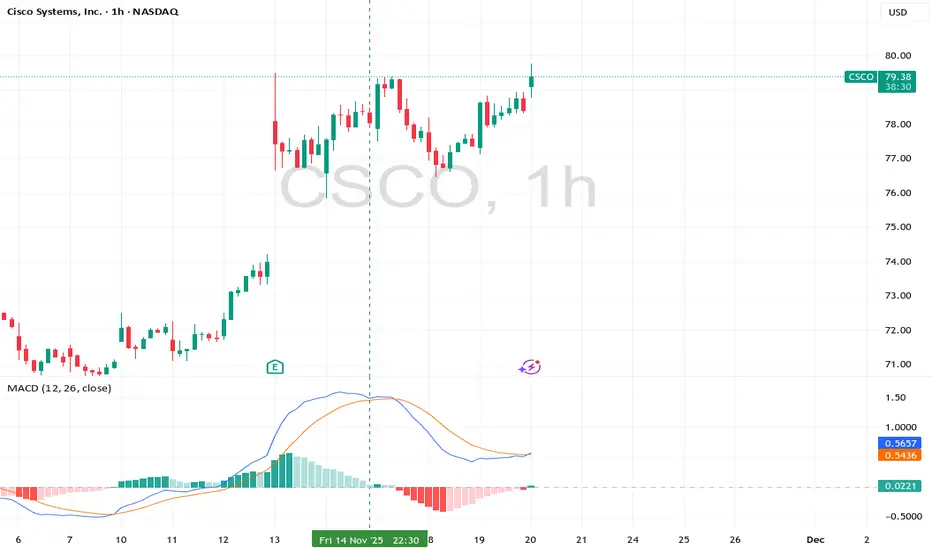
Stock Alert #2:CSCO-You only have about 20 mins to buy Right NowThis is another pullback entry
look at the MACD
i have been waiting for this entry for about 5 days.
Waiting for this entry
was not easy but here you
look at the chart the MACD on the 1h
Time frame is showing you that the entry
is nice and ripe for your trading.
Is there a reason why Thursday seems
to be a good day to trade?
Am not sure either way.
You only have about 20 mins to enter this trade
before its gone so hurry up
Below is the trading analysis i took about 5 days ago
before this pullback
read this below.
Step 1 — Interpret MACD Colors Only (Bullish Table)
Given:
• Daily: Dark Green 🟢 + Rising 3 Soldiers
• 4H: Dark Green 🟢 + Rising 3 Soldiers
• 1H: Light Green 🟢 + Inverted Hammer
From the Bullish MACD Table:
Daily
4H
1H
Interpretation
Probability
🟢 Dark Green
🟢 Dark Green
🟢 Light Green
Strong higher trend, brief 1H pause, 4H resumes uptrend
🟠 80-90%
MACD-only base probability: 80-90% (High)
Step 2 — Add Candlestick Patterns
Given Patterns:
• Daily: Rising 3 Soldiers + Dark Green MACD
• 4H: Rising 3 Soldiers + Dark Green MACD
• 1H: Inverted Hammer + Light Green MACD
From Bullish Candlestick Table:
Daily - Rising 3 Soldiers + Dark Green:
Three White Soldiers + 🟢 Daily + 🟢 4H + 🟢 1H → 95% base → 99% final
4H - Rising 3 Soldiers + Dark Green:
Same as above → 99% final
1H - Inverted Hammer + Light Green:
Inverted Hammer + 🟢 1H + 🟢 4H → 85% base → 89% final
Step 3 — Combine for Final Probability
This is an exceptionally powerful bullish setup:
Strengths:
• Strong MACD alignment: Daily & 4H Dark Green (maximum momentum), 1H Light Green (bullish)
• Two powerful bullish patterns: Rising 3 Soldiers on both Daily & 4H
(maximum confirmation)
• 1H shows early bullish signal: Inverted Hammer with Light Green MACD
• Perfect higher timeframe confluence
Final Probability:
🔥 95-98% (Very High)
Trade Insight:
This represents an extremely high-probability bullish continuation setup because:
• Daily & 4H show maximum bullish momentum with Rising 3 Soldiers (strongest pattern)
• 1H shows early bullish reversal signal (Inverted Hammer) with confirming Light Green MACD
• Perfect alignment of the strongest bullish pattern across two key timeframes
• All timeframes aligned bullish with powerful pattern confirmation
Action:
Ideal long entry - excellent for:
• Entering on break above 4H Rising 3 Soldiers high
• Using any 1H pullback as additional entry opportunity
• Placing stops below Daily Rising 3 Soldiers low
• Expecting strong upward momentum continuation
This is one of the strongest possible bullish setups with multiple high-probability confirmations across timeframes. The dual Rising 3 Soldiers pattern is exceptionally powerful.
Rocket boost this content to learn more.
Warning!! Trading is risky please use a simulation trading account before you
trade with real money
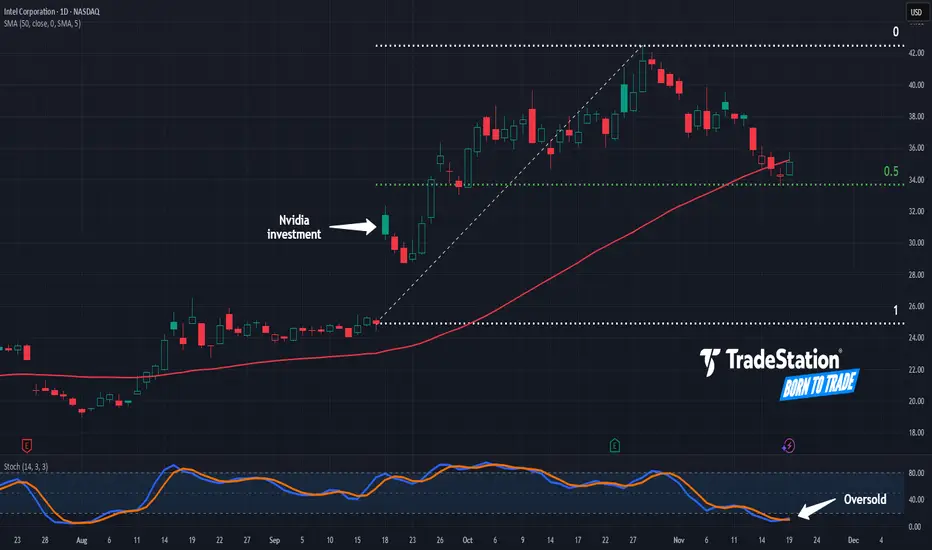
Intel Rallied and Now It’s Pulled BackIntel had a dramatic rally in recent months, and now it has pulled back.
The first pattern on today’s chart is the gap on September 18 after the chipmaker received an investment from Nvidia. INTC pulled back to hold a 50 percent retracement of that move, which may confirm its upward direction remains intact.
Second, prices are near the rising 50-day simple moving average. That may be consistent with a bullish intermediate-term trend.
Next, stochastics have dipped to an oversold condition.
Finally, INTC is an active underlier in the options market. That may help traders take positions with calls and puts.
TradeStation has, for decades, advanced the trading industry, providing access to stocks, options and futures. If you're born to trade, we could be for you. See our Overview for more.
Past performance, whether actual or indicated by historical tests of strategies, is no guarantee of future performance or success. There is a possibility that you may sustain a loss equal to or greater than your entire investment regardless of which asset class you trade (equities, options or futures); therefore, you should not invest or risk money that you cannot afford to lose. Online trading is not suitable for all investors. View the document titled Characteristics and Risks of Standardized Options at www.TradeStation.com . Before trading any asset class, customers must read the relevant risk disclosure statements on www.TradeStation.com . System access and trade placement and execution may be delayed or fail due to market volatility and volume, quote delays, system and software errors, Internet traffic, outages and other factors.
Securities and futures trading is offered to self-directed customers by TradeStation Securities, Inc., a broker-dealer registered with the Securities and Exchange Commission and a futures commission merchant licensed with the Commodity Futures Trading Commission). TradeStation Securities is a member of the Financial Industry Regulatory Authority, the National Futures Association, and a number of exchanges.
Options trading is not suitable for all investors. Your TradeStation Securities’ account application to trade options will be considered and approved or disapproved based on all relevant factors, including your trading experience. See www.TradeStation.com . Visit www.TradeStation.com for full details on the costs and fees associated with options.
Margin trading involves risks, and it is important that you fully understand those risks before trading on margin. The Margin Disclosure Statement outlines many of those risks, including that you can lose more funds than you deposit in your margin account; your brokerage firm can force the sale of securities in your account; your brokerage firm can sell your securities without contacting you; and you are not entitled to an extension of time on a margin call. Review the Margin Disclosure Statement at www.TradeStation.com .
TradeStation Securities, Inc. and TradeStation Technologies, Inc. are each wholly owned subsidiaries of TradeStation Group, Inc., both operating, and providing products and services, under the TradeStation brand and trademark. When applying for, or purchasing, accounts, subscriptions, products and services, it is important that you know which company you will be dealing with. Visit www.TradeStation.com for further important information explaining what this means.
"Rising 3 Soldiers on 4H indicates sustained buying pressure"Notice where the horizontal line is appearing?
Its at the top of the price action strength.
This is called the bull trap.
But the good thing
about silver is that
even in a bull trap
It still help up strong against the short selling
pressure..
When i took it upon my self to
take on this analysis - it was a bold move
because honestly am not sure
if my trading analysis skills
are good enough
to trade silver.
right now we are in a state
of correction
But the analysis below
is about the time
it happened before the
correction entry
that you are seeing
right now.
This correction entry showed
"strong upward continuation as Daily momentum"
This continuation appeared as a morning star
candlestick pattern.
Read my analysis for silver
below.
Thanks.
Step 1 — Interpret MACD Colors Only (Bullish Table)
Given:
• Daily: Light Green 🟢
• 4H: Dark Green 🟢 + Rising 3 Soldiers
• 1H: Dark Green 🟢
From the Bullish MACD Table:
Daily
4H
1H
Interpretation
Probability
🟢 Light Green
🟢 Dark Green
🟢 Dark Green
Daily regaining strength, intraday momentum accelerating
🟠 75-85%
MACD-only base probability: 75-85% (High)
Step 2 — Add Candlestick Pattern
Given Pattern:
• 4H: Rising 3 Soldiers + Dark Green MACD
From Bullish Candlestick Table:
4H - Rising 3 Soldiers + Dark Green:
Three White Soldiers + 🟢 4H + 🟢 1H → 95% base → 99% final
The Rising 3 Soldiers pattern on the 4H timeframe with perfect Dark Green MACD alignment on both 4H and 1H significantly boosts the probability.
Step 3 — Combine for Final Probability
This is a very strong bullish setup:
Strengths:
• Strong MACD alignment: 4H & 1H Dark Green (maximum momentum), Daily Light Green (bullish momentum building)
• Powerful bullish pattern: Rising 3 Soldiers on 4H (one of the strongest patterns)
• Lower timeframes show maximum momentum (4H & 1H Dark Green)
• Excellent confluence across all timeframes
Final Probability:
🔥 90-95% (Very High)
Trade Insight:
This represents a high-probability bullish continuation setup because:
• 4H shows maximum bullish momentum with the strongest pattern (Rising 3 Soldiers)
• 1H confirms with maximum bullish momentum (Dark Green)
• Daily shows building bullish momentum (Light Green)
• Rising 3 Soldiers on 4H indicates sustained buying pressure
• Perfect setup for upward momentum acceleration
Action:
Excellent long entry - strong setup:
• Enter on break above 4H Rising 3 Soldiers high
• Add positions on any 1H pullback
• Place stops below the 4H Rising 3 Soldiers pattern low
• Expect strong upward continuation as Daily momentum builds toward Dark Green
This is a high-confidence bullish trade with strong pattern and momentum alignment, particularly on the lower timeframes where the Rising 3 Soldiers provides exceptional bullish conviction.
Rocket boost this content to learn more.
Disclaimer:Trading is risky
please use a simulation trading account before you trade with real money and learn risk management and profit taking strategies.

How To Catch The Pullback - Part 1Forex ticker: OANDA:EURJPY OANDA:USDJPY OANDA:AUDJPY OANDA:CADJPY
Step 1 — Interpret MACD Colors Only (Bullish Table)
Given:
• 1H: Light Green 🟢
• 4H: Light Green 🟢
• Daily: Dark Green 🟢 + Rising Three Soldiers
From the Bullish MACD Table:
Daily
4H
1H
Interpretation
Probability
🟢 Dark Green
🟢 Light Green
🟢 Light Green
Daily regaining strength, intraday momentum accelerating
🟠 75-85%
MACD-only base probability: 75-85% (High)
Step 2 — Add Candlestick Pattern
Given Pattern:
• Daily: Rising Three Soldiers + Dark Green MACD
From Bullish Candlestick Table:
Daily - Rising Three Soldiers + Dark Green:
Three White Soldiers + 🟢 Daily + 🟢 4H + 🟢 1H → 95% base → 99% final
Since your 4H and 1H are Light Green (not full Dark Green), the probability
adjusts slightly but remains very high due to the strength of the Rising Three Soldiers pattern.
Step 3 — Combine for Final Probability
This is a very strong bullish setup:
Strengths:
• Strong MACD alignment: Daily Dark Green (maximum momentum), 4H & 1H Light Green (bullish momentum building)
• Powerful bullish pattern: Rising Three Soldiers on Daily (strongest pattern in your system)
• Good confluence across all timeframes
• All timeframes aligned bullish
Final Probability:
🔥 90-95% (Very High)
Trade Insight:
This represents a high-probability bullish continuation setup because:
• Daily shows maximum bullish momentum with the strongest pattern (Rising Three Soldiers)
• 4H and 1H confirm with bullish momentum (Light Green)
• Rising Three Soldiers indicates sustained buying pressure across multiple
sessions
• Perfect setup for continued upward movement
Action:
Excellent long entry - strong setup:
• Enter on any pullback toward Daily Rising Three Soldiers support
• Add positions on break above recent highs
• Place stops below the Daily Rising Three Soldiers pattern low
• Expect strong upward continuation
This is a high-confidence bullish trade with the strongest pattern (Rising Three Soldiers) aligned with solid momentum across all timeframes. The Daily pattern
provides exceptional bullish conviction that overrides the slightly weaker momentum on lower timeframes.
Rocket Boost this content to learn more
Warning! : Trading is risky please learn risk management and profit
taking strategies
also use a simulation trading account
before you trade with real money

$QQQ Strong momentum down- Watch your assetsTake profit, enter Sell mode! All risk factors in my indicator I made are showing large amounts of risk in holding long positions. Sell!
Market structure has broken down

Rising 3 Soldiers + Rocket Booster Strategy Am at a low low point right now.
Am trying to launch a business
but the banker is giving me a difficult time
My marketing skills are on point and
i understand how to collect leads
with FREE Offers.
Also am ready to build and nature my leads,
or potential
customers because i love communicating with
people.
So instead
something in my spirit
told me to apply
for a potential position
in a fast food chain
restaurant industry
as a general worker
Just incase i will need some survival income
Being humble for me is something
i dont take lightly
its very important to be humble and
plan for your next exit
This is why i don't trade any setup until
i see a candlestick
formation on atleast one time frame
Because the candlestick formation give
me a stop loss level to expect
incase the trade doesn't
go my way..
This means the stop loss is telling me
"How much are you willing to lose?"
Remember to always have a mental stop loss
this is what i Iearnt
from Tim Sykes..
have a mental stop loss
I always ignore stop losses because
i dont like risk management
But you need to master seeing the stop loss
I use candlestick patterns to see the stop loss
because i am not good with numbers
when it comes to trading..
Remember to use a simulation trading
account to practise seeing your stop loss trades
My next goal is to use Fibonacci to
see where to take profit..
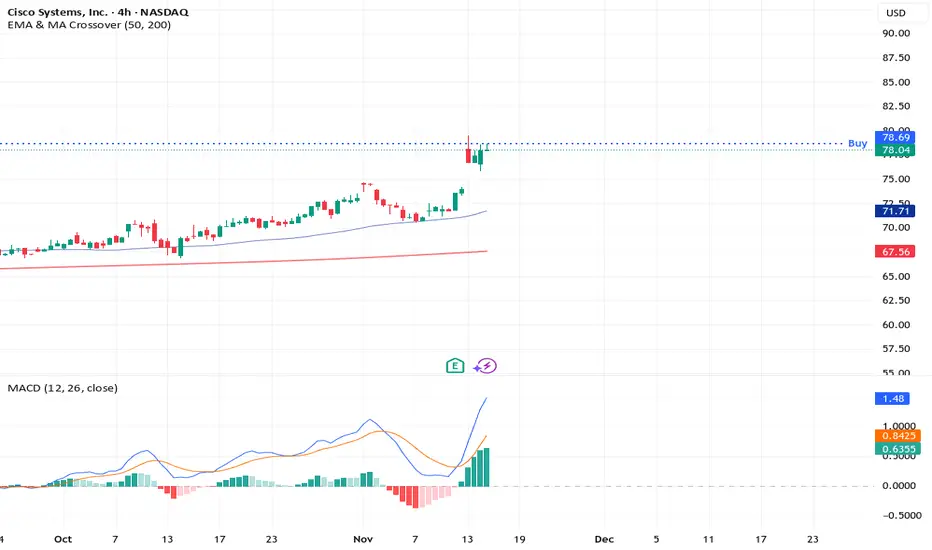
Below is the trade analysis for this stock: NASDAQ:CSCO
Read below
Enjoy!
Stock: NASDAQ:CSCO
Step 1 — Interpret MACD Colors Only (Bullish Table)
Given:
Daily: Dark Green 🟢 + Rising 3 Soldiers
4H: Dark Green 🟢 + Rising 3 Soldiers
1H: Light Green 🟢 + Inverted Hammer
From the Bullish MACD Table:
Daily 4H 1H Interpretation Probability
🟢 Dark Green 🟢 Dark Green 🟢 Light Green
Strong higher trend, brief 1H pause, 4H resumes uptrend 🟠 80-90%
MACD-only base probability: 80-90% (High)
Step 2 — Add Candlestick Patterns
Given Patterns:
Daily: Rising 3 Soldiers + Dark Green MACD
4H: Rising 3 Soldiers + Dark Green MACD
1H: Inverted Hammer + Light Green MACD
From Bullish Candlestick Table:
Daily - Rising 3 Soldiers + Dark Green:
Three White Soldiers + 🟢 Daily + 🟢 4H + 🟢 1H → 95% base → 99% final
4H - Rising 3 Soldiers + Dark Green:
Same as above → 99% final
1H - Inverted Hammer + Light Green:
Inverted Hammer + 🟢 1H + 🟢 4H → 85% base → 89% final
Step 3 — Combine for Final Probability
This is an exceptionally powerful bullish setup:
Strengths:
Strong MACD alignment: Daily & 4H Dark
Green (maximum momentum), 1H Light Green (bullish)
Two powerful bullish patterns: Rising
3 Soldiers on both Daily & 4H (maximum confirmation)
1H shows early bullish signal: Inverted
Hammer with Light Green MACD
Perfect higher timeframe confluence
Final Probability:
🔥 95-98% (Very High)
Trade Insight:
This represents an extremely high-probability
bullish continuation setup because:
Daily & 4H show maximum bullish momentum with
Rising 3 Soldiers (strongest pattern)
1H shows early bullish reversal signal (Inverted Hammer)
with confirming Light Green MACD
Perfect alignment of the strongest bullish
pattern across two key timeframes
All timeframes aligned bullish with powerful
pattern confirmation
Action:
Ideal long entry - excellent for:
Entering on break above 4H Rising 3 Soldiers high
Using any 1H pullback as additional entry opportunity
Placing stops below Daily Rising 3 Soldiers low
Expecting strong upward momentum continuation
This is one of the strongest possible bullish setups
with multiple high-probability confirmations across
timeframes. The dual Rising 3 Soldiers pattern
is exceptionally powerful.
Rocket boost this content to learn more.
Disclaimer:Trading is risky please
use a simulation trading account before you
trade with real money
Earnings,MACD,And Candlesticks-Top 3 Catalysts That Give SignalsSo in this chart NYSE:DIS we are using
👉MACD
👉Earnings Report
👉Multi-time frame
👉Candlestick Analysis
What you need know:
-
Earnings are a catalyst to price gaps also MACD shows you buying momentum.
-
Also understand candlesticks give early signals.
-
The problem is the the light green MACD histogram on the 1H chart.
-
Also another challenge will be the broker executing the buy limit order.
-
If the broker doesn't execute your limit order don't try to. Hsse the position just let it go.
Because a buying opportunity is just around the corner.
If the price goes in the opposite direction, make you reserve 50% of your capital when you enter your
Trade .For example is you have $100 only trade $50.
This is part of risk management later when you gain experience you can increase your position size.
Am using Candlesticks, MACD, and MACD histogram.
This is my trading system.
Questions 🤔
👉What are multi time frame trading strategies?
👉What makes earnings report catalysts?
👉What is the MACD Histogram?
Leave your answers below..
Disclaimer ⚠️ Trading is risky please learn about risk management and profit taking strategies.
Also feel free to use a simulation trading account before you use real money.

Disbelief Rally Time?A lot of extreme bearish exuberance, but fundamentals continue to go up on the Ethereum network: lower gas fees, record transactions, record stable coin and real-world asset volume (digital treasuries, digital gold, etc). Recipe for a disbelief rally given extreme low sentiment.
Bullish catalysts:
- Fusaka upgrade go-live
- Tariff SCOTUS reversal odds
- Government reopening
- Clarity act progress
- New record network stats
- New dovish economic reports
