USDJPY BreakoutPrice has been consolidating since early August and has formed a clear 4-hour horizontal channel.
This week's news may cause a USDJPY breakout:
Tuesday, 16th September, US Retail Sales
Wednesday, 17th September, 🚨 FOMC, Fed Interest Rate Decision, Fed Press Conference 🚨
Friday, 19th September, Inflation for Japan, BOJ Interest Rate Decision
Fed

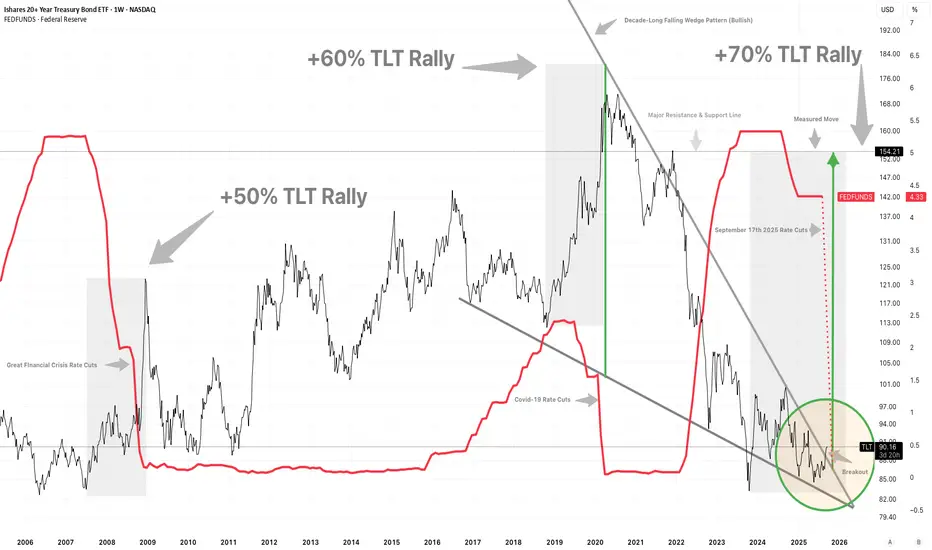
TLT TimeRate cuts start this Wednesday, September17th, 2025.
Polymarket odds are now strongly in favor of 3 rate cuts in 2025. CME Fedwatch probability is now at 70% for 3 cuts by December 10th.
Economic data, especially employment, has strongly confirmed the start of a full rate-cutting cycle beginning in 1.5 days.
Historically this set of circumstance has coincided with large or even historic bond rallies.
Will this time be different?
Will BoE's Plan to Rundown QT Impact Cable (GBP/USD)Direct Impact: The QT slowdown itself is a small, modestly GBP-positive factor. It may provide a slight underpinning of support.
If the BoE delivers the QT slowdown as expected and it's framed as a technical move, its impact will likely be overshadowed by the simultaneous interest rate decisions and guidance from both the BoE and the Fed.
If you are looking to trade this, don't trade the QT headline in isolation. Trade the broader package of BoE communication and the Fed's decision. A "hawkish hold" from the BoE (holding rates but signaling they stay high for longer) combined with a "dovish" Fed could send GBP/USD meaningfully higher. The QT slowdown would be a minor supporting actor in that drama. (Unless of course the FED holds rates)
In short: Expect a potential small, brief pop for GBP on the QT news, but the real moves will be dictated by the interest rate decisions and forward guidance from both sides of the Atlantic.
If BoE and FED hold, it could be a great asymmetric short end to the week!

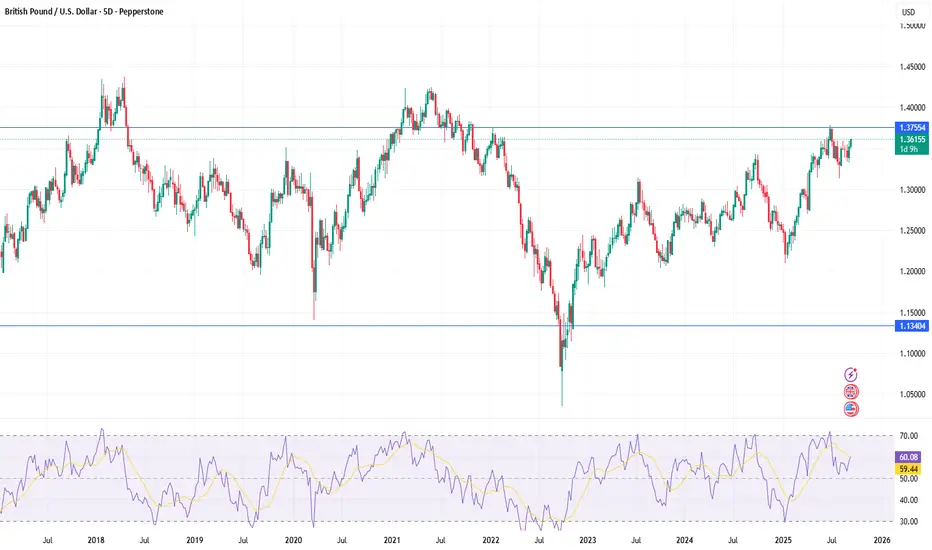
British pound hits two-month high, UK job dataThe British pound has started the new trading week in positive territory. In the European session, GBP/USD is trading at 1.3591, up 0.26% on the day. Earlier, the pound hit a daily high of 1.3620, its highest level since July 10.
The UK releases employment data on Tuesday. Claimant counts is expected to jump to 20.3 thousand in August, after a rare decline in July which saw claimant counts decline by 6.2 thousand. The unemployment rate is expected to remain at 4.7% for a third straight time, its highest level in four years.
Wage growth including bonuses is expected to rise to 4.7%, up from 4.6% in the previous release, which was the lowest pace in nine months.
It's a busy week in the UK, with the inflation report on Wednesday and the Bank of England rate decision on Thursday. The BoE is expected to maintain rates at 4.0% after last month's narrow 5-4 decision to lower rates. Governor Bailey has said rates would move "downwards gradually over time" but hasn't provided any details as to the timing or extent of cuts.
The UK may have already entered stagflation, which is a toxic mix of persistently high inflation, weak growth and rising unemployment. This presents a major headache for the BoE, as weak growth supports a rate cut while high inflation could get worse if the BoE reduces rates.
The central bank is hesitant to lower rates with inflation close to 4%, but may have to cut before the end of the year if the labor market continues to deteriorate. Tuesday's job report is unlikely to change minds at the BoE, which is expected to hold rates. Still, it could be a factor in the November rate decision.
GBPUSD has pushed above resistance at 1.3564 and is testing 1.3589 Above, there is resistance at 1.3605
There is support at 1.3548

HARD SHORTMy former analysis successfully landed to target zone. And now market wants a pull back.
1-Above there is low liqudation
2-Next week we will probably see a rate cut. thats why I am a little nervous abot open short
3-Till that day I think whales will chase cheap asset that is where my courage come from
4-Market wants to see a pull back
be careful about short you may just want to open long at the below
Always manage your own risks this is not a investment advise I am not responsible neither your loss nor profit.

GBP/USD Weekly Outlook: Bulls Push Through as Range Expands
Traders need to be careful this coming week. Now that this message has been delivered, speculators need to understand the GBP/USD will produce dynamic results.
The U.S Federal Reserve is set to deliver their FOMC Statement and announce their Federal Funds Rate this coming Wednesday.
The U.S central bank will cut interest rates this Wednesday. The GBP/USD has gone into this weekend having nudged higher compared to the start of last week.
But the question everyone wants answered is, what will the Fed’s message be? The 1.35575 mark was achieved going into this weekend and folks who believe the GBP/USD must move higher in the coming days based on the Fed’s upcoming interest rate cut cannot be blamed.
But this doesn’t mean they are correct. The Fed will likely cut their Federal Funds Rate by 25 basis points.
GBP/USD Weekly Outlook:
Speculative price range for GBP/USD is 1.35090 to 1.37500
This will be a dynamic week in Forex. The GBP/USD will not be immune to volatility. The currency pair will be fast and day traders need to practice supreme risk management so they are not burned by the speed of Forex. Having challenged highs last week around 1.35920 on Tuesday was good bullish action, but the selling that ensued afterwards is a warning sign that caution remains a fixture in financial institutions.
As a note the GBP/USD did attain the 1.37900 vicinity on the 1st of July. Bullish traders may be dreaming of this higher values, but day traders with limited funds should be willing to cash out of big moves if profits are produced. The Federal Reserve hold the cards in the Forex market this week, the GBP/USD will react to the FOMC Policy Statement and everyone should be braced for fast conditions.
Will steady Fed cut expectations fuel gold’s rise?
Persistent Fed rate cut expectations and lingering geopolitical risks are sustaining demand for safe-haven assets. Initial jobless claims rose to 260k last week, the highest in four years, while August CPI showed little sign of tariff-driven inflation.
With labor market weakness reaffirmed and tariff-related price pressures proving milder than feared, Fed cut expectations remain elevated. Morgan Stanley revised its outlook, now projecting four consecutive cuts from this month through the January FOMC.
XAUUSD is holding near the 3650 high, maintaining its uptrend. The widening gap between both EMAs indicates the potential continuation of bullish momentum. If XAUUSD breaks above the 3650 resistance, the price could rise further toward 3700. Conversely, if XAUUSD breaks below the 3580 support, the price may retreat toward 3500.

Bitcoin - Will Bitcoin break out of range?!Bitcoin is above EMA50 and EMA200 on the four-hour timeframe and is in its ascending channel. If the downward trend continues towards the specified demand range, we can buy Bitcoin with appropriate risk-reward.
Bitcoin’s rise to around 121,000 and its arrival at the specified supply range will provide us with its next selling position. It should be noted that there is a possibility of heavy fluctuations and shadows due to the movement of whales in the market and capital management in the cryptocurrency market will be more important. If the downward trend continues, we can buy within the demand range.
Bitcoin continues to fluctuate within the $110,000 to $117,000 range, as reduced capital inflows into ETFs combined with intensified profit-taking exert mounting pressure on its upward momentum. In this environment, the derivatives market—driven by the strong presence of futures and options contracts—plays a central role in balancing and shaping market direction. Profit-taking by 3–6 month holders, alongside losses realized by recent buyers at price peaks, has fueled selling pressure across the market.
On-chain liquidity still maintains a constructive structure, but signs of gradual weakening are evident. Meanwhile, net ETF inflows and outflows have declined to around 500 BTC per day, significantly undermining demand from traditional finance (TradFi), which had previously been a key driver of rallies in March and December 2024.
Following the mid-August all-time high, market momentum steadily weakened, dragging Bitcoin below the cost basis of recent buyers at the top and pushing the asset back into a range-bound structure. The critical question now is whether this reflects a healthy consolidation phase or the beginning of a deeper corrective cycle.
While dip-buyers provided some support, the primary selling pressure originated from experienced short-term holders. Data shows that 3–6 month holders have been realizing approximately $189 million in daily profits (based on the 14-day moving average), accounting for nearly 79% of total short-term holder realized gains. These figures indicate that many investors who entered the market during the February-to-May correction used the recent rally as an opportunity to lock in profits—creating considerable resistance against upward continuation.
In addition to profit-taking from seasoned short-term holders, recent peak buyers also capitulated by realizing losses during the pullback, further amplifying selling pressure. Alongside on-chain dynamics, assessing external demand through ETFs remains crucial, as these instruments have been pivotal in driving the current market cycle.
Since early August, net inflows into U.S. spot ETFs have sharply declined, currently averaging around 500 BTC per day (14-day moving average). This is far below the levels of capital inflows that had previously supported the bullish phase of the cycle, reflecting weakening momentum from TradFi investors. Given the central role of ETFs in fueling Bitcoin’s recent uptrend, the slowdown in flows makes the market’s current structure noticeably more fragile.
Meanwhile, blockchain-based prediction platform Polymarket has announced a new collaboration with Chainlink. The partnership aims to launch 15-minute crypto prediction markets featuring rapid settlement and industry-leading security standards.
The integration of Chainlink’s oracle technology with Polymarket’s trading infrastructure is expected to enhance user access to accurate and reliable data, delivering a new experience in short-term prediction markets. This collaboration could mark a turning point in the development of innovative trading instruments and price forecasting tools.

NAS100 - Stock market awaits Federal Reserve meeting!The indicator is above the EMA200 and EMA50 on the one-hour timeframe and is in its long-term ascending channel. If the drawn upward trajectory is maintained, I can expect the future to continue as it has in the past. In case of a valid breakdown, its downward path is to the specified range, which can be approached with a reward for buying.
Last week’s economic data painted a mixed picture of the U.S. economy. On the one hand, new jobless claims rose to 263,000, above the market forecast of 235,000, signaling labor market weakness. On the other hand, the August inflation report came in hotter than expected, though most of the increase stemmed from housing costs rather than tariff pressures. Rents rose 0.34%, marking the fastest gain since December 2024, while shelter costs climbed 0.39%, the sharpest jump since January 2025. Still, real-time housing indicators suggest that prices are adjusting, which will likely be reflected in official data in the coming months.
Meanwhile, the yield on the U.S. 10-year Treasury fell below 4% for the first time since April—a sign that markets are reacting more to labor market weakness and the prospect of Fed rate cuts than to inflation concerns.
CIBC, analyzing the August Consumer Price Index (CPI) report, stated that while the data came in slightly above expectations, it was not strong enough to dissuade the Federal Open Market Committee (FOMC) from delivering a 25-basis-point cut next week. Ali Jafari, an economist at the bank, wrote: “There was little in the report to prevent a September rate cut. More importantly, the labor market needs support, and a weaker jobs market implies softer demand-side inflationary pressures ahead.”
On a yearly basis, core inflation held steady at 3.1%, while headline inflation rose two-tenths to 2.9%, both in line with forecasts. More troubling, however, are signs that price increases are spreading into new sectors. The report noted: “Tariff pass-through effects intensified this month, with core goods prices rising at the fastest pace since broad tariffs were imposed. Today’s report also showed the first notable increase in new car prices, suggesting that tariff impacts may now be extending to higher-ticket items, though overall car price gains remain modest.”
CIBC expects the Fed to cut rates in September and October, pause afterward, and then deliver two additional cuts in the first half of next year. The bank added: “The overall U.S. inflation picture remains notably above target, but the Fed is willing to tolerate this for now, given growing concerns about a weakening economy and a labor market showing signs of fatigue.”
Separately, U.S. President Donald Trump once again criticized the Fed in an interview with Fox News, saying the central bank “always acts late on interest rates.” He added: “We have the best stock market in history. Inflation has come down, equities are climbing, so rates should be lower.”
These comments come as the Fed is widely expected to cut rates at Wednesday’s meeting. While such a move could reduce borrowing costs in the short term, analysts caution that lower short-term rates do not necessarily translate into lower long-term yields.
Morgan Stanley now projects that the Fed will cut rates by 25 basis points at each of the three remaining meetings this year—an upgrade from earlier forecasts of only September and December cuts. The bank also expects three additional 25-basis-point cuts in January, April, and July of 2026.
At the same time, Standard Chartered has revised its outlook and now anticipates a 50-basis-point cut in September—double its previous forecast. The shift followed weak August jobs data showing employment growth had slowed sharply and unemployment rose to 4.3%, the highest since late 2020. The bank described labor market conditions as “dramatic,” noting that in just six weeks the market shifted from “strong” to “weak.” It characterized the larger cut as a form of “catch-up” to align monetary policy with economic realities.
This week is set to be pivotal for global markets, with a series of central bank decisions and key economic releases. Monday will see the Empire State manufacturing index, followed by Tuesday’s August retail sales report. On Wednesday, housing starts and building permits will be released, along with the Bank of Canada’s rate decision. The highlight of the week, however, will be the Fed meeting and Jerome Powell’s press conference.
On Thursday, the Bank of England will announce its policy decision, followed by U.S. jobless claims and the Philadelphia Fed manufacturing survey. The busy week will conclude Friday with the Bank of Japan’s policy announcement.

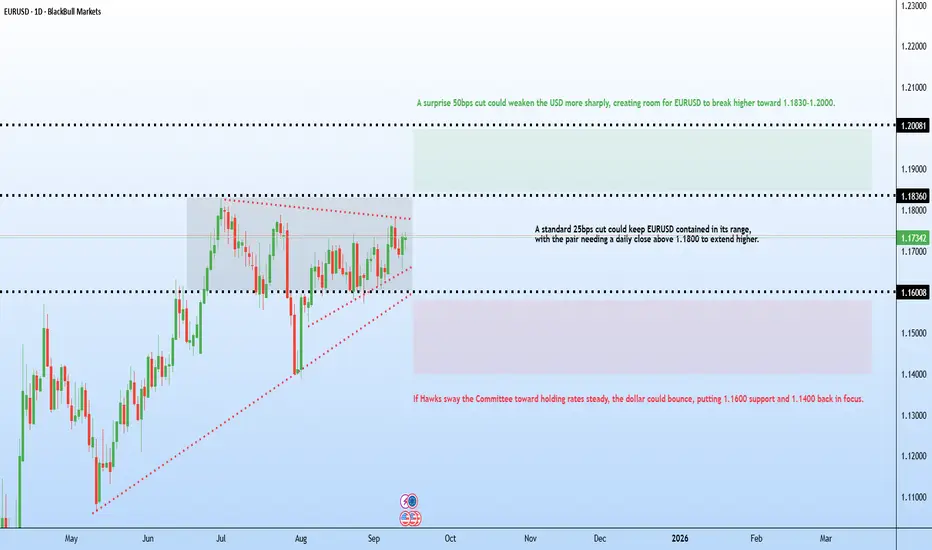
EURUSD ahead of the rate decisionThis week, the Fed will announce its interest rate decision. The news is scheduled for Wednesday at 7:00 PM UK time.
It’s a key event that will set the tone for the next market moves.
The main scenario remains a continuation of the uptrend, though further corrections are also possible.
Reduce your risk before the announcement and wait for the market’s reaction.

The countdown is on for the most anticipated Fed decision The Federal Reserve is widely expected to cut rates by 25bps to 4.00–4.25, with 105 of 107 economists surveyed by Reuters forecasting that outcome.
Still, the decision may not be unanimous. Some Committee members are not fully aligned on a September cut. Fed’s Goolsbee and Schmid could dissent in favour of leaving rates unchanged.
There is also a possibility of a larger move. If the U.S. Senate confirms Stephen Miran’s nomination to the Fed Board on Monday, he could be sworn in just in time for the meeting, and some speculate he may vote for a 50bps cut. Governors Bowman and Waller, who have previously dissented dovishly, may also support a larger reduction.
AUD/USD Ready for a Short Squeeze? COT Divergence Signals1. Retail Sentiment
73% of retail traders are short versus 27% long. Such an unbalanced positioning usually suggests short squeeze potential, as the market often moves against retail flows, especially when technical levels confirm the bias.
2. COT Report
USD Index: Non-Commercials remain skewed to the short side (+18.6k short vs. +13.6k long), with a slight reduction. This indicates the dollar is losing part of its net strength.
AUD Futures: Non-Commercials are heavily short (112k vs. 29k long), adding –16,930 new shorts. However, Commercials (hedgers) increased their longs (+11,908). Historically, commercials are more accurate at market turning points. This divergence may point to a bottom forming in AUD.
3. Seasonality (September)
September has historically been neutral to slightly negative for AUD/USD: flat performance over 20 years, and weaker over the last 5 years. However, mid-to-late September seasonality stabilizes, setting the stage for an October recovery. Bearish pressure may start fading, leaving room for upside.
4. Technical Outlook
Demand Zone: 0.6450–0.6500 has repeatedly rejected price, confirming strong support.
Supply Zone: 0.6650–0.6700, recently tested, represents the first upside target.
Structure: Price is printing higher lows and showing signs of a potential bullish structure shift. RSI is neutral, with no overbought signals.
Possible Scenario: A short pullback into 0.6520–0.6540 before accelerating toward 0.6680–0.6700.
5. Trading Summary
Bias: Moderately bullish in the short-to-medium term.
Key Drivers:
Extreme retail short positioning → potential squeeze.
COT divergence (specs heavily short, commercials long) → possible bottom.
Weak but improving seasonality.
Technical structure favoring upside continuation.
👉 Bottom line: AUD/USD favors long setups, but heavy Non-Commercial short exposure implies volatility could remain elevated.

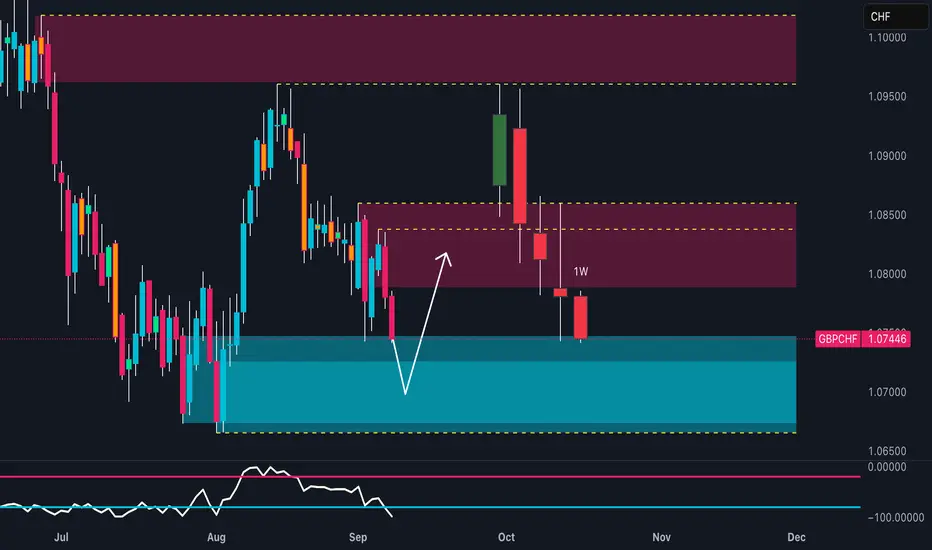
GBPCHF on the Edge: Why a Major Breakdown Could Be Next1. Retail Sentiment
90% of retail traders are long, only 10% are short.
Long volume is heavily skewed (536 lots vs 58 short).
➡️ This imbalance suggests a risk of further downside pressure (contrarian view), as markets often move against the retail crowd.
2. COT Report (Sept 2, 2025)
CHF: Non-commercials heavily short (34k vs 8k long). Commercials strongly long, hedging in favor of CHF strength.
➡️ Structural bullish bias for CHF.
GBP: Non-commercials net short (109k vs 76k long). Commercials significantly long (117k vs 85k short), hedging a weak pound.
➡️ Confirms bearish pressure on GBP.
Summary: Strong CHF – Weak GBP → Main direction: Short GBPCHF.
3. Seasonality (September)
CHF: Historically strong in September.
GBP: Historically weak in September.
➡️ Seasonality supports a short bias on GBPCHF.
4. Price Action
Strong rejection from weekly supply zone (1.0850–1.0900).
Bearish continuation candle below 1.0800 resistance.
Next support: 1.0700–1.0680 zone.
RSI trending lower with no divergence → bearish momentum intact.
5. Trading Plan
Bias: Short GBPCHF.
Key levels:
Resistance: 1.0800 / 1.0850 (ideal short re-entry).
Support: 1.0700 (first target), extension to 1.0650–1.0620 if bearish pressure continues.
Strategy: Wait for a pullback into 1.0800–1.0850 to short, stop above 1.0900. Targets: 1.0700 → 1.0650.
If price breaks straight below 1.0700, expect continuation towards 1.0620.
✅ Pro conclusion: All factors (COT, sentiment, seasonality, technicals) align in favor of CHF strength and GBP weakness. The best setup is a short re-entry near 1.0800–1.0850, targeting 1.0700 and 1.0650 with controlled risk above 1.0900.
USDCAD Breakdown Ahead? Seasonality & COT Divergence1. Retail Sentiment
59% short vs. 41% long: retail traders are moderately short on USD/CAD.
This leaves room for a potential upside squeeze, but positioning is not extreme, so the contrarian signal remains only partial.
2. COT Report
US Dollar (COT):
Large Speculators net short USD (–5,558 contracts).
Commercials net long USD (+6,642 contracts).
→ Speculators are unloading USD, pointing to structural weakness.
Canadian Dollar (COT):
Large Speculators net short CAD (–108,917 contracts).
Commercials net long CAD (+115,041 contracts).
→ A classic pattern: commercials are buying CAD while speculators remain heavily short. Historically, such extreme divergence often precedes CAD appreciation phases.
COT Summary:
USD: weakness from speculators.
CAD: commercials strongly long, speculators extremely short.
→ Clear divergence: potential CAD strength, bearish bias for USD/CAD.
3. Seasonality
September has historically been bearish for USD/CAD:
–0.37% over the last 20 years.
Also negative on 10- and 2-year averages, more mixed on 5 years.
The second half of the month tends to favor CAD strength.
4. Technical Outlook
Supply Zone: 1.3850–1.3900 (key resistance repeatedly tested and rejected).
Demand Zone: 1.3700–1.3720 (first short target), followed by 1.3600–1.3650.
Structure:
Strong rejection from the 1.3890 area.
Lower highs forming.
50–100–200 MAs in bearish confluence.
Daily rejection candle, confirming downside continuation potential.
5. Trading Plan
Bias: Bearish (short USD/CAD).
Setup:
Short on pullbacks to 1.3840–1.3860.
Target 1: 1.3720.
Target 2: 1.3650.
Invalidation: daily close above 1.3900.
Confluences:
✔ Retail moderately short → room for squeeze, but not extreme.
✔ COT: weak USD + strong CAD commercials → bullish CAD signal.
✔ Seasonality: September historically bearish for USD/CAD.
✔ Technicals: rejection at supply + bearish structure.

XAUUSD (Gold) Technical Projection📊 XAUUSD (Gold) Technical Forecast | Intraday & Swing Outlook ✨
Asset: XAUUSD (Gold CFD)
Closing Price: $3,643.41 📌 (11th Sept 2025, 12:54 AM UTC+4)
🔎 Multi-Lens Technical Analysis
📉 Chart Patterns & Theories
🕯️ Candlesticks: Strong rejection at $3,660 resistance; possible reversal signals.
🎯 Harmonic: Potential bearish Gartley forming near $3,670–$3,690 zone.
🌊 Elliott Wave: Wave 4 correction likely unfolding; upside capped unless $3,700 breaks.
🏦 Wyckoff: Market nearing distribution phase with weakening momentum.
📐 Gann Theory: Time/price cycle hints at key inflection around Sept 15–16.
☁️ Ichimoku: Price hovering near cloud top, testing bullish continuation zone.
🎭 Bull Trap Alert: Break above $3,670 could trigger false upside before reversal.
🧩 Head & Shoulders: Left shoulder visible; neckline around $3,600 support.
⚖️ Support/Resistance: Major support $3,600 | Resistance $3,670–$3,700.
📊 Indicators & Tools
📈 RSI (14): Neutral (52) → Room for either breakout or correction.
📊 Bollinger Bands: Squeeze forming; volatility expansion expected soon.
📉 VWAP / VWMA: Current price slightly above VWAP → intraday bullish bias.
📏 Moving Averages:
50 EMA → $3,625 (near-term support)
200 EMA → $3,540 (swing support)
Golden Cross intact → trend still bullish medium-term.
⏱️ Trading Time Frames
Intraday Strategy (5m–4H)
🎯 Buy Zone: $3,620–$3,630 (if tested with bullish confirmation).
🚀 Upside Target: $3,660–$3,670; Breakout extension → $3,690.
🛑 Stop Loss: Below $3,610 (tight risk management).
⚠️ If $3,670–$3,690 rejects → look for sell setup back to $3,600.
Swing Strategy (4H–Monthly)
📍 Buy Range: $3,580–$3,600 for swing accumulation.
🎯 Swing Targets: $3,700 → $3,740 → $3,800 (extension possible).
🛑 Swing Stop: Below $3,550 closes.
⚠️ Bearish swing trigger if $3,600 breaks → downside $3,540 then $3,500.
🌍 Market Context
📰 Fed rate expectations & USD strength remain key drivers.
⚔️ Geopolitical risks (Middle East + Asia tensions) could fuel safe-haven demand.
💹 Rising equity volatility may enhance Gold bids short-term.
📌 Summary
✅ Bullish Bias: Above $3,600 support.
❌ Bearish Bias: Below $3,600 with momentum.
🎯 Key Levels to Trade:
Buy: $3,620–$3,630 / Swing Buy: $3,580–$3,600
Sell: $3,670–$3,690 rejection / Swing Sell: Below $3,600
📢 Action Plan:
Intraday: Trade the $3,620–$3,670 range breakout/rejection.
Swing: Hold long above $3,600; flip bearish only if breakdown confirmed.
⚡️ Stay disciplined. Respect stop-losses. Let the market come to you.

Melt-Up into FOMC - Post FED Expect CorrectionMore all-time highs
I shouldn't be upset (and I'm really not as the portfolio continues to make new YTD highs)
But technically, it is extremely frustrating to see nothing more than slow grind higher after slwo grind higher on the indexes - and also see blowout moves on individual stocks (ORCL, GOOGL, AVGO for example)
Rising Wedge still hasn't rolled over, resistance at 6500 hasn't been a wall yet
50 Day Moving Average is now over 90 bars from price. I could see price action melting up
into a crescendo or peak pre, during, or post FOMC and then fading lower after to find
some technical levels I've been eyeing for weeks
Enjoy the melt-up, just be ready for some action and volatility in the indexes, gold, silver,
bitcoin, and the bond/yield markets
I won't complain about YTD highs, but it's the caution ahead that I don't want to be
surprised by in the coming weeks
Plan accordingly - I'll continue to grind through it the best and safest way I know how
Thanks for watching!!!

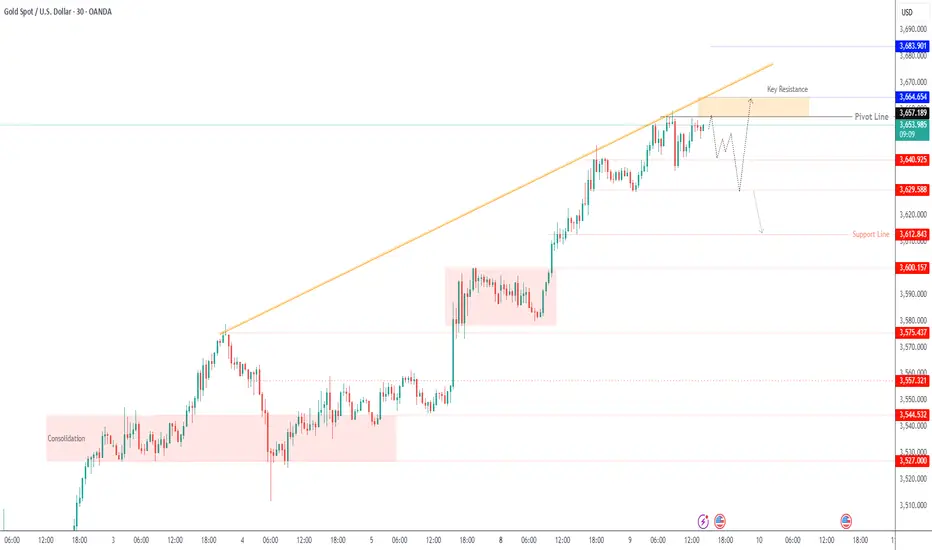
Gold : Neutral Between 3,640–3,657, Breakout to DecideGold – Overview
Gold hit a fresh record high at $3,659 on Tuesday, supported by weak U.S. jobs data and growing bets on Fed rate cuts. Traders now await key U.S. inflation releases – PPI on Wednesday and CPI on Thursday – which could drive the next major move.
📊 If inflation comes in hotter than expected, gold risks a sharp correction.
📊 If inflation is weaker, expectations for a 50 bps Fed rate cut could lift gold further.
Technical Outlook:
🔻 While below 3,657, price may correct toward 3,640. A 15M close below 3,640 would extend the decline to 3,629.
🔺 Stability above 3,657 on a 15M close would support further upside toward 3,665 → 3,683.
Key Levels:
Pivot: 3,657
Support: 3,640 – 3,629 – 3,612
Resistance: 3,665 – 3,683
previous idea:
Goldman lays out the case for $5,000 gold – here’s how it happenGoldman Sachs has warned that gold prices could surge to $5000/oz if the Trump administration succeeds in undermining the independence of the U.S. Federal Reserve.
A politicized Fed is seen as likely to cut rates extremely aggressively (Treasury Secretory Scott Bessent and Trump have called for an interest rate of 1.5% and 1.0%, respectively) to stimulate short-term growth, raising the risk of higher inflation.
Such a move could drive investors away from traditional safe havens like the U.S. dollar and government bonds. In a report released this week, Goldman noted that if just 1% of the privately held U.S. Treasury market shifted into gold, prices could rise by about 40% from current levels.

Australian confidence data slips, Aussie rally continuesThe Australian dollar continues to propel higher. In the European session, AUD/USD is trading at 0.6618, up 0.40% on the day. The Aussie has shot up 1.5% since Thursday and is trading at six-week highs.
Australia's consumer and business confidence have taken a hit, pointing to pessimism over the economic outlook. The Westpac Consumer Sentiment Index fell 3.1% m/m in September, after a strong 5.7% gain in August. Westpac said that the index is back in "cautiously pessimistic" territory.
Consumers remain uneasy over high interest rates, as the Reserve Bank has been slow to lower rates. The Westpac survey found that consumers are more concerned about unemployment and less likely to purchase a major household item.
The NAB Business Confidence Index also headed lower, falling in August to 4 points, down from 8 in July. This marked a three-month low. Still, business conditions showed improvement and forward orders moved higher.
The Reserve Bank of Australia is coming off a quarter-point rate cut and meets next on September 30. The money markets don't expect a cut in September, as GDP rose in Q2 to 1.8% from 1.4% and core inflation jumped to 2.7% in July, up from 2.1%. A stronger economy and higher inflation will make it more difficult for the RBA to lower rates.
We could see a rate cut in November and further easing early in the new year. Much will depend on the direction of inflation, the strength of the labor market, and the health of the Chinese economy.
In the US, the Federal Reserve is poised to deliver a rate hike next week for the first time since December 2024. The weak nonfarm payrolls report has raised the likelihood of a half-point cut to 12%, with a quarter-point cut priced in at 88%, according to CME's FedWatch.

NAS100 - Stock Market, Waiting for Inflation Index?!The index is above EMA200 and EMA50 on the one-hour timeframe and is in its long-term ascending channel. If the drawn upward trend line is maintained, we can expect Nasdaq to reach its previous ATH. In case of its valid breakdown, its downward path will be smoothed to the specified demand zone, where it can be bought with appropriate risk-reward.
U.S. equities closed lower on Friday after a volatile session, capping off a turbulent week in negative territory. Initially, weaker-than-expected employment data fueled optimism that the Federal Reserve would move toward further rate cuts. However, growing fears of an economic recession quickly overshadowed that optimism and pushed the indexes into the red.
Following the labor market report, expectations for a 25-basis-point rate cut at the Fed’s September meeting are now virtually certain. The main question, however, is how fast subsequent cuts might unfold. Some analysts have even floated the possibility of a surprise 50-basis-point cut on September 17. Fed Chair Jerome Powell, speaking at the Jackson Hole symposium, stressed that risks stemming from labor market weakness may now outweigh inflation risks—a factor that could justify a shift in the central bank’s policy approach.
Nick Timiraos, a prominent Wall Street Journal reporter closely tracking Fed policy, noted that the sharp slowdown in job growth over the summer has likely cemented the Fed’s decision to cut rates by 25 basis points in the upcoming meeting.
Still, he made no explicit mention of a 50-basis-point move. While markets have raised the probability of that scenario to 14%, Timiraos believes the main focus remains on a more moderate reduction. He also observed that the latest jobs report has deepened uncertainty over the pace and scope of cuts beyond September—a challenge that policymakers and markets will grapple with in the months ahead.
Barclays Bank now projects the Fed will lower rates three times in 2025—each time by 25 basis points in September, October, and December. This is an upward revision from its earlier forecast of just two cuts in September and December.
President Donald Trump once again lashed out at Fed policy in a post on his social media platform, writing: “Jerome Powell should have cut rates long ago. But as usual, he has acted too late.”
Meanwhile, mounting concerns over ballooning fiscal deficits—not only in the U.S. but also in countries like Japan, France, and the U.K.—have placed added pressure on long-dated bonds. The yield on the 30-year U.S. Treasury briefly climbed to a one-and-a-half-month high last week. At the same time, the Treasury Department plans to issue new three-year, ten-year, and thirty-year securities next week, an event that could further fuel volatility in the bond market.
The coming week will be light in terms of data volume, yet the few scheduled releases will carry significant weight as inflation once again takes center stage. On Wednesday, the Producer Price Index (PPI) for August will be published. Forecasts suggest both the headline and core readings will show sharp declines compared to July.
On Thursday, the European Central Bank (ECB) will hold its policy meeting, where markets currently expect the deposit rate to remain unchanged at 2.15%. Shortly afterward, traders will turn their attention to the U.S. Consumer Price Index (CPI) for August, along with weekly jobless claims data—closely monitored for signs of potential weakness in the U.S. labor market.
Finally, on Friday, the preliminary University of Michigan Consumer Sentiment Index will be released. This survey has been a particularly important gauge of inflation expectations this year, offering deeper insights into how U.S. households perceive price trends.
The PPI, which reflects changes in goods prices at the factory gate, often provides more forward-looking signals than the CPI. As shown in July’s data, any unexpected surge in August’s numbers could temper investors’ optimism about the pace of rate cuts. For now, the impact of tariffs on goods prices appears limited, while the Fed’s main concern remains the risk of renewed inflationary pressures in the services sector. According to the Cleveland Fed’s Nowcast model, headline inflation rose 0.1% in August to reach an annualized rate of 2.8%, while core inflation held steady at 3.1%.

Will Fed rate cut expectations continue to fuel US equity gains?
US August job growth missed expectations, highlighting labor market weakness, while rising Fed rate cut odds kept equities higher. Broadcom (AVGO) delivered strong 3Q earnings with robust AI-driven growth and issued an upbeat 4Q revenue forecast. Despite valuation concerns, Morgan Stanley (MS) expects multiple Fed cuts to sustain equity gains and views September dips as buying opportunities.
US500 extended its uptrend, briefly setting a new high. The index remains within the ascending channel and above both EMAs, signaling the potential extension of bullish momentum. If US500 holds above EMA21, the index may breach the 6530 high. Conversely, if US500 breaks below EMA21 and the channel’s lower bound, the index could retreat toward the support at 6340.

USDJPY Primed for Push Higher! Ascending Channel & Bullish🔮 USDJPY Technical Forecast & Trading Strategy | Week of Sept 6th, 2025
Current Spot Price: 147.385 | CFD | Date: Sept 6, 2025
🟢 Overall Bias: BULLISH | The pair is trading within a clear bullish structure on higher timeframes. All pullbacks are currently being bought, indicating strong underlying demand.
📊 Multi-Timeframe Technical Breakdown
1. Chart Pattern & Theory Convergence:
🚩 Bullish Continuation Patterns: The price action from the August low exhibits characteristics of a Bull Flag or an Ascending Channel. A clean break above the 148.00 resistance would confirm this pattern and open a path significantly higher.
📐 Gann Theory & Square of 9: The current price is consolidating near a key Gann angle. A hold above 147.00 is crucial for the bulls to maintain control and propel price towards the next Gann objective near 148.80-149.20.
🌊 E lliott Wave Theory: The rally from the late August low is impulsive in nature, suggesting this is part of a larger Wave 3 or Wave C push higher. Any dip is likely a Wave 4 correction before a final Wave 5 thrust.
☁️ Ichimoku Kinko Hyo: A strongly bullish configuration. The price is well above the Kumo (Cloud), the Tenkan-sen (9) is above the Kijun-sen (26), and the Cloud itself is bullish. This is a classic trend-following signal.
2. Key Indicator Signals:
📶 RSI (14): On the 4H chart, the RSI is holding firmly in bullish territory (above 50) and has not reached overbought (>70) levels, suggesting there is more room for the trend to run. 🟢
📏 Bollinger Bands (20,2): Price is riding the upper band, a sign of strong momentum. Any pullback would likely find support at the middle band (20 SMA ~146.80), which is rising.
⚖️ VWAP & Anchored VWAP: The price is trading well above the daily and weekly VWAP, confirming that the trend is strong and the average participant is long and in profit.
📈 Moving Averages: The key EMA's (50, 100, 200) are all bullishly aligned and acting as dynamic support. The 50 EMA on the 4H chart (~146.90) is a key level for bulls to defend.
3. Critical Support & Resistance:
🎯 Immediate Resistance: 148.00 (Psychological, Recent High)
🎯 Key Resistance: 149.20 - 149.50 (Gann Target, Previous Swing High)
🛡️ Immediate Support: 147.00 - 146.90 (Previous Resistance, 50 EMA)
🛡️ Strong Support: 146.20 - 146.00 (Kijun-sen, Key Fibonacci Level)
🛡️ Major Support: 145.00 (Top of Ichimoku Cloud)
⚡ Trading Strategies & Setups
A. Intraday Trading (5M - 1H Charts):
Strategy: Look for long opportunities on dips towards support. Use bullish candlestick patterns (Hammer, Bullish Engulfing) near the 147.00 or 146.90 levels for high-probability entries.
Long Entry (Ideal): ~147.10 - 146.95 | Stop Loss: 146.60 | Take Profit 1: 147.80 | Take Profit 2: 148.50
Breakout Long: On a decisive break and hold above 148.10, with a target of 148.80.
B. Swing Trading (4H - D Charts):
Strategy: The bullish structure and Ichimoku alignment favor continued upside. Any dip into support is a potential buying opportunity for a larger move.
Swing Long Entry: On a pullback to 146.90-146.70 (Buy the Dip) OR a daily close above 148.20 (Breakout Buy).
Stop Loss: Below 146.20 | Target 1: 149.20 | Target 2: 150.00+
Bearish Invalidation: A decisive break and close below 145.80 (into the cloud) would invalidate the immediate bullish bias and signal a deeper correction.
🌍 Market Context & Risk Factors
Interest Rate Divergence: This is the core driver. The pair is highly sensitive to the US Dollar (USD) strength and Bank of Japan (BoJ) policy. Hawkish Fed rhetoric vs. dovish BoJ stance is profoundly bullish for USDJPY. 👁️ Watch for any unexpected BoJ intervention hints.
Risk Sentiment: Traditionally a "risk-off" proxy, but currently driven more by yield differentials. Monitor global equity markets and geopolitical events for sudden flight-to-safety flows into the JPY.
✅ Key Takeaways:
The Trend is Your Friend! 🐂 All higher-timeframe signals point to a robust bullish trend.
Ichimoku is Bullish. The price above a bullish cloud is a strong trend-confirmation signal.
Buy the Dips. The strategy favors entering on short-term weakness toward support rather than chasing the breakout.
Mind the BoJ. The largest risk is verbal or physical intervention from the Bank of Japan, which can cause violent, sharp reversals.
For individuals seeking to enhance their trading abilities based on the analyses provided, I recommend exploring the mentoring program offered by Shunya Trade. (Website: shunya dot trade)
I would appreciate your feedback on this analysis, as it will serve as a valuable resource for future endeavors.
Sincerely,
Shunya.Trade
Website: shunya dot trade
⚠️Disclaimer: This post is intended solely for educational purposes and does not constitute investment advice, financial advice, or trading recommendations. The views expressed herein are derived from technical analysis and are shared for informational purposes only. The stock market inherently carries risks, including the potential for capital loss. Therefore, readers are strongly advised to exercise prudent judgment before making any investment decisions. We assume no liability for any actions taken based on this content. For personalized guidance, it is recommended to consult a certified financial advisor.

EURUSD Technical Analysis & Trading Strategy 📊 EURUSD Technical Analysis & Trading Strategy | Week of Sept 6th, 2025
Asset: EURUSD CFD | Spot Price: 1.17208 (as of Sept 6th, 2025, 12:54 AM UTC+4) | Timeframe: Intraday & Swing
🎯 Executive Summary (TL;DR)
EURUSD is at a critical 🔄 juncture! Our multi-indicator analysis reveals a market in consolidation following a recent bearish impulse. Key 🎯 harmonic and Gann-based support converges near 1.16800. A break below could trigger a sell-off towards 1.1600, while a hold could spark a bullish correction towards 1.1800. This week is pivotal for direction! ⚔️
📈 Detailed Technical Breakdown
1. Chart Pattern & Theory Analysis
📉 Elliott Wave Theory: The price action from the August high suggests we are in a corrective wave (likely Wave 4 or a bearish Wave C). The structure is complex, indicating potential exhaustion of the current move.
🦀 Harmonic Patterns: A potential Bullish Bat Pattern 🦇 is completing near the 1.1680-1.1700 zone. This is a key PRZ (Potential Reversal Zone) with a high probability of a bullish reversal.
🧮 W.D. Gann Analysis: Applying the Square of 9 and Gann angles, the price is testing a vital support angle. A daily close below 1.1700 would be a strong bearish signal according to Gann time-price theory, opening the path downward.
⛰️ Head and Shoulders: A smaller, intraday Head and Shoulders pattern is forming on the 4H chart. A break below the neckline (approx. 1.1700) would confirm this bearish reversal pattern, projecting a target towards 1.1650.
⚖️ Wyckoff Theory: The chart shows signs of a re-distribution phase. We are watching for a Sign of Weakness (SOW) or a Spring (a false breakdown below support) that could indicate the next major move.
2. Key Support & Resistance Levels
🧱 Immediate Resistance: 1.17500 (Previous Support turned Resistance)
🎯 Strong Resistance: 1.18000 (Psychological Level & 50-Day EMA)
🛡️ Immediate Support: 1.17000 (Psychological & Pattern Confluence)
🎯 Strong Support: 1.16800 (Harmonic & Gann Confluence Zone)
🚨 Major Support: 1.16000 (Weekly Swing Low)
3. Indicator & Momentum Outlook
📶 RSI (14): Currently reading 42 on the 4H chart. This indicates a neutral-to-bearish bias with room to move lower before hitting oversold territory (<30).
📊 Bollinger Bands (20): Price is trading in the lower half of the bands, indicating bearish pressure. A squeeze is evident, suggesting a volatility expansion is imminent. A move towards the middle band (20-SMA) is likely on any bounce.
💹 Moving Averages: The 50-EMA (1.1790) and 200-EMA (1.1755) are both above the current price, confirming the short-term bearish trend. A ** bearish cross** (50-EMA crossing below 200-EMA) is not yet in play but is being watched closely.
🏢 VWAP (Volume Weighted Average Price): The price is trading below the daily VWAP, indicating that buyers from this period are at a loss—a bearish sentiment. The Anchored VWAP from the last high shows significant selling pressure.
⏰ Trading Strategy & Forecast
A) Intraday Trading (5M - 1H Charts) 🎯
🔻 Bearish Scenario (Breakdown): A break and close below 1.17000 could signal a short opportunity. Target: 1.16800 (initial), then 1.16500. Stop Loss: just above 1.17250.
🔺 Bullish Scenario (Bounce): A hold above 1.17000 with a bullish reversal candlestick (e.g., Hammer, Engulfing) could signal a long scalp. Target: 1.17500 (resistance). Stop Loss: below 1.16850.
B) Swing Trading (4H - Daily Charts) 📅
🔄 Outlook: The swing bias remains cautiously bearish until price reclaims the 1.1800 level.
Entry (Short) : A retest of 1.1750-1.1780 (failed resistance) could offer a high-probability short entry for a swing down towards 1.1600.
Entry (Long): Aggressive bulls could look for long entries near 1.1680 (harmonic/Gann support) with a tight stop below 1.1660, targeting a move back to 1.1800.
🧘 Risk Management: Always use a stop-loss. Risk no more than 1-2% of your account on any single trade.
🌍 Market Context & Final Thoughts
Globally, all eyes are on ECB vs. Fed policy divergence 🏦. Any hawkish remarks from the Fed or dovish tones from the ECB could fuel further USD strength, pressuring EURUSD lower. This technical setup aligns with a bearish fundamental backdrop.
Conclusion: The 1.1680-1.1700 zone is absolutely critical. 🚨 A break below likely triggers the next leg down. A strong bounce from here could lead to a larger corrective rally. Trade the breakout/breakdown with the confluence of patterns and indicators.
✅ Trade Safe! Remember to always manage your risk.
