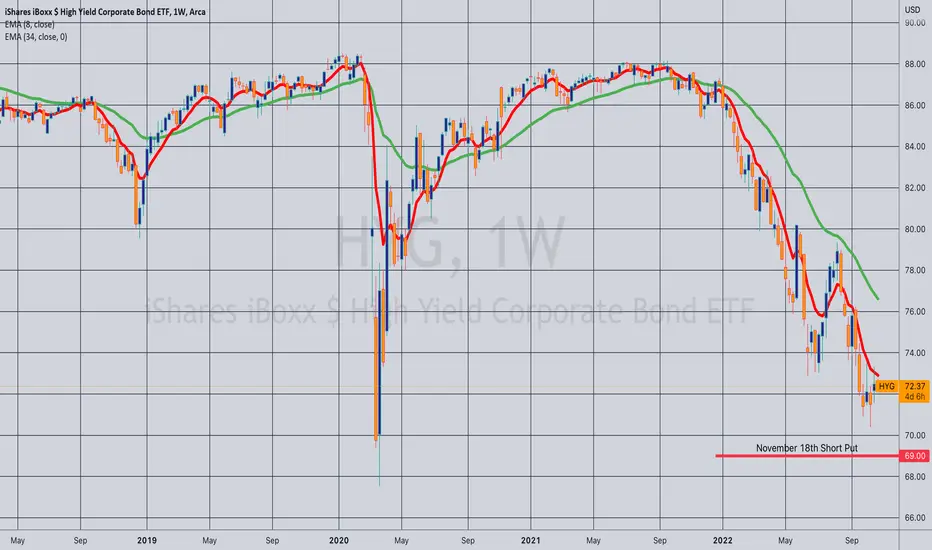
Opening (IRA): HYG November 18th 69 Short Put... for a .42/contract credit.
Comments: Targeting the strike paying around what the distribution would be were I to actually be holding shares. The last distribution was .351 per share; 5.19% annualized.
HYG
BTC, SPX, RUT wide gap from HYG. We're up for a rude awakening dear fellows,
it came to our attention the monthly chart of HYG, BTCUSDT, SPX, RUT. they all belong to the same class of speculative assets.
of them, HYG is likely to have the greatest demand for liquidity as it lives out of refinancing its cash flow, let alone its debt.
notice how
1. they are synchronized in what concerns the bottoms
2. HYG renewed the lows at each new bottom, never the highs at each top.
3. the others did the opposite
this mismatch opened up a wide gap in the logarithmic scale of the y axis.
the logarithmic scale shows how much percentually current level still can fall.
thus, BTC, SPX and RUT still can fall more than they did already until they catch up with HYG.
that is precisely the case of FED keeping current policy "until something brakes".
that would be a rude, late, awakening for anyone not knowing where to look at for market health check.
best regards.

BULLISH Signal flash with 2008 failure exampleThere is some discussion taking place regarding the divergence of SPY and HYG during the last few days and this divergence is a signal for marking the market bottom.
I would like to point out while this generally is a true indication of a potential reversal/bottom (under normal circumstances).
We are not dealing with normal circumstances.
The same signal existed in 2008 (also not normal circumstances) between 2 Jun 08 - 19 Jun 08. The "rally" in SPY was very, very lite before failure. SPY only "rallied" 2.7% before
cycling back down another 10%, holding in range for 2 months then waterfalling down another 38%.
Use extreme caution IF trading this signal.
I would consider this signal as being "Set-up", the "Follow-Thru" would be price moving above 373.04
2008 required a follow-thru above 141.17, "rally" price high was 137.12 which obviously failed to reach the follow-thru requirement and prices failed through the support. Down ~48% within 5 months.
This is not a prediction/forecast, this is pointing out potential of failure while others are discussing potential of success.

U.S. INTEREST RATES IN THE 2 YR 5 YR 10 YR HAVE TOPPEDTOP WAVE STRUCTURE the chart posted a week ago is very clear we have peaked in ALL interest rates and A major I..T. top in U.S. $ Iam 75 % net short the DXY at 109 I stated the alt target was 110.25 the original projection was 114/116 DO NOT BE LONG THE US $ THIS SHOULD BE A STRONG POSITIVE FOR BONDS STOCKS and ALL Metals move to a net long Silver copper gold platinum NOW rally to start or has begun .best of trades WAVETIMER
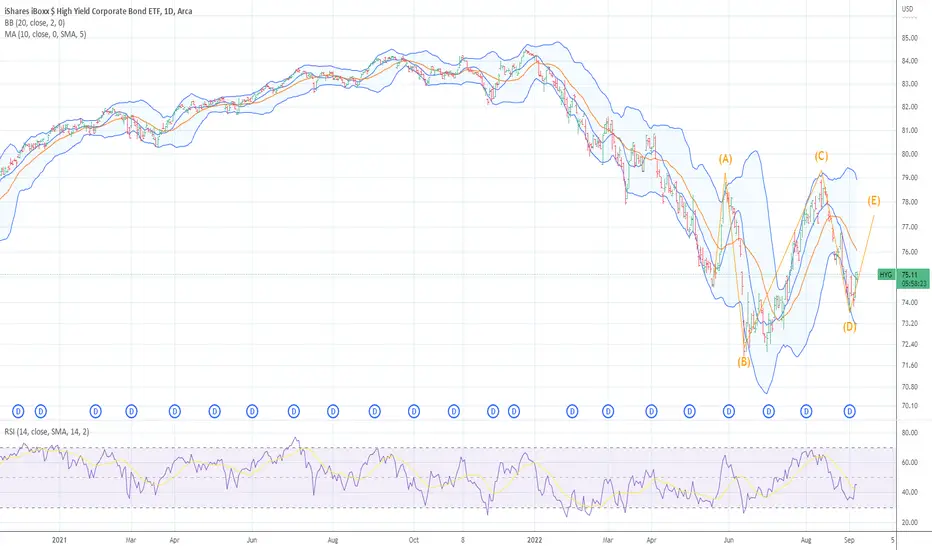
JUNK BONDS HYG WAVE D .887 The chart posted is that of hyg the junk bond market . so far we all three waves within the structure . if we hold here at a .887 golden ration we would then see the last rally this market will see for years to come we would then see wave E UP THIS WOULD BE WAVE B TOP

DXY/HYG is close to 1.5DXY/HYG is close to 1.5. It has only been this high 4 times since 2000. It is a risk-off signal, but it is a signa of market bottom as well.

A bullish scenario for HYGTake profit level: $80
HYG tracks a market-weighted index of US high-yield corporate debt.
In general terms, HYG is a perfectly adequate high-yield corporate bond index ETF, with a reasonably good yield. Adequate does not mean good, as the fund compares unfavorably to most of its peers in three key metrics: expense ratio, dividend yield, and total shareholder returns.

Looking for Short HYGHi Everyone,
I'm waiting for Short if the break break the trend-line.
Signals:
- Price in Resistance.
- Main Trend, Bearish.
- Close to The top of the Bearish-Channel.
Good Bye & Good Trading!!!

Junk Bonds are testing a 7 month old downward trendline!If you’re chasing portfolio income, you may be eyeing high-yield bonds, also known as junk bonds, which typically pay more interest but carry greater risk.
Since interest rates and bond prices move in opposite directions, U.S. junk bond values have dipped to the lowest levels since May 2020. But yields are at 7.5% as of May 17, up from 4.42% since the beginning of January, according to the ICE Bank of America U.S. High-Yield Index.
However, high-yield bonds have greater default risk than their investment-grade counterparts, meaning issuers may be less likely to cover interest payments and loans by the maturity date.

Spotted a correlation between High Yield Bonds and oilThey almost always trade exactly the same.
And HYG has NEVER gone down without oil going down.
Until right now.
Wonder how long it will take to correct.

Have corporate bonds bottomed?The Corporate bond market got extremely oversold and it bounced without the Fed having to pivot. Essentially the market got to 2013-2018 levels, and bounced nicely at the old support. But we still don't know whether the bottom is in or now, as there are more questions that need to be answered, like: Does the market expect the Fed to reverse course soon? Does the market think the bottom is in for bond yields? Does it think inflation has peaked?
In my opinion the market did the tightening itself without the Fed. The Fed did a mistake for not raising rates and ending QE faster, however they were right on their approach to go slowly, as one way or another inflation would slow down. By inflation slowing down down I don't mean that prices will go down, just that prices will go up a lot less than they did over the last 1-2 years. At the same time I do believe that as inflation comes down, it is possible that we get to see the Fed say that they will pause their hikes after raising them to around 2% and will let their balance sheet roll off on its own.
Essentially higher interest rates, lower asset prices, tight fiscal and monetary policy, and already high energy prices are crushing demand. The Fed was/is behind the curve, but as the curve seems to be now moving to the direction of the Fed. To a large extend their objective has been achieved, as this correction was similar to the 2018 correction, only that this time around the correction was welcomed when back then it wasn't.
Now I don't really think the bottom is in for corporate bonds, however I also don't think they are going to roll over very quickly. If the food & energy crisis gets worse, I have no doubt that these will get crushed. It just seems that in the short-medium term things will cool down a bit and part of them Fed's goals have been achieved. The US economy remains fairly strong and its corporations are in a fairly good shape, despite everything that has been going in the world over the last few years.
Having said all that I don't want to be a buyer of HYG at 80. At those levels I think it is better to short and aim for 77-78, and then if the price action looks decent, go long at those levels. The bounce is too sharp for it to have legs to go higher immediately. I'd expect more chop in the 75-81 area before the market decides whether it is going to go higher or lower.

Bond yields in the era of high inflationAs you can see on the main chart, 10y bond yields have broken above their downwards channel and are now back at their 2013-2018 highs. Based on technical analysis we don't have a confirmation that the trend has fully reversed until we get a close above 3.2%, but we are pretty close to breaking above that level too. Now we aren't only seeing the 10y yields rise, as all kinds of maturities are rising at the same time and are rising pretty fast. The trend is showing no signs of exhaustion and this could get pretty ugly for the world economy, as the Fed has barely raised rates so far and they are threatening to raise rates by 0.5% at every meeting in 2022.
Many analysts claim that the bond market is broken and that yields will rise even further, but are they correct? Well the truth is that the way bond market topped (yields bottomed) in March 2020 is definitely an indication that a bull market is over. Currently the market has broken below most major support lines and seems to be accelerating rather than decelerating, while the correction from the peak is indicating that the bull market is over, as during bull markets corrections tend to stay within a certain range, and this correction is way larger than any previous corrections.
At the same time the 2y year yields are above 2.5%, a level that they 'shouldn't' have broken if the bond bull was intact. The reason behind this is that usually 2y bond yields would never go above the peak of the Fed Funds Rate and during the last hiking cycle the FFR had peak at 2.5%. Currently the 2y yields look like the formed the perfect round bottom (bullish technical pattern) and have broken above their downwards channel and could also be headed higher in the medium to long term (an indication that the bond bull could be over).
However not everything is really bearish for bonds at the moment and there is some hope for the bull market, even if that means we only get a strong bounce before going lower. As the 10y and 30y yields haven't broken above their resistance levels yet, it might be a good time to start buying bonds. Why? Well as yields are at resistance, bonds are close to support. The actual bonds are so oversold, that the current move might be getting totally irrational. Yes inflation is going up, yes inflation could go higher and inflation expectations keep rising, but the rate of inflation could come down. Not only that, but the Fed is so trapped that everyone knows they can't really raise rates much more or sell bonds without breaking the market. Financial conditions have already tightened so much, that investors will eventually run to the safety of bonds which finally have a pretty attractive yield.
Of course my reasoning doesn't just rely on some random fundamental analysis, but also some technical factors. The first one has to do with how this break of the trendline could be a trap and this move is headed straight into a very important area in which there is strong support. On TLT there is a major gap at an area that was support, it was broken and then the market quickly closed back above it. That's the perfect place to go long. The second one has to do with the fact that the yield curve had inverted and has now un-inverted itself. Usually inversions happen close to the bottom of the bond market (peak in yields) and therefore this could be another useful signal that a bottom isn't far away. Again this doesn't mean that someone has to go long right now or go long big, just that maybe its time to cut down shorts and put on some small longs. Personally I like to move between being a bond bull or bear based on the data and not have dogmatic views about what will happen in the future.
Finally I'd like to talk a bit about junk bonds, which are at the same level they were when the Fed had raised rates at 2.5% and kept saying that they would keep hiking. With so much debt in the world, the Fed threatening to keep hiking rates and the global economy being in shambles due to Covid-19, aging demographics, supply chain issues, lockdowns in China, the Russia-Ukraine war and commodity shortages, it is hard for someone to really see how owning junk bonds is a good long term bet here. Shorting junk bonds is probably the best bet someone could take at this stage, if he/she believes that there is going to be a major collapse either in the stock market or the bond market.
What I find very interesting is how resilient American companies have proven to be, and how after so many major crashes since 2008, now junk bonds are rallying against treasuries. By looking at the HYG/TLT ratio, we can see how they have outperformed since the March 2020 crash, potentially due to how much the US government has support those companies and how much more the private sector has benefited from low rates and money printing compared to the public sector. By adding to the mix how strong stocks have been over the last 2 years despite all the negative events, we can make sense of why junk bonds are outperforming us treasuries. Maybe this is also a major sign that buying stocks is a much better idea in the long term than buying bonds, and that the stock bull market is still intact, but that's a topic which I will discuss in another idea.
In conclusion, the bond bull could be over. There are several signs indicating extreme weakness in bonds as inflation expectations keep rising and the Fed is unwilling to support the bond market. Yet we are at levels that not buying bonds seems like the wrong decision, even if buying them would only for a short time period only.

SPX likely just Finished a Cycle HighI have Swing short signals all over the place. SMH, IYT, and XLI leading markets lower to start the Quarter here. The Russel had a real bad day today as the credit markets (junk bonds) are tanking once again. Even Energy looks to be resetting lower.

HYG IS NEARING A I.T. LOW HYG is now in the last wave within this decline or correction . this is the last neg for the markets. for this down leg . and we are now ready to see the mark go from BEAR PHASE target date jan 27 plus or minus 1 day . We now rally I will post . DO NOT BE SHORT

HYG Death Cross... Caution WarrantedHYG put in a Death Cross last week and this week, on November 22nd, HYG lost the October 11th low with SPY selling off heavy into the close. We may backtest the October 11th low but this is a potential negative indicator for equity risk on. Equities tend follow lockstep with high yield, or so they have with every major selloff since 2007-2008. This is something to keep an eye on over the next week or so, especially after Thanksgiving.

Credit - The Second Wave - EvergrandeIdea for Credit:
- Stocks had a bit of a reprieve as China's collapsing property firms were halted for 2 weeks, and China's markets had gone on holiday for Golden week.
- Stock market had an unwinding of hedges last week, but are things really 'Back to Normal'?
- The bond market does not think so, and seems to be presaging more drawdown to come.
- EM High Yield has been in capitulation, while US Corporate bonds and HY are accelerating their declines.
- High Yield Spreads are about to breakout.
- This is a problem that has not simply gone away, but rather will only get worse.
- Nikkei had even erased all losses of the year in 2 weeks, then lost them again in 2 weeks more, to continue its bear market:
- Remains to be seen how far-reaching the effects will be on China's 5T property market. The drag on global property market is real:
More to come on that later.
The stock market has its best days in bear markets as volatility increases, and this is really telling of the situation. I think we are already in a global bear market and recession.
110 1911 222
GLHF
- DPT

junk bonds undesired while treasuries catching bid, hyg over tltwith higher inflation and possible shrinking forward guidance, are corporate junk grade bonds less desirable now? maybe the market doesnt top out or pull back, but cpi over 5% while junk bonds yield mid 4% starts to sound less attractive for the risk, doesnt it?


US Micro-Cap Breaking Out?Here in this position, it is clear that intensive work has gone into supporting the entire global recovery.
Moreover, we could already count the resilience in credit as ideal results from the covid siege. But now I want to focus on the US and small caps in particular are getting to work and the advance is leading to a more palpable exhaustion leg and opening some of the wildest trades for 2022 and beyond.
You can see this is not the same position in China or Hong Kong.
In the short and immediate term, we are witnessing capital rushing to park in US assets as the ONLY alternative. The pressure to park capital in 'safe assets' which are not threatened by the nanny state in the Far-East, Middle-East, Russia and now to a lesser extent Europe while it remains hijacked via Schwab. This more or less exhausts the options that we have and has clearly pinned both the Hang Seng and Shanghai Comp:
Sure the "migration of capital" from East to West is underway but the threat of US losing its hegemony is a multi-decade process.
I will be looking to fade the highs in US Microcaps from October time to ride profit taking into Q1 2022 before we start chapter two. Interested to gage the interest levels for ETFs here, if there is enough we can start to establish some levels, calls, and invalidation zones for IWC together in the comments.

$PAGS: to make you BAGS?Today we are witnessing a sharp turn around in Emerging Markets $EEM after the Jackson Hole meeting. $IWM a strong indicator of risk tolerance has seen a sharp move back up into it's middle pivot. Could the continued low rate environment and strong economy be enough to continue the rush into risk-on assets? Keep a close eye on $EWZ though (Brazil ETF in which PAGS is located) to pin point entries. On the technical side of things, keep an eye on entries in between the two trend lines in which the current candle stick is located between and stops outside of the bottom two trendlines. I'd look to scale in over the next couple of weeks and see how strong the dips in $IWM, $HYG and $EEM are to see how much continuation is possible to the upside. Good luck traders!

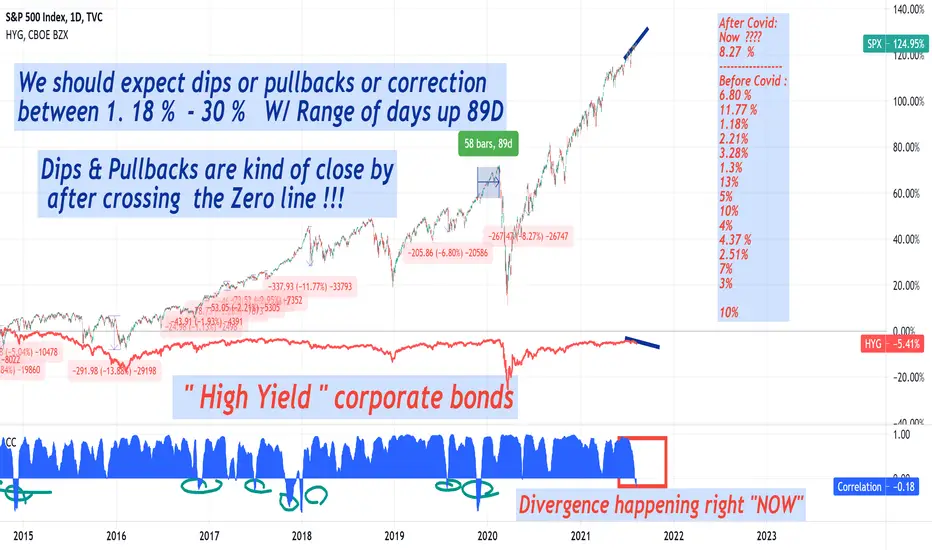
SPX &HYG correlation/Diver since 2007, good pullbacks W/ H.RangeSome with high range of days before a pullback/correction !!!
Dips & Small Pullbacks are kind of close in range after crossing
the Zero line !!!
Data:
After Covid:
Now ????
8.27 %
-----------------
Before Covid :
6.80 %
11.77 %
1.18%
2.21%
3.28%
1.3%
13%
5%
10%
4%
4.37 %
2.51%
7%
3%
10%
Bond yields keep fallingBonds all across the world, across all different spectrums (from gov bonds to junk bonds) have been rising (their yields falling). This is a signal that there are deflationary pressures and that people are searching for yield in an environment with few opportunities. There are other reasons too, but overall this isn't the best signal. Clearly big corporations and governments are benefiting from the situation, but this is also a fragile situation. Although the current conditions benefit some stocks and risk assets due to the highly negative real rates, this doesn't mean that everything is perfect. Personally I believe equities haven't topped and they have much more room to grow from here, but I also think a big correction isn't far away (10-20%).
In my opinion bond bulls are in control (bearish on yield) and yields could fall even lower.

Volatility - Do Not Resuscitate - Evergrande (VIXplosion)Idea for Macro:
- Free money is cut off at the source. China Credit Impulse turned negative > Evergrande is first to fall > Overseas investments downsized > widespread effects.
- China was the only productive economy in 2020 > driver of global economy (60% importer of oil).
- CN30Y is closely correlated to CCI > leads US30Y > leads US risk assets.
- Chinese Central Bank POC draining liquidity from the system (Injects 10 bn yuan via RRP while 30 bn yuan expires).
- China HY leads down > US HY/Junk goes down > NDX goes down:
- Currency showing strength:
When you see currencies, bonds, and equities rising together, it means normal correlations have fallen apart. Typical before a crash/crisis type event.
CCI is the leading indicator.
Will see a VIXplosion.
GLHF
- DPT
