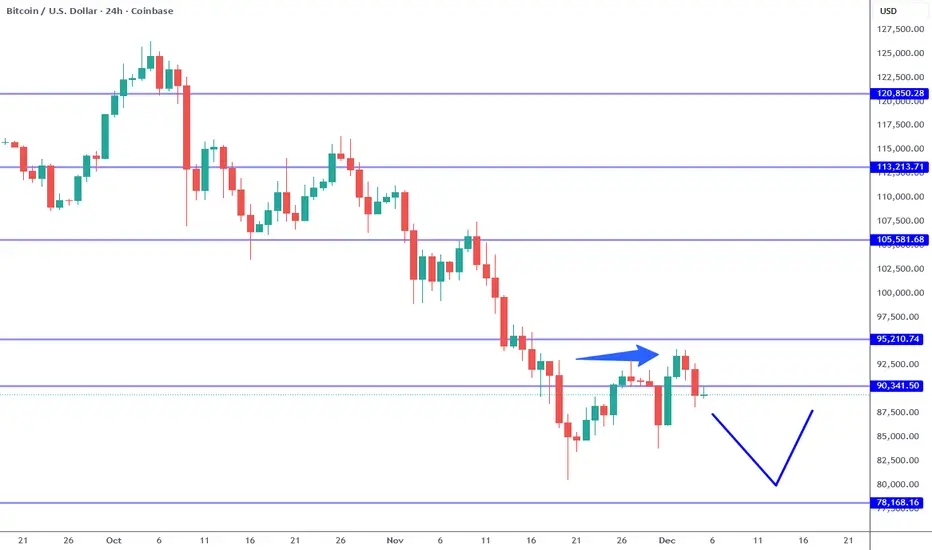
Bitcoin Setting Up For New Low.Bitcoin short term trend is STILL bearish. The 95K resistance defines the structure which implies a lower low is likely to follow in the near future. There is also a failed high off the 93,500 area which suggests further weakness as well (see arrow). IF the 88K area breaks again (trend line break), a test of the 78K low area becomes a higher probability. IF the 95K resistance is broken instead, it cancels out this scenario. It is not about which way I think the market is going to move, it is about what the MARKET chooses. Our job is to look for confirmations, manage risk and adjust to NEW information.
This week we have the FOMC meeting and press conference. This event carries a LOT of weight especially because the Fed is expected to provide guidance on how they plan to shape monetary policy in the near future. The market has priced in another 25 basis point cut, which means what will move the market dramatically is what is said as the press conference. This event has the potential to change the Bitcoin price structure and short term expectation as well. Going into this with opinions is a sub optimal way to mange risk around such an event.
While the major index markets like S&P and Nasdaq are also testing potential resistance levels, IF the Fed unveils and dovish outlook prices will likely grind higher. Also it is important to keep in mind in the coming year (May) Chairman Powell will be out and a new appointee will take over. WHOEVER this person is (still not officially known), WHATEVER they say in interviews, etc., before he is officially the chairman will carry MORE weight than Powell. Important to KEEP in mind for the coming year.
When markets are coming up to an event such as this FOMC, it is better to keep expectations low and take whatever you can get. For example, if you play the bullish trend line on a 4 hour chart for a swing trade, do not look for more than 1:1 trades even for brief swing trades. It is the same if the resistance levels are tested: wait f or confirmations, whether it is a day or swing trade, and keep profit objectives tighter than usual. Markets are likely to become more and more indecisive going into the day of the meeting.
If 78K to 80K support is tested again, watch for a lower low. 73K is a major support. These levels are attractive for investing in my opinion.
Thank you for considering my analysis and perspective.
Community ideas
Gold - The bullrun top happens now!✂️Gold ( OANDA:XAUUSD ) is heading for a major reversal:
🔎Analysis summary:
After the all time high breakout back in 2024, Gold has been rallying about +115% until today. During this entire move, Gold did not create any real correction. Considering that Gold is currently retesting a major resistance trendline, the bullrun top happens now.
📝Levels to watch:
$4,000
SwingTraderPhil
SwingTrading.Simplified. | Investing.Simplified. | #LONGTERMVISION

Bitcoin (BTCUSDT) – Intraday Trend & Pattern AnalysisHi!
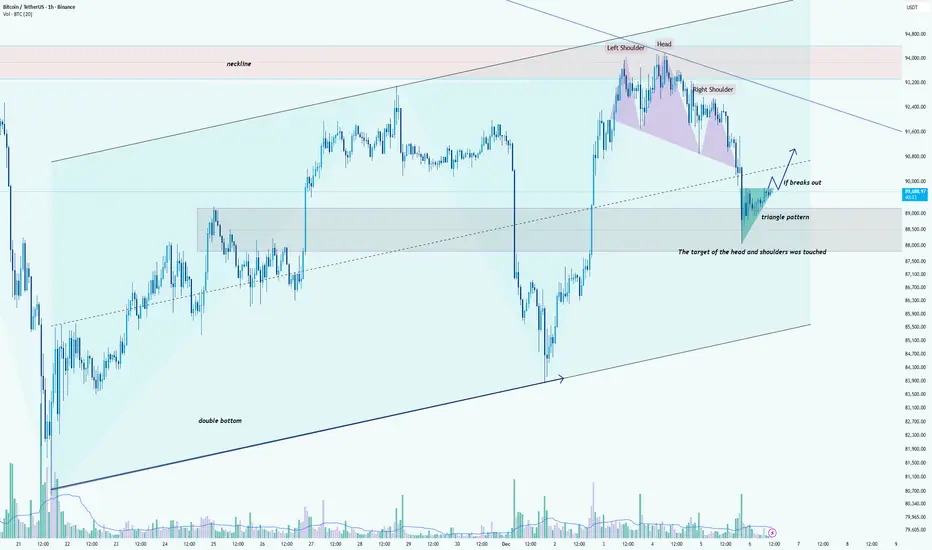
Bitcoin continues to trade within a broader ascending structure, supported by an established rising trendline that has guided price higher over the past weeks. After forming a double bottom near the lower boundary of this channel, BTC initiated a strong rally toward the major resistance zone around 95,000 USDT, where a clear head-and-shoulders reversal pattern appeared. The neckline later broke, and its measured target has already been fully achieved, confirming the pattern’s validity.
Following the completion of this decline, the price stabilized inside the previous consolidation zone and began forming a triangle pattern, signaling compression and potential trend continuation. BTC is now testing the upper boundary of this triangle. A confirmed breakout above the pattern could trigger a bullish continuation toward 90,500–91,200 USDT, aligning with the dashed trendline and short-term resistance levels.
Failure to break upward may lead to a retest of the triangle’s lower boundary or even the broader demand area around 88,000–88,500 USDT, which previously acted as a reaction zone.
Overall, as long as the price remains above the ascending channel’s main support, the medium-term structure favors buyers. A breakout from the triangle will be the key signal for renewed bullish momentum.
Bitcoin Roadmap | Short-termBitcoin( BINANCE:BTCUSDT ) began to decline from the resistance zone($95,020-$94,840) exactly as expected in my previous idea , successfully reaching all targets.
At the moment, Bitcoin was able to break the support zone($90,650-$90,000). It seems that the pullback to the broken support zone($90,650-$90,000) could be completed with a symmetrical triangle pattern, although given the low trading volume on Saturday and Sunday, this triangle may not function properly.
In terms of Elliott Wave theory, Bitcoin appears to be completing the microwave C of the main wave B, and I expect at least one more impulsive 5-wave move to the upside.
I expect Bitcoin to start rising from the support zone($89,230-$88,000) or the Potential Reversal Zone(PRZ) maximum. A break of the resistance lines could be a good sign for Bitcoin to rise again.
What do you think? Do you believe Bitcoin will dip below $75,000, or will it bounce back?
Cumulative Short Liquidation Leverage: $98,260-$96,690
Cumulative Short Liquidation Leverage: $90,560-$89,990
Cumulative Long Liquidation Leverage: $87,820-$87,290
Cumulative Long Liquidation Leverage: $83,900-$82,400
First Target: $89,911
Second Target: $92,119
Stop Loss(SL): $86,120(Worst)
Points may shift as the market evolves
💡 Please respect each other's opinions and express agreement or disagreement politely.
📌Bitcoin Analysis (BTCUSDT), 1-hour time frame.
🛑 Always set a Stop Loss(SL) for every position you open.
✅ This is just my idea; I’d love to see your thoughts too!
🔥 If you find it helpful, please BOOST this post and share it with your friends.

SOLUSDT – Gains Limited, Price Faces a Key Decision ZoneHello everyone, SOL experienced an impressive upward move over the past weekend, but the current momentum has noticeably weakened as the price hits the EMA 89 (blue), an area that has previously created strong selling pressure last month.
After bouncing around the 145 USD mark, SOL retraced to test both EMA 34 (red) and EMA 89, forming a critical convergence zone to determine the next direction. Recent candles show long upper wicks accompanied by decreasing volume, indicating that buyers are losing strength compared to the previous breakout while profit-taking pressure is rising. The market structure has yet to confirm an uptrend, as SOL has only slightly broken local highs without forming a clear higher-high, explaining why the price was rejected at EMA 89.
From a macro and capital flow perspective, over the past 48 hours, the Solana ecosystem has shown a positive recovery, with several DeFi projects and memecoins rallying. However, capital inflows into altcoins have paused as investors await updates from the Fed and US economic data. Bitcoin is currently moving sideways, meaning the primary market momentum supporting altcoins, including SOL, is insufficient to drive a breakout. Therefore, even positive news is not yet strong enough to establish a new trend.
Wishing everyone successful trading!

BTC USDT Next 5 price movesBTC seems poised for a downward correction. Expect few down moves over the next week or so.
Key Support levels below
S 1: 88,200
S 2: 87,000
S 3: 85,400
S 4: 83,500
S 5: 74,100
S 6: 69,100 (Market Bottom)

PIPPIN/USDT — Massive Accumulation Base Breaking After 10 MonthsNovember 29, 2025
PIPPIN has spent almost the entire year trapped inside one of the most extended accumulation ranges in its chart history.
Now, for the first time since early 2025, it is breaking above the key resistance zone that capped every rally attempt.
This is the cleanest, strongest bullish shift the chart has shown all year.
🔍 Technical Overview
Current price: ~$0.095
4EMA cluster: ~$0.05 – $0.03 – $0.02
→ Price is well above all EMAs, indicating strong trend momentum.
Volume has exploded during the breakout phase → clear sign of real demand entering the market.
📊 Market Structure Breakdown
1. Long-term accumulation (March → November)
For nearly nine months, PIPPIN consolidated inside the same horizontal structure:
Support: ~$0.055–0.056
Resistance: ~$0.085–0.095
This range acted as a multi-month compression where volatility became extremely tight and liquidity dried out — the classic precursor to expansion.
2. First serious breakout attempt (mid–November)
Price tested the upper boundary multiple times before finally breaking above it:
Strong impulsive candles
Rising volume
No sharp rejection wicks
This indicates the breakout is driven by genuine buyers rather than a simple liquidity grab.
3. Retest + continuation setup
After touching the breakout zone, PIPPIN pulled back slightly but:
Held perfectly above the blue range
Maintained higher lows
Stayed above the 4EMA stack
This confirms a bullish market structure flip.
Above $0.089–0.095, the chart remains in a full expansion phase.
🧱 Key Levels
Major Support Zones
$0.089–0.095 → breakout zone (must hold)
$0.055–0.056 → bottom of the long-term accumulation
EMAs rising below price → dynamic support on any retrace
As long as PIPPIN stays above $0.089, the trend remains strongly bullish.
Upside Targets / Resistance Ahead
$0.1156 → minor resistance (current area)
$0.1809 → next major structural level
$0.30–0.32 → large historical supply zone (final target of this cycle)
This upper zone has been untouched since January — it’s the ultimate magnet if momentum continues.
🎯 Outlook
PIPPIN has officially transitioned from accumulation → breakout → expansion.
Bullish if:
Price holds above $0.089–0.095
EMAs continue to slope upward
Volume remains elevated on green candles
In this case, the next target is $0.115 → $0.18, with a possible push toward $0.30 later.
Bearish only if:
Price falls back under $0.089
Re-enters the blue range
Loses EMAs support
This would delay the breakout, not invalidate the entire structure.
good trading to all :-)

I don't own enough!I don't own enough of NYSE:ZETA even with my massive 15-20% holding across my investment portfolios and leaps galore.
The fundamentals scream buy anything under $25-$30, while the stock sits at sub-$20.
P/S less than 3, DCF model spitting out massive Margin of Safety based on conservative projections, and they are about to report their first GAAP profitable quarter.
Never mind the chart that looks ready to have a blow-off top moment, friends absolutely.
Cup and Handle is ready to send us to new ATHs in 2026, from the looks of it.
This is a top-2 position for me, and I've personally met and interviewed the CEO, but I have no ties to the business beyond being a retail shareholder.
So take what I say as you may, and always DYOR, friends.
Not Financial Advice.
God bless!

EURUSD: Buying the Dip on Central Bank Divergence⚡ Macro Thesis: Monetary Divergence underway.
Fed (Dovish): Market convinced of a rate cut in December.
ECB (Neutral/Hawkish): Lagarde signals there is no rush to cut further given that service inflation remains sticky. This narrowing of the interest rate spread favors the euro against the dollar in the medium term.
📊 Technical Setup (D1/H4): The pair has broken the psychological resistance of 1.1600. We are looking for a retest of this zone (now support) to enter the trend.
Entry Zone: 1.1620 - 1.1630 (Pullback on former resistance)
Trigger: Level held on H4 with bullish price action.
Stop Loss: 1.1575 (Invalidation of the bullish structure).
Target: 1.1750 (Bullish projection).
⚖️ Risk/Reward: ~1:2.2
Happy trading!
Sic Parvis Magna

GOLD MARKET UPDATEHey Everyone,
As we close out the week, price action on the 1 hour chart continues to consolidate within the defined Goldturn range between 4193 and 4233. The 4193 weighted Goldturn has held as a structural support level, generating the rebound that carried price back into 4233.
Earlier in the week, we observed a cross and lock above 4233, which leaves the 4275 gap unfilled. This upside inefficiency will remain on our radar as long as price holds above the mid range structure.
We will return Sunday with a full multi-timeframe breakdown and detailed trade tracking plan for the upcoming week.
Mr Gold

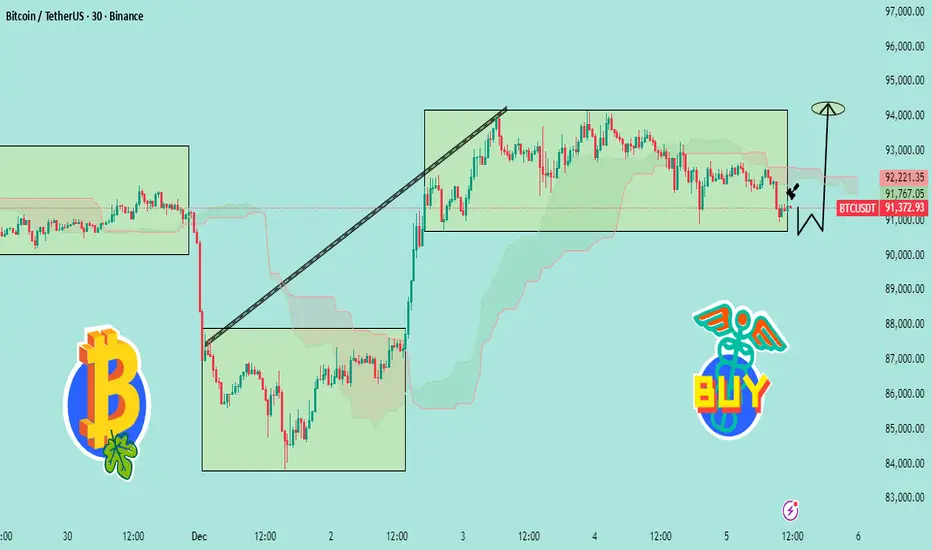
“BTC Bounce From Demand Zone – Targeting 94K Next📊 BTCUSDT Analysis (Based on Your Chart)
1️⃣ Price is Still Respecting the Range
Bitcoin is trading inside a wide consolidation box (around 91,000 – 93,000).
The recent drop tapped the bottom of the range, showing a clean liquidity sweep.
That wick below the box = fake breakdown → bullish signal.
---
2️⃣ Strong Reaction at Demand Zone
The chart shows BTC touching the demand/support zone, followed by a small bullish reaction (the black arrow).
This suggests:
Sellers failed to break lower
Buyers are stepping in exactly where expected
Market preparing for a reversal bounce
---
3️⃣ Expected Move (Your W Pattern Idea)
The drawn “W-shape” indicates a double bottom setup.
If the bottom holds around 91,000, BTC can push back toward:
🎯 Target: 93,500 – 94,000
This matches the upper boundary of the consolidation.
---
4️⃣ Bullish Scenario
If BTC holds above 91,000–91,300:
Reclaim mid-range
Break through resistance
Continue toward 94,000+
This aligns with the “BUY” tag you added.
---
5️⃣ Bearish Invalidations
Bullish idea is invalid if: ❌ Price closes below 90,800 on 30-minute
= fresh breakdown → deeper correction
---
🧠 Summary
BTC swept liquidity at the support → formed a bounce → still inside range → bullish reversal expected toward 94K
SOL in descending channel ready for jump 28% gain toward 170$Hi the support and resistances on the chart are based on the previous data and weekly candlesticks if BINANCE:SOLUSDT holds this last support the potential of 28% gain is logical toward 170$

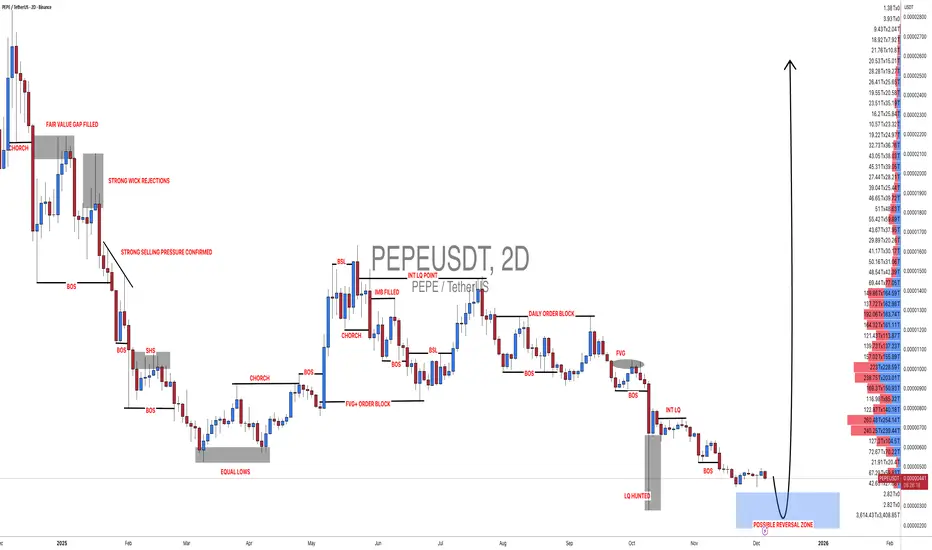
#PEPEUSDT: Big Move Is Coming, Comment Down Your ViewsI hope you are having a good weekend.
Let us focus on the current state of the cryptocurrency market. We have identified a key pattern in the BINANCE:PEPEUSDT which suggests a potential transition from an accumulation phase to a distribution phase.
We recommend waiting for price confirmation such as a break through the straight trend line and subsequent liquidity. Once this is confirmed, we suggest waiting for a price retracement and retesting the area which would serve as the second confirmation.
This is our analysis and not a guaranteed move. Please conduct your own research before making any changes.
Team Setupsfx_
LUNC 0.000057 Holy Cow $500in Volumethis is one of the biggest token this year end
that volume and other versions are getting the best of it
interest is coming back
and strong hands and those who got a lot of this at below 0.00005
should be lucky
good luck guys and this holiday pump is surely
going to be as rewarding as before
hopefully all time high holders at $50 and $100++ will be whole again
at least break only if they averaged down.
NFA not financial advice
just wondring where my $100 go when this hits back to $10 or even just $1.0
goodness pump

GOLD → Consolidation above 4220. Bullish structureFX:XAUUSD is trading in a narrow range around $4,200, maintaining sideways momentum ahead of US inflation data. The market confirms a bullish structure...
The probability of a Fed rate cut in December remains at ≈90%.
Mixed US employment data:
– Jobless claims fell to their lowest level since September 2022.
– Layoffs in November reached a two-year high.
The key benchmark today is the PCE index for September (data delayed due to the government shutdown).
Gold is awaiting new signals on inflation. Range trading is likely until the release of PCE data, which may set the direction of movement ahead of the Fed's decision.
Resistance levels: 4238, 4262
Support levels: 4220, 4183
If the bulls hold their ground above local support at 4220, we will have a chance to break through 4238 and retest 4262. However, a breakout of the trading range resistance could trigger a continuation of the rally towards the ATH.
Best regards, R. Linda!

Short term bullish. Bitcoin is starting December on weaker footing as risk assets wobble and the year-end rally narrative gives way to a market working through heavy volatility. BTC has fallen into the mid-$80,000s after trading above $125,000 in early October, leaving the token roughly 30% off the highs and giving back a large portion of its 2025 outperformance.

Ethereum Hits Demand Zone – Smart Money Reaction Begins1. Major Breakdown Completed
ETH formed a sharp sell-off leg, moving along the long diagonal trendline you drew.
This indicates strong downside momentum that has now reached exhaustion near the bottom zone.
2. Price Tapped a Key Demand Zone
The lower green/grey area marks a high-volume demand block.
ETH reacted strongly from this zone, showing:
A wick rejection
Shift in market structure
Buyers absorbing the remaining liquidity
This confirms the zone is valid.
3. Liquidity Grab at the Lows
That spike below the structure (where you marked the “M-shaped” dip) looks like a classic stop-hunt / liquidity sweep.
After grabbing liquidity, ETH bounced aggressively.
This is usually a sign of smart-money accumulation.
4. Early Trend Reversal Signals
The small bullish rally forming now suggests:
Momentum is shifting
Bears are losing control
ETH might build a new short-term uptrend from this area

BUY OPPORTUNITY IN BTCThis could be a perfect entry if the price respects the support line that match the level of fib offering a good R: R

#AVAXUSDT: Targeting $60 Long Term View! Swing TradeThis crypto pair has a big potential of going back to its previous all time high, in our opinion price should reverse from $9 to $10 that area looks more appealing. We expect a swing volume to kick in the market.
Use accurate risk management while trading cryptocurrency. Like and comment for more.
Team Setupsfx_

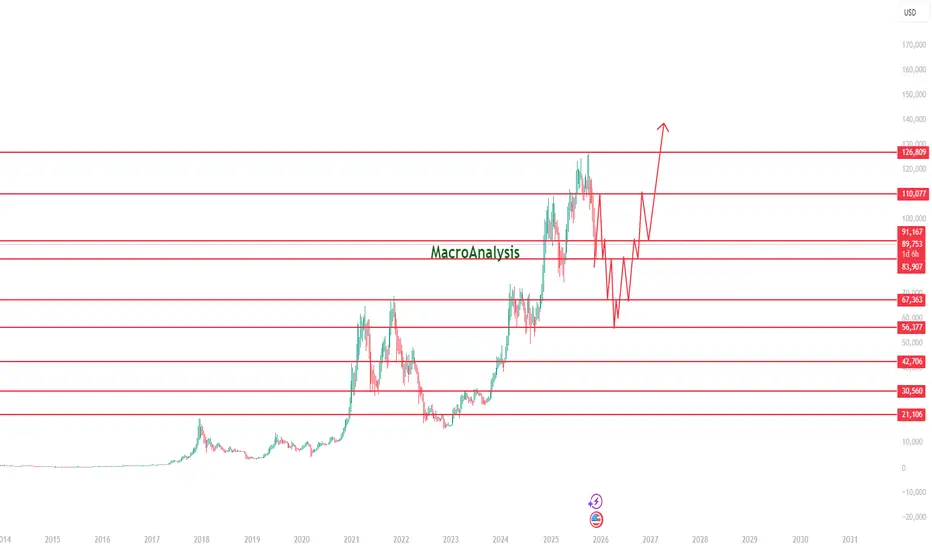
BTC Macro Roadmap: Multi-Year Support/Resistance Structure & ProThis chart presents a long-term BTC roadmap based on major weekly and monthly support/resistance zones, reflecting how BTC typically behaves during mid-cycle phases. Price has recently reacted to the 110K macro resistance, triggering a corrective leg that fits the broader rhythm of previous BTC cycles.
The projected path highlights a realistic multi-stage structure:
• Mid-Cycle Corrective Phase
BTC is forming lower highs and lower lows after the rejection from 110K, with a likely retest of key demand zones between 83K → 67K. Deeper liquidity sweeps into the 56K region remain possible before establishing a macro higher low.
• Accumulation Zone
Inside this lower region, BTC historically creates sideways, choppy movement—sweeping liquidity both directions as market participants reposition. This mirrors prior mid-cycle accumulation phases and sets the foundation for the next macro advance.
• Recovery Phase & Re-Accumulation
Once accumulation stabilizes, structure favors a recovery back toward 91K → 110K, driven by regained momentum and market strength. A successful breakout from this zone signals the beginning of the next expansion wave.
• Macro Expansion Phase
Clearing 110K opens the door toward 126K–140K, the next major macro resistance region and potential cycle extension target.
This idea isn’t a prediction—it’s a structural map, focused on how BTC historically behaves around cycle midpoints: parabolic advance → correction → accumulation → breakout → expansion. The chart emphasizes market memory, key levels, and BTC’s typical volatility during expansion phases.
Macro Levels to Watch:
• 110,077 – major resistance, recent rejection zone
• 91,167 / 89,688 – mid-level pivot controlling short-term direction
• 83,907 – key support that preserves bullish structure
• 67,363 – strong historical demand and liquidity magnet
• 126,809 – next major resistance above ATH
XAUUSD - SELLER MOVE IN The chart shows my view of the next move. Market direction depends on holding this zone.

BTC 75-78K BEFORE CHOCHi thought upcoming news only follow the projection. as we know this Q4 is TLT & bonds allocation zone before the fed printing money on Q1. impact in early Q2

BTC 1H LIQUIDITY CYCLE MODEL SELL SETUP LOADINGBitcoin has completed a clean downside impulse and is now trading inside a corrective structure that fits perfectly into my Liquidity Cycle Model (LCM).
Here’s the breakdown:
🔹 1. Impulse Down — Confirmed
Strong bearish displacement created the foundation for LCM Phase 1. Sellers are clearly active on the HTF.
🔹 2. Correction Into Supply — Confirmed
Price has retraced into a multi-layered supply zone, aligning with:
• 90,666
• 91,069
• 92,202
• 92,305
These levels represent inefficiencies + old liquidity, making this the ideal correction zone.
🔹 3. Liquidity Sweep — Developing
Price has started reacting inside the zone, but the clean sweep of remaining liquidity (91.0–92.3 region) may still happen.
If we get that final sweep → I expect a strong bearish reaction.
🔹 4. Reversal Trigger — Waiting
I need a decisive BOS (Break of Structure) down on LTF to confirm the reversal.
Until BOS prints, this remains a potential LCM sell, not an active one.
🔹 5. Sell Continuation — After BOS
If reversal confirms:
• First continuation zone: 90,218
• Break zone: 89,467
• Major inefficiency target: 82,292
The downside potential is huge if sellers fully take over.
✅ My Bias:
Bearish, but only after a clean BOS.
The model is forming beautifully — sweep the highs, break structure, and the continuation sell becomes high probability.
🧠 LCM Logic
Impulse → Correction → Liquidity Sweep → Reversal → Continuation
BTC is currently between Correction and Sweep, preparing for the Reversal → Sell leg.
⚠️ Key Note:
No confirmation = no entry.
Let price show its hand. LCM rewards patience, not prediction.
