Volatility Trading With The Composite Leading IndicatorThe composite leading indicator is produced by the OECD.
It is an index of components that pertain to each country and is considered a leading indicator of near-future economic performance.
The components for the CLI are:
Component Series (Unit) Source
Work started for dwellings sa (number)
Net new orders - durable goods sa (USD)
Share prices: NYSE composite (2015=100)
Consumer - Confidence indicator sa (normal = 100)
Weekly hours worked: manufacturing sa (hours)
Manufacturing - Industrial confidence indicator (% balance)
Spread of interest rates (% p.a.)
In this piece, we will look specifically at the CLI for the USA. However, I think it will work for most countries ultimately.
I consider you can use the CLI to accurately forecast slowdowns and volatility in US markets and sometimes outright recessions and crashes.
I have overlaid the CLI (the blue waves) with US recessions (red blocks) and added a 20 month SMA to it.
I have also added in dotted orange bands points where CLI takes out its own MA and moves below it which I consider being a "buy vol" signal.
To be clear, these dotted bands are not necessarily recessions , just slowdowns denoted by the composite leading indicator/MA tool. This does not mean however that they are not potentially good volatility trades (as we shall see).
We can see that out of 14 slowdowns and economic recessions. The CLI/MA has a very good success rate if we view it as a "buy" indicator for the VIX .
The buy points denoted by the orange dotted bands are:
1st May 1993
Was followed by a small VIX spike in 1994. A small win could have been achieved by buying vix at $12 and selling for $19 one month later returning over 50%.
21st December 1994
A longer-term hold. Buy signal triggered at around $12.50 and a hold would have been necessary. The positions started generating serious returns in 1996 and maxed out at around $32 in 1997 returning over 150% over 2 years.
1st May 1998
Buy signal was generated at around the $20 mark. This would have returned 100% gains just 3 months later during the VIX spike to over $43.
1st June 2000
Buy signal generated at the $21 mark. This was shortly before the dotcom bubble burst and this would have been a 1.5 year hold generating around 50% return when closed at the onset of the dotcom crisis or could have been held for a return above 90% in 2001 or well over 100% in 2002.
1st March 2002
An interesting dip on the VIX was called by the indicator here. Not sure if just a coincidence or not but it does look suspiciously neat-and-tidy. This triggered at $17.97 and then returned over 100% just a few months later in September of the same year equating to a 5-month hodl.
- 1st Feb 2005
Peak of the post-2000 credit cycle. This trade was a hold. Indicator triggered at 12.01 and the best selling position was 2 years later in July 2007. Returning just under 100% or could have been held to generate bigger returns when the credit crunch kicked in during 2007 and the primary crash occurred during 2008.
1st November 2007
This is obviously the peak of the market for the housing bubble bull-run. The indicator triggered at $20.15 and the ensuing VIX spike maxed out at around $58 returning nearly 300% if the trade was closed one year later.
1st June 2011
A very close to the edge trade which triggered during the double-dip recession in the Eurozone. This is one of the less-good entries with a price of around $25. However, it is very very short term with VIX peaking at $42 over just a few months returning over 75%.
1st March 2015
The indicator triggers on around 1st of March of this year at around the $14 mark and is another medium-term trade with vix peaking at 28 just a matter of months later returning just under 100% as the onset of the Brexit/US Trade War grips market.
1st August 2018
Jitters are evident in CLI as far back as 2018 when the indicator fired and returned a buy price of £13.04. This could have been held for a short-term trade turning over 70% within a matter of months or held longer until the COVID pandemic in 2020 which I consider to have been one of the root causes for the VIX becoming elevated during this time. The longer-term hold would have returned over 400%.
As such, you can see that the crossovers between the CLI signal and the MA on a monthly chart usually preceded volatility bull markets, very serious short-term vix spikes and sometimes even outright recessions.
There are a couple of points to bear in mind here.
Signals sometimes appear up to a year before the "event". That's the whole purpose of this indicator. So in other words, you may have to be prepared to hold. As such, ETF decay which is inherent to instruments like UVXY must be factored in. This strategy is therefore more suited to de facto VIX rather than any of it's leveraged ETF variants.
There are a couple of so-called "false positives" with respect to this indicator calling an "event" very far ahead. For instance, in 2005 it gave a "buy signal" for volatility. This isn't necessarily "wrong" per se, because face it, you'd have been dumping your equities and taking on vol nearly at the very top of the market here. As such there is SOMETIMES ample opportunity to "buy n hold n accumulate". That's another reason why leveraged volatility may not always be suitable per se due to the fact of leveraged ETF decay.
On the other hand, there are some short-term opportunities here which are denominated in terms of only months . Leveraged products may be more suited to these.
I believe that we must exercise judgement if we are to implement this strategy and to judge the relative position of our entries relative to the market when choosing what instruments to employ to benefit from volatility spikes.
I believe this does demonstrate the validity of using CLI and other macroeconomic indicators for volatility investing.
VXX

VIX - Daily Range for Continuous ContractGiven the VX Complex has asserted a Positive Weekly Trend for the First
time since the Roswell Crash (4/5 LT Structure) - the ST Structure indicates
more to come for IT 4/5.
________________________________________________________________
% Contango
M1 @ 3.66%
M2 @ 1.74%
M3 @ 0.78%
M4 @ 0.12%
M5 @ 1.51%
M6 @ -0.38%
M7 @ 0.57%
_________________________________________________________________
As long as the 50 SMA is holding on both the Daily, but far more importantly
on the Hourly - the VXG has game into ROll/Settle.
New highs should remain the Trade into March.
__________________________________________________________________
VVIX has performed extremely well for VX Leading Indications.

VIX - VXG Daily 2021 Weekly Trend extends to 2022That TRend is Higher into March.
How it unfolds, is a matter of interest to everyone with Skin
in the Game at the Flamingo.
Given VX Crush Friday is here, we see how the day unfolds.
______________________________________________________
It is usually after the EU Session closes the VX COmplex assault begins
and accelerates into the Close.
Yields will wreck the MArkets again as ZN appears to be heading to
new lows.
It will be extremely VOLATILE into March with wild swings in both directions.
______________________________________________________
VVIX has been a great leading Indicator.

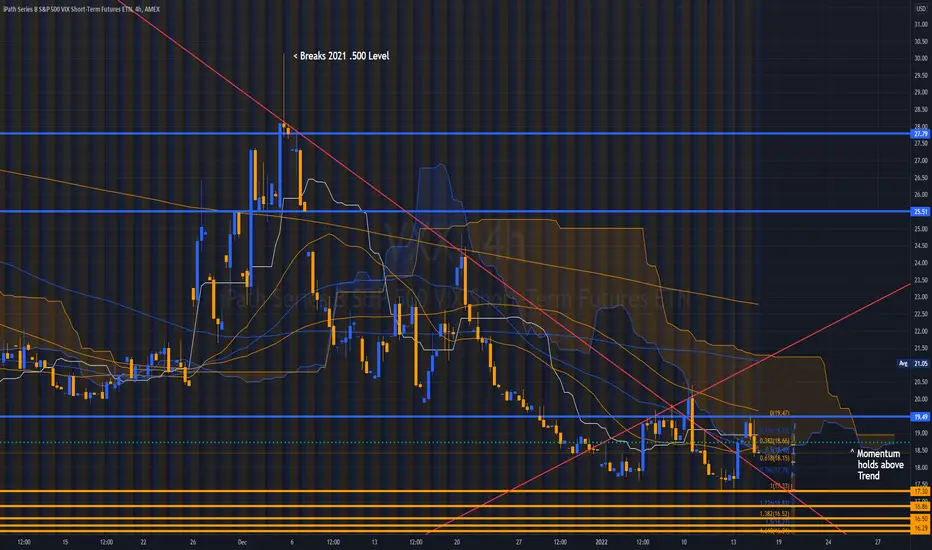
VIX - The Real Underlying StoryAfter spending all of 2021 in a Weekly Downtrend.
The VX COmplex did something worthy of note.
It broke the .500% of the Downtrend, it then made
a Weekly reversal for the entire Downtrend.
________________________________________________
This implies after the Index Counttertrend completes,
Higher Highs are ahead.

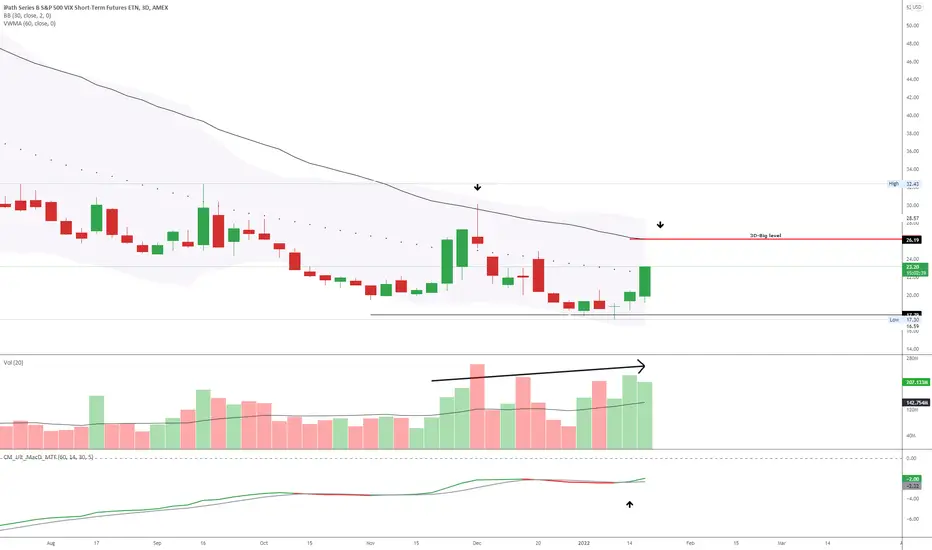
VXX - Key level is next
3D VWMA (60) has been tested only once since Sept 01, 2020 and it retraced on Dec 02, 2021 (market with arrow)
Negative divergence on the price.
All suggest months of pain ahead - UNLESS it is rejected and they keep smashing VXX below 26.
VXX - Arb Low into New ATL's for 2022 @ 17.30We are buyers of the Implied Lower Targets.
VXX is our preferred Instrument as it is the 30 Day Constant Maturity.
Trade Plan Buys on Inverse Ladder:
18.45
18.01
17.55
17.3
16.58
16.14
15.78
15.42
We'll hold our nose for:
25.24
27.41
28.87
30.05
31.23
32.69
35.06
VXX - 4 Hour / 17.55 LostRetest Lows and fail appears to be in trade into Friday.
VX Complex is being taken to the Woodshed again.
No reason to Buy, no real reason to Sell.
________________________________________________
Meandering.
Wandering.
_________________________________________________
Low to Low Draws is becoming a horror show.

VXX Bearish inclined Naked Calls 7 Jan Expiry (Jan Track 1)Whats The Plan/Trade/Thought
I entered the trade because the volatility was high and the premium was good. But because of this I did not do the Mindfulness exercise before entering and broke my rule. This being a Call was a more bullish take on a market that at the moment felt like it was bearish ranging.
However I entered because the Strike was 60.34% away and had good premium. Also the 3 Dec showed a solid rejection from the S/R line at 28.5. I expect the situation to stabilise or slow down after both Omicron and Fed Interest rate situations
I Feel
I’m doing this after the fact. So looking at the recent market drop on the 20 Dec I feel less confident. But I am comforted that this trade will end fairly quickly on the 7 Jan.
Imagine Yourself Taking The Other Side
All of my other trades for the month of Jan will be bearish. And as such I do feel somewhat anxious. Which is not right.
Imagine Yourself As A Neutral Observer
I rushed this and I am not confident
Look For New Information
Omicron infections are rising at an exponential speed and this will result in knee jerk reactions. But this might already be priced in.
How Do I Feel Now
Hoping for the best and I don’t like it. I must not do this rash trading again. No matter how good the premium looks
Trade Specs
Sold 90 Calls @ 0.81 - Strike 35
% to Strike 60.34%
ATR % is 100%
BP used 78k
Max Gain: est $7290

UVXY (VIX) pattern implies risk on until mid-JanuaryHere is a pattern that I noticed in UVXY over the last year. The red trendline has been very consistent as a time for UVXY to change directions. If it holds, then the market is moving back into rally mode and we should not expect to see another pull back until mid-January.

VXX - Bares ObservationAfter a one tick front tun of our PO @ 17.55,
signs are growing positive.
The ES remains in Distro - it is mild, but has
the potential to expand as NQ BANK / Financials
have filled their Gaps.
We should VX begin to perk up in January, there
remain far Larger VIX targets for VXF to the 15.25s.
_______________________________________________
We'll be buying when this begins to perform and hold the
lows. For now, we patiently await a better structure.

VXN - 4 Hour / Elon'dCould not happen to a better gauge of Fear and complacency - the
trusty VXN... senseless comes to mind as the NQ began the 1:30 PM EST
Jumbalaya in the Fire.
Another persistent AGLO Monday with the usual suspects in Prop.
As the VXX began to implode again, the Bod came into the Indies.
Pressure remains out in Time for today and tomorrow, with the attendant
Distributions.
Simply a crushing blow to Volatility while New HIghs remains elusive.
_________________________________________________________________
A bad sign for the Equity Complex as there is only so much the VX Vigilantes
will absorb.
It will be interesting to see if the Larger Daily Price Objective to which the ALGOs
are attached, relent and reverse.

VXX - Arb Low into New ATL'sNot ready for Prime Time, but then with Lower Objectives below
and Daily Lows day after day with lower Yearly Lows...
It is beginning to look as if the VFX could trade into the 15s at this
rate - currently 19.05.
Volatility continues to be beaten with the Ugly Stick.
___________________________________________________________
There has not been a Retacement exceeding the .382 in 10 days with
1 and only 1 exception.
A new streak for the VX complex.
The Fed's mercurial puncture wounds continue to press and with CASH @ 17.15
and 15's in sight, one wonders how off base this will trade given the enormous
Risk profile Globally.

VX - M1/V1 : M2/V2 DailyThe VIX Guy, 50 Cents isn't present.
Implied VX is SKY HIGH.
__________________________________
The Illusion continues to Live.
A great many are going to pay the Price for
being dead-ass wrong.
__________________________________
I'm going to be as Subjective as the mood suits today.
QE Breeds Instability
Conditions under QE - the substantive change may actually
be relatively minor, but this is irrelevant to speculators and
Degenerate Gamblers at the Flamingo Sports Book.
The reason, simple: Speculators with assets in the Bag with
longer maturities will take larger capital losses with relatively
small changes in interest rates under prevailing Confidence.
Projecting my inner monologue is something I attempt to
avoid on balance - Shake Rattle and Roll on FOMC minutes
is how I'm setting up for a Deline.
______________________________________
Something very serious is about to happen, can't shake it.
We will be SELLERs, win lose or draw. Scalps the Micro Ranges
with a SKEW at extremes.
There you have it... Alex and I are Salmon Fishing.
Have a great rest of the Weekend.
Happy Hunting - Hunter Killer

VXX Bearish inclined Naked Calls 26 Nov Expiry (Nov Track 1)Whats The Plan/Trade/Thought
Market Bullish Stance
The overall market seems to be back on it's bull run. This is reflected on the SPY and NDX who have both made new highs
Sep Consumer Spending has lost momentum but still grew at 1.4%
Sep Personal income was up 0.9%
These factors, including the upcoming festive year end period. With less COVID19 restrictions should result in an increase in consumer spending with an appitite to accept raising prices (At least for this quarter)
Est price to strike is around 54% which is a pretty good buffer and is around it's previous high. This is shielded by an S&R line at 28.5
I Feel
Confident and safe
I'm happy with the risk profile and it is also 50% hedging my RVLV trade
Imagine Yourself Taking The Other Side
We could be at the bottom and a retracement is a possibility at least short term
We expected Nov's market to be bearish volatile so this bullishness might be short term
Imagine Yourself As A Neutral Observer
Strike to price distance seems safe
If we read the market for what it is now. It is bullish
While some volatility might come as we close Dec due to the US debt ceiling
Look For New Information
US debt ceiling implications and the upcoming review date on the 3 Dec will cause some market volatility. For now while the country has a short reprieve from the threat of default, Yellen said some investments in funds through December 3 will remain suspended
How Do I Feel Now
Ready to enter!
Trade Specs
Sold 70 Calls @ 0.40 - Strike 30
% to Strike 46%
ATR % is Around 12%
BP used 65k
Max Gain: est $2800

VXX - Interesting VX ParticipationNothing to see here and that may well be the indication.
Implied Volatility is unhinged:
FEB 18 2022 CALL
17.00 - 75.59%
18.00 - 84.90%
19.00 - 92.54%
20.00 - 99.91%
21.00 - 107.26%
22.00 - 112.79%
23.00 - 117.91%
24.00 - 123.21%
25.00 - 128.10%
26.00 - 131.70%
27.00 - 135.50%
______________________________________________________
Clearly, the VXX believes the market has outsized potential for
large price swing.
With the Prems High, the underlying will be the better Position.
Gap Below, Gaps Above for VXX.

VXX - Nuked / Larger Daily EXT to 17.55UGLY
NASTY
CRUSHED VX
CASH / SPOT SMOKED
VXF SMOKED
CURVE SMOKED
______________________________________________________
They will accumulate FEB / MAR.
JAN 20.15
FEB 22.25
MAR 23.63
APR 24.76
Objective for 30 Day CM @ 17.15 - And I'm struggling to believe that Price Objective.

VIX - Daily: VXZ / VXF / VIX Spot-CashThe NQ will have the wider swings into Year-End
as the Range has expanded from 150616 to 16302.
The VIX may range into Year-End permitting the ES
to build out the Symmetry.
The NYSE Remains collared at the Lower end of the
Range.
VX has been compressing into Year-End.
Wednesday will confirm as 96% of m1 is loaded
on the CM-30 VXX.
____________________________________________
Implied Targets for VXX 35.16 to 45.36 on reversal.
This implies a large and very extended decline.
Donside Momentum is building, how long can they
keep this collared... we' will see.
I maintain we will test the Dialy 377 SMAs for the ES NQ YM RTY.
It will be a 5/5 decline or should be... the Algos have been very good
at breaking Candles, FIBs, and Symmetry - Far too many False moves.
There are a very Large Number of Sellers overhead for the Equity
Complex.
VX should be relieved of the foot on its throat into the new year.

VXF - 1 HourOver 23.60 and the VIX remains in a Bid and a Long.
It has become far less technical than the Indexes.
Roll to settle is creating an Arbitrage which is suppressing
the VXZ VXF VXX.
VX Complex collared by the Operators.
VXF continues to struggle at Cloud Momentum.
______________________________________________
4X Expiry and enormous Ranges on each Index.
Price is moving into the Lower end of the October Range.
DX Weakness may provide the sport for the Equity Complex
to produce a Counter-Trend off their Lows.
_________________________________________________
We closed :
NQ @ 735
ES @ 635
CASH @ 100%

VXX - Trending Cloud FailureAfter early Entry failed, SOH became the operation.
Unable to Push through the Trending Cloud proved to
be the warning sign.
It was correct, and we were frankly lucky to have
done nothing as it was difficult.
______________________________________________
Patience won that round as it wins about every round.
I can't imagine the misery there, as the 120 Minute reversal
was surreal in nature, an 11.5% Nike Whoosh Buzzsaw.
A full retracement is underway.
Volatility was crushed, beaten with the Ugly Stick as
the Raven went full Edgar Allen.

VXX - Abandoned Ship2.14 P/C at present which should peak near 2.24.
Many Traders believe the FED will Punt.
We do not.
The VIX itself, being left for dead during a rollover.
Meanwhile, CALLs are selling at 354% to 427% prem
to PUTs.
____________________________________________
INdices are rallying, as they do ahead of the FED.
Money Flows are positive into Equities, into Protection
we are back to extremely negative.
Captial continues to Slosh around while Executives at
the 7 continue to Sell Shares - MSFT is a solid example
where One ETM sold 50% of their shares.
_____________________________________________
The Weekly Charts remain our point of reference for
rejection, were it to expand the Channel, then it is an
entirely different conversation.
An over-throw is possible.
______________________________________________
As Divergences continue to build on the Larger TFs
we will Observe the Weekly UTL.
_____________________________________________
What is fragile does not prefer disorder or random.
It seeks stability and predictability. The fragile is
damaged by infrequent events.
In particular, when they become increasingly frequent.
INcreasing Amplitudes within increasing Frequency, are
a warning.
Events Unknown, unseen, unaccounted...

The "VIX"The Vix has reached the 61% target retracement. On the 1 hour timeframe, a new low has been made even with the previous high being broken. The 15 min looks the same. We could be running out of gas soon. However, let's see if the 88% retracement is the next level! We are fighting the 200 ema right now. Let's hope for a push down to around $16. Since July, price seems to like this area. This would be an 88% retracement and would be bullish for the market! I want the Santa Rally!

The "VXX"Since July, the VXX has reached the 200 ema (purple) 3 times. It has retraced the previous low each of these 3 times. The VXX retracing towards $23.43 would be a 61% retracement. We are also at a point of control on the volume profile.

potential VIX spike by end of yearWith RSI bottoming and the VIX finding a floor around 14.91, it looks like it might have one last spike left in the tank for the year 2021.
MACD is curling up towards a cross.
Potential ways to play it are through VXX or UVXY if you want some leverage.
