Natural Gas consolidates nearby support level of 3.0000Natural Gas consolidates nearby support level of 3.0000
U.S. Natural Gas has been declining since mid-June, forming the bullish wedge. Since the end of July 4-h RSI shows us bullish divergence, the price consolidates nearby the 3.0000 support level. The price is expected to rise towards 3.4000 level as a first target with 3.6000 as a final target. Additionally, according to seasonals, since the second half of the august, natural gas prices go bullish due to the beginning of the shoulder season, which may be an extra support factor for the asset.
Wedge

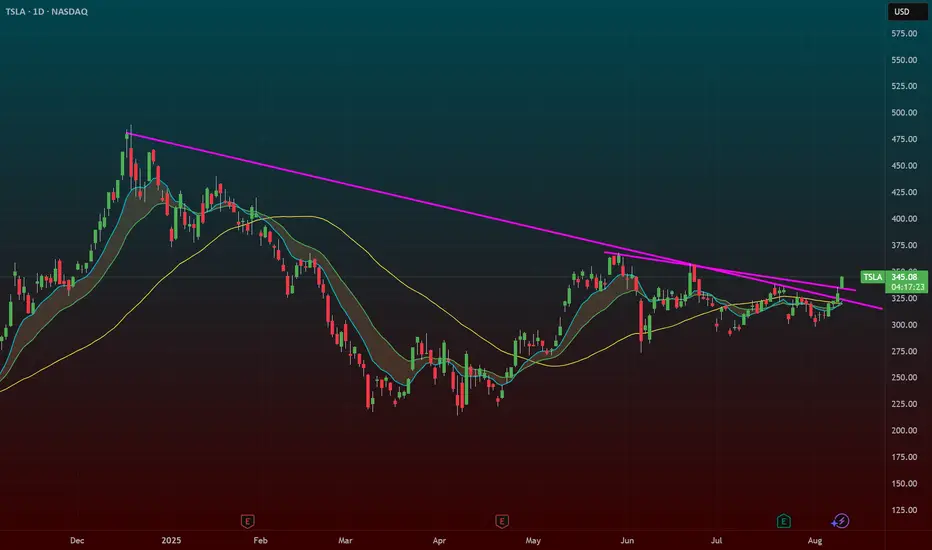
$TSLA – Wedge Breakout with Rotation PotentialNASDAQ:TSLA – Breaking Out of a Big Wedge After Earnings Reversal
Tesla ( NASDAQ:TSLA ) just broke its wedge pattern after a strong post-earnings recovery, and the price action says a lot about where sentiment is shifting.
🔹 Earnings Flush → Strong Absorption
Earnings reaction was ugly — big gap down and heavy selling.
Since then, NASDAQ:TSLA has been shrugging off negative news — sales data, guidance cuts, analyst downgrades — all absorbed without breaking down.
This tells me buyers are quietly accumulating.
🔹 Rotation Narrative
The rest of the Mag 7 has been ripping for months.
NASDAQ:TSLA is the laggard — and now traders are rotating into the one big name that hasn’t moved yet.
If it holds here, the upside could be sharp.
🔹 My Trade Plan:
1️⃣ Starter Long: Took an entry on the wedge trendline break.
2️⃣ Why Not Full Size Yet? This is day 4 of the move — in my playbook, that’s a starter size only.
3️⃣ Add Trigger: If we get an inside day or small dip that holds above the 9 EMA, I’ll add the rest of the position.
4️⃣ Stop: Under the wedge breakout level for now.
Why I Like This Setup:
Wedge break + rotation narrative + strong news absorption.
Market psychology turning — when a stock stops going down on bad news, it’s often about to go up.
Starter now, add on the dip = structured risk.
AUDCAD: Pullback From Resistance 🇦🇺🇨🇦
AUDCAD may retrace from the underlined blue resistance.
A breakout of a support line of a rising wedge pattern
after its test leaves a strong bearish clue.
We can expect a pullback to 0.8962 level.
❤️Please, support my work with like, thank you!❤️
I am part of Trade Nation's Influencer program and receive a monthly fee for using their TradingView charts in my analysis.

BTC Dominance Breakdown – Altseason 2025 Loading? The BTC Dominance chart is flashing a familiar pattern we last saw before the explosive 2021 Altseason — and history might be about to rhyme. Let’s break it down:
BTC Dominance has once again tapped the same multi-year resistance trendline (red line).
Price has been riding a rising wedge since early 2022 — a pattern that typically resolves to the downside.
Last week, dominance rejected from the resistance zone and broke below wedge support.
Key Technicals:
Resistance Trendline: Serving as a multi-year ceiling since 2019.
Support Trendline: Rising wedge support now broken, opening the door for a deeper decline.
Current Level: 60.81% — sitting right below the breakdown zone.
What This Means for the Market:
If dominance continues to fall, altcoins could see significant capital inflows.
A sustained drop could trigger an Altseason 2.0, with high-beta alts outperforming BTC.
Watch for BTC to consolidate or move sideways — this typically accelerates altcoin gains.
Confirmation & Invalidations:
✅ Bullish for alts if:
Dominance closes weekly candles below 60%.
Momentum builds to retest lower dominance support levels (50%-55%).
❌ Invalidation:
A reclaim of wedge support + breakout above 67% would kill the altseason narrative in the short term.
📌 Conclusion:
BTC Dominance is at a critical turning point. History suggests we could be on the verge of a powerful altcoin cycle if the breakdown sustains.
Patience and positioning are key — the biggest alt rallies start when most traders are still skeptical.
💬 What do you think — are we about to witness Altseason 2025? Drop your thoughts below.

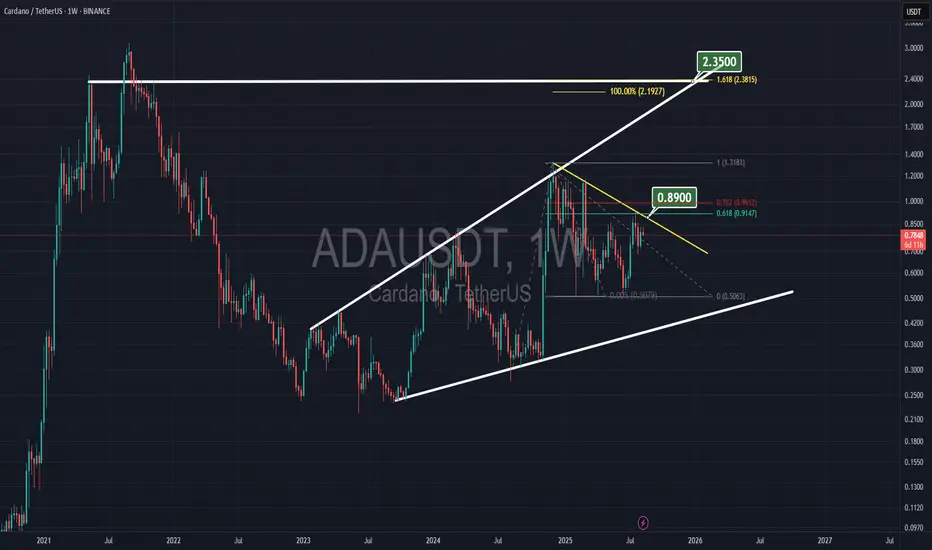
ADA to $2.40Cardano is within a broadening wedge, with a top of $2.35 in October 2025. The 100% Fibonacci level is at $2.20, and the all-time high is around $2.40, creating multiple resistances between $2.20 and $2.40.
SELL GBPUSDWe see the formation of a giant Falling Wedge,.. Lets take profit as price goes into the pattern,.. Good day

EURNZD: Bullish Continuation Confirmed?! 🇪🇺🇳🇿
EURNZD leaves several bullish clues after a test of an
underlined intraday horizontal support.
First, the price violated a support line of a falling wedge pattern.
A confirmed bullish Change of Character CHoCH was formed then.
I expect more growth now.
Next resistance is 1.965
❤️Please, support my work with like, thank you!❤️
I am part of Trade Nation's Influencer program and receive a monthly fee for using their TradingView charts in my analysis.

Bullish Energy in Natural Gas: -DMI Extreme + Wedge BreakoutThe Spark in the Gas Market
Natural gas has been quietly simmering in recent weeks, building pressure beneath a surface of consolidation. Traders watching closely will have noticed a rare alignment — one that history shows can potentially precede outsized moves. We’re talking about the convergence of two powerful signals: a -DMI yearly extreme and a falling wedge breakout.
In the past, this combination has marked moments when bearish momentum had run its course, giving way to swift and decisive bullish reversals. Now, that same alignment is flashing again, inviting a closer look at the technical landscape and the potential opportunities it presents.
Why This Setup Matters
The -DMI (Directional Movement Index) measures the strength of downward price moves. When it pushes beyond two standard deviations above its yearly linear regression channel, it signals an overextended bearish phase. Historically, these extremes have often coincided with market bottoms in Natural Gas Futures.
Layer on top a falling wedge — a bullish reversal chart pattern — and the probability of an upside move gains weight. The wedge compresses price action into a narrowing range, reflecting reduced volatility and setting the stage for a potential explosive breakout once resistance gives way. The current breakout level sits near 3.18, with technical projections aligning closely to a well-defined UFO resistance (UnFilled Orders) zone around 3.90.
The Technical Story Unfolds
Looking at the daily chart in the present, the -DMI has recently breached the +2 standard deviation boundary of its 252-period regression channel — a rare occurrence that, as said, has preceded multiple major bullish reversals in the past year. When this condition appeared, downside momentum often faded, making room for buyers to take control.
This time, the current signal aligns with a falling wedge that has been developing for weeks. Price is about to break above the wedge’s upper boundary at approximately 3.18, suggesting a potential trend reversal.
The Trade Blueprint
Direction: Long
Entry: 3.18 (confirmed breakout above wedge resistance)
Target: 3.90 (wedge projection + UFO resistance)
Stop Loss: 2.858 (below wedge and technical support floor)
Reward-to-Risk Ratio: ~2+ to 1
This structure allows traders to define risk tightly while targeting a meaningful upside move. The setup applies equally to both Natural Gas Futures (NG) and Micro Natural Gas Futures (MNG), offering flexibility in capital allocation. For smaller accounts or those wanting to reduce margin exposure, the MNG contract delivers the same tick size precision with only one-quarter of the notional value.
The Contract Advantage
Natural Gas Futures (NG) represent 10,000 MMBtu per contract, with a minimum tick size of 0.00025 — equivalent to $2.50 per tick.
Micro Natural Gas Futures (MNG) are one-tenth the size at 1,000 MMBtu per contract, with the same 0.00025 tick size equaling $0.25 per tick.
Margin requirements vary with volatility and exchange adjustments, but at the time of writing, the CME lists initial margin for NG in the range of $3,500 per contract, while MNG margins are proportionally lower at $350 per contract. This creates flexibility for traders to scale positions or manage risk without altering the technical logic of the trade. Both contracts trade nearly 24 hours per day, Sunday through Friday, offering the ability to react to global energy market shifts in real time.
Risk Management as the Safety Valve
Defining risk is the cornerstone of any trade plan. The stop loss at 2.858 is not arbitrary — it sits below both the wedge’s lower boundary and a nearby technical support level. If price were to close below this level, it would undermine the bullish thesis and call for an exit.
Using smaller MNG contracts can help align risk with account size, allowing for partial position scaling and better drawdown control. Equally important is avoiding undefined risk scenarios, particularly in a commodity as volatile as natural gas. Precision in both entries and exits reduces exposure to intraday whipsaws while maintaining the trade’s structural integrity.
Closing the Loop
The natural gas market has aligned a rare set of conditions — a -DMI yearly extreme and a falling wedge breakout — each of which has historically preceded significant upside moves on their own. Together, they offer a compelling technical case for a defined, risk-managed long position targeting the 3.90 zone.
While no setup guarantees success, this one seems to offer clarity: a well-defined entry, stop, and target, supported by historical probability and pattern structure. In volatile markets, those moments of clarity are worth paying attention to — and acting on with discipline, and always depending on the trader’s trading plan.
When charting futures, the data provided could be delayed. Traders working with the ticker symbols discussed in this idea may prefer to use CME Group real-time data plan on TradingView: www.tradingview.com - This consideration is particularly important for shorter-term traders, whereas it may be less critical for those focused on longer-term trading strategies.
General Disclaimer:
The trade ideas presented herein are solely for illustrative purposes forming a part of a case study intended to demonstrate key principles in risk management within the context of the specific market scenarios discussed. These ideas are not to be interpreted as investment recommendations or financial advice. They do not endorse or promote any specific trading strategies, financial products, or services. The information provided is based on data believed to be reliable; however, its accuracy or completeness cannot be guaranteed. Trading in financial markets involves risks, including the potential loss of principal. Each individual should conduct their own research and consult with professional financial advisors before making any investment decisions. The author or publisher of this content bears no responsibility for any actions taken based on the information provided or for any resultant financial or other losses.

BTCUSD weekend analysisTechnical analysis of BTCUSD from November 2022 low, Coinbase exchange.
This Elliott Wave count has BTCUSD in ending diagonal wave (5) of ((5)) with wedge formation, (4) of ((5)) overlapping (1) of ((5)), and (5) of ((5)) ending above 123231.07 but below 136909.74. Risk/reward favors bears as price gets closer to 136909.74. Count invalid above 136909.74.

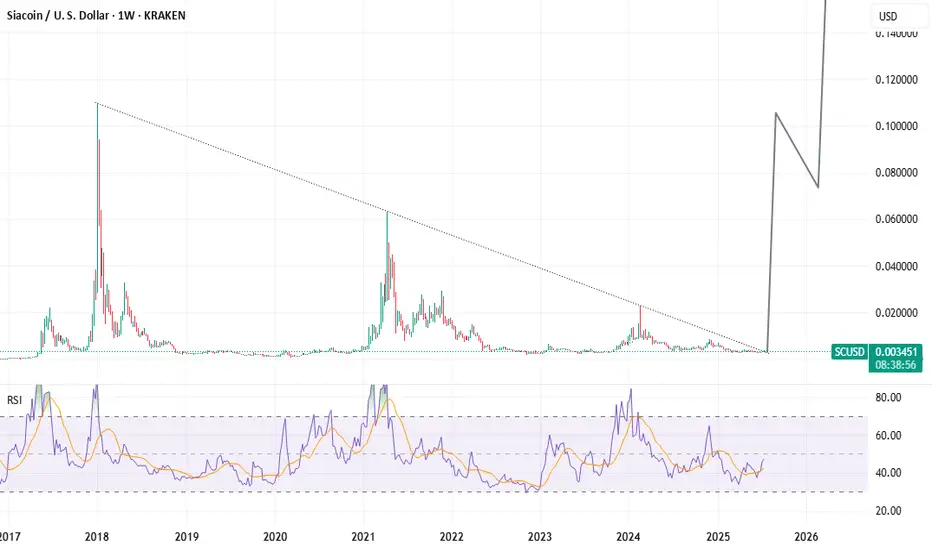
8-Year Breakout Confirmed! SIACOIN Hardfork Activated!Breaking out from a near-identical structure to XRP’s Q3 2024 move, Siacoin (SC) is poised to moon.
Once a top 20 crypto, SC has just closed outside an 8-year falling wedge on the weekly—marking the end of nearly a decade of compression.
But this isn’t just a pattern breakout—it coincides with the biggest technical overhaul in Sia’s history, rolled out on the 10-year anniversary of the token’s launch. Some of the new features:
- Full protocol overhaul — complete rewrite in Go (from siad to hostd/renterd)
- Faster performance — significantly improved upload/download speeds
- Modular architecture — easier dev integration, plug-and-play infrastructure
- Efficient storage contracts — new ephemeral account system for faster payments
- Lower gas costs — more cost-effective microtransactions for storage users
- Better redundancy & reliability — improved renter-host coordination
- Stronger developer tools — RESTful APIs + CLI tools for building on Sia
V2 basically turned Sia from a clunky decentralized Dropbox into a scalable, developer-friendly Web3 storage protocol, just in time for the AI + data sovereignty wave.
Still buried in market cap rankings, SC has the potential to quietly reclaim a top 30 spot as the world rediscovers decentralized storage. This isn’t a meme coin—it’s a battle-tested, utility-rich project with real infrastructure, real adoption potential, and serious upside.
#Siacoin #SC #Sia
XAU/USD – Rising Wedge Near Supply – Possible PullbackTimeframe: 1H | Broker: OANDA
Gold is trading inside a rising wedge after rallying from the $3,345–$3,355 demand zone. Price is now testing the upper wedge boundary near a supply zone at $3,405–$3,410.
Key Points
Multiple CHoCH & BOS show mixed sentiment; latest BOS hints at seller pressure.
Volume spikes on down moves indicate active selling at $3,400.
Demand zones below: $3,375–$3,365 and $3,355–$3,345.
Scenarios
Bearish (Favored): Rejection from $3,400–$3,410 could trigger a drop.
Targets:
$3,375 (first liquidity zone)
$3,355 (equilibrium zone)
$3,324 (major support)
Bullish: Break & retest above $3,410 → Targets $3,425–$3,440.
Plan
Short on wedge rejection or breakdown; SL above $3,415.
Long only if breakout holds above $3,410.

GBPUSD Rally at Potential Turning Point :Is a Reversal Imminent?the pound has been making lower highs and lows on the daily chart, signaling a bearish trend. now hitting a key zone where the trendline and a FVG align, it could be set for a reversal and drop back to the bullish OB below

GOLD → A stalemate situation - a bullish wedgeFX:XAUUSD is unable to break through the resistance level of 3400. However, an ambiguous “bullish wedge” pattern is forming on the chart...
The price of gold retreated from a two-week high on profit-taking. The correction intensified after the US imposed tariffs on imports of gold bars (1 kg), which could disrupt supplies from Switzerland and London.
Key supporting factors: Escalation of trade conflicts, concerns about the US economy and pressure on the Fed, questions about the Fed's independence after Trump's appointments
Risks: Short-term volatility ahead of US CPI data next week. However, fundamental drivers remain bullish.
Support levels: 3390, 3350
Resistance levels: 3405, 3435
The problem with the bullish wedge pattern is that it forms an ambiguous figure. We have an upward movement, but the pattern could easily reverse the local upward trend due to the fairly difficult resistance zone of 3390-3410.
If gold manages to consolidate above 3405, this will increase the chances of growth to 3435-3500.
BUT! There is a fairly high chance that the 3390 support level could be broken. In this case, the market could fall to 3350 before rising...
Best regards, R. Linda!

Ethereum breakoutEthereum monthly chart shows a clear breakout above the 3800 resistance, targeting 8k.

EUR/USD Breaking Point! ALERT Price action is coiling up in a tight triangle and a breakout is imminent! See how the ABCDE pattern on the chart is setting up for a potential explosive move. Will EUR/USD surge higher or drop to key support?
I've mapped out BOTH scenarios with clear technical targets—don’t miss your chance to catch the next big wave!
💡 Tap "Boost" if you found this analysis helpful.
📈 Follow my page for daily actionable trading setups!
👇 Drop your predictions in the comments below—are you bullish or bearish on EUR/USD this week?
Let’s win together!

Heating oilHeating Oil BUY CALL Chart explains SL TP EP
Putting It All Together: Heating Oil “Buy Call” Setup
Technical View Fundamental Support Trade Rationale
Falling wedge suggests reversal Seasonal demand + diesel shortage Bullish bias if breakout confirmed
Bottom Line
The falling wedge pattern in Heating Oil, supported by robust technical buy signals and seasonally supportive fundamentals, presents a compelling bullish opportunity—especially if a breakout is confirmed with strong volume. Just be mindful of macroeconomic and supply-side risks that could blunt momentum

EURUSD stops at the SMA200, ready to pullback.EURUSD stops at the SMA200, ready to pullback.
The pair has been forming the bearish wedge since the April 2025 till July 2025. At the end of July the lower border of the pattern got broken and the price has rapidly reached the 1.14000 support level. Then the rebound from this level occurred and currently the price is retesting the lower border of the wedge from below. Additionally, the SMA200 is situated just above the current price, which is a fair argument for the price to pullback in the nearest future. The price is expected to decline with a first target of 1.14000.

EURCAD: More Growth Ahead 🇪🇺🇨🇦
EURCAD broke a resistance line of a bullish flag pattern yesterday.
A consequent confirmed Break of Structure BoS indicates
that the rise will most likely continue.
The next strong resistance is 1.61.
The market is going to reach that soon.
❤️Please, support my work with like, thank you!❤️
I am part of Trade Nation's Influencer program and receive a monthly fee for using their TradingView charts in my analysis.

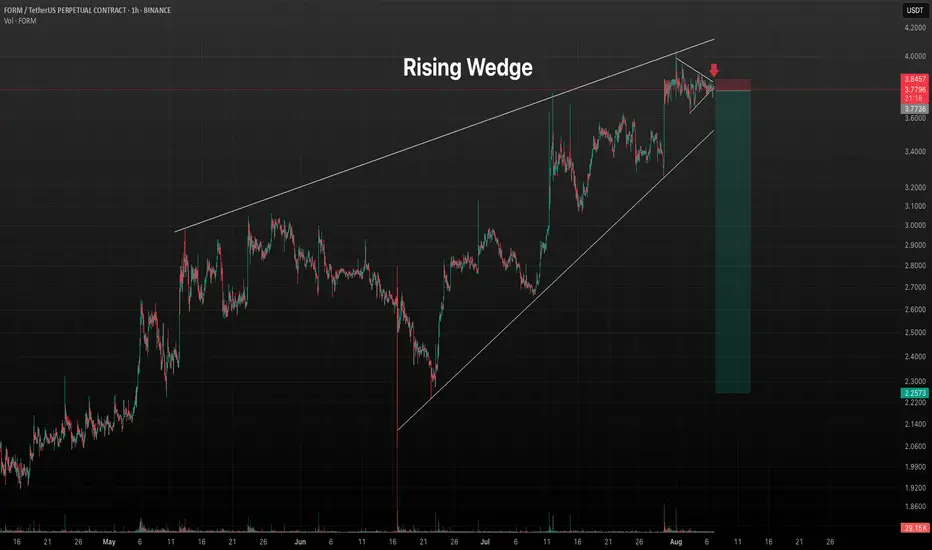
FORMUSDT - 4h Rising Wedge & 15m Symmetrical TriangleDouble signals resonate for a very high profit/loss ratio opportunity.
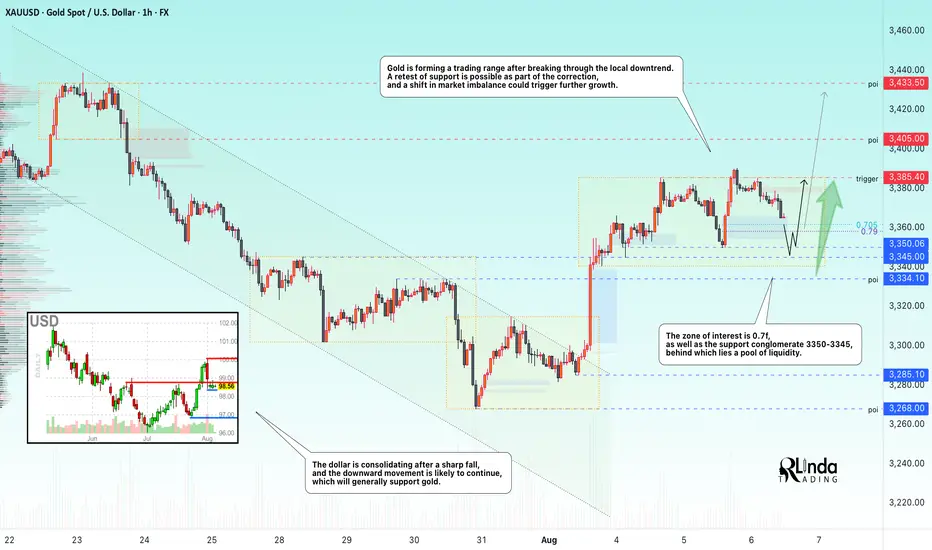
GOLD → Long squeeze of support ahead of possible growthFX:XAUUSD is entering a consolidation phase after a rally. The market is forming a trading range, and a retest of support could end in growth...
Gold pulled back from an 8-day high ($3391) on profit-taking ahead of Trump's Fed appointments. Weak ISM services data (50.1) and a pause in the dollar's weakening added pressure, although expectations of Fed policy easing in September remain supportive.
The market focus is on key events: Fed appointments (including a possible replacement for Powell) and Trump's trade statements. These factors could provide new momentum after the current correction, as long as the fundamental drivers for growth remain in place.
Resistance levels: 3385.4
Support levels: 3358, 3350, 3345
Technically, the price has confirmed resistance after a false breakout, and the market needs to build up potential for a possible continuation of growth. At the moment, the most likely scenario is a long squeeze (false breakdown) before growth continues. Focus on the key support zone.
Best regards, R. Linda!
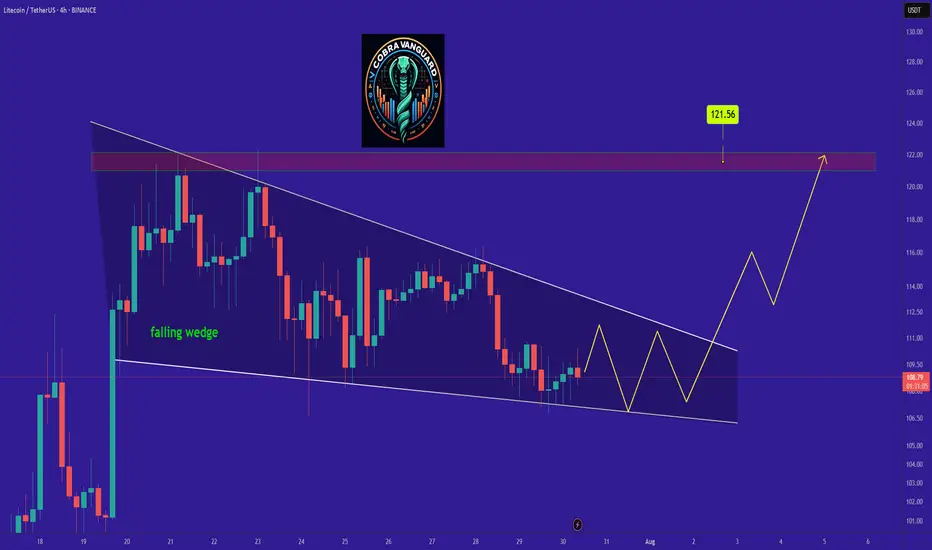
LTC is bullish now and many Traders don't see itSo if you pay attention to the LTC chart you can see that the price has formed a Ascending wedge which means it is expected to price move as equal as the measured price movement.( AB=CD )
NOTE: wait for break of the WEDGE .
Best regards CobraVanguard.💚
ZETA: when a wedge isn’t just a wedge — it’s a launchpadTechnically, this setup is textbook clean. Price completed the fifth wave within a falling wedge and instantly reacted with a bullish breakout. The expected breakdown didn’t happen — instead, buyers stepped in, confirmed by rising volume. All EMAs are compressed at the bottom of the structure, signaling a clear shift in momentum. The volume profile shows strong accumulation around $14, while the area above current levels is a vacuum — ideal conditions for acceleration.
The key resistance zone is $16.70–17.20 — former base highs and the 0.236 Fibonacci retracement. If price breaks this area with volume, the next stop is likely $24.48 (0.5 Fibo). Classical wedge targets land at $38.28 and $55.33 (1.272 and 1.618 extensions). If a trending leg begins, it could move fast — because there’s simply no supply overhead.
Fundamentals:
ZETA isn’t a profitable company yet, but it shows consistent revenue growth and aggressive expansion. Capitalization is rising, debt is manageable, and institutional interest has increased over recent quarters. In an environment where tech and AI are regaining momentum, ZETA could be a speculative second-tier breakout candidate.
Tactical plan:
— Entry: market or after a retest of $14.00–14.30
— First target: $17.20
— Main target: $24.48
— Continuation: $38.28+
— Stop: below $13.00 (bottom wedge boundary)
When the market prints a wedge like this and the crowd ignores it — that’s often the best trap setup. Only this time, it’s not for retail buyers. It’s for the shorts. Because when a falling wedge breaks to the upside with volume — it’s time to buckle up.

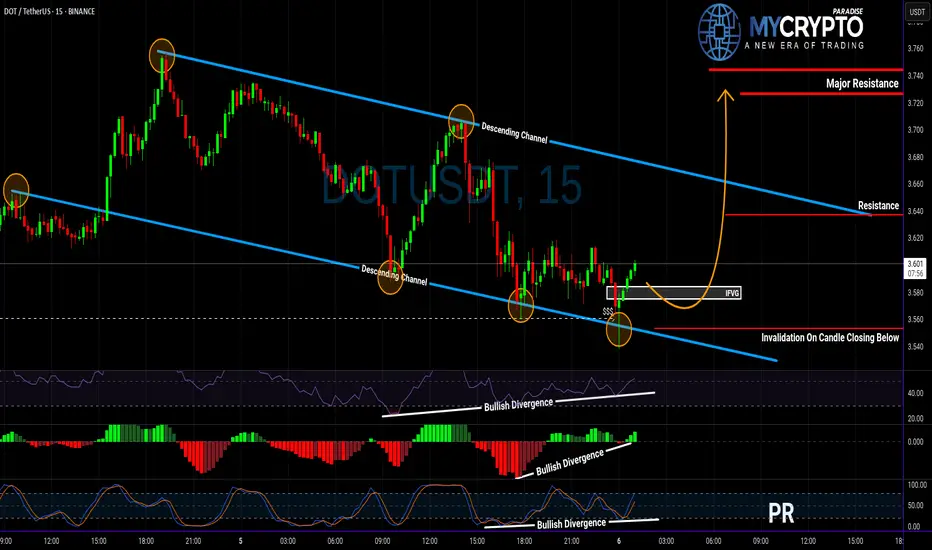
DOT About to Explode or Collapse? Read This Before Entering!Yello Paradisers, are you watching DOT closely? Because this setup could either give aggressive traders a golden entry—or wipe out the impatient ones 👀
💎DOTUSDT is showing strength after sweeping liquidity and now sitting right at the supportive trendline of its descending channel. What’s catching our attention is the clear bullish divergence on RSI, MACD, and Stoch RSI, which together boost the probability of a bullish breakout from here.
💎If we get a pullback, the IFVG zone (Inverse Fair Value Gap) below offers a clean setup for a high RR (risk-to-reward) trade. That would be a more strategic entry for patient traders. But for those who trade more aggressively, the current price is already offering a decent RR setup—just remember, this is not advisable for beginners. Patience and discipline remain key, especially in uncertain zones like this.
💎However, if DOTUSDT breaks down and closes a candle below our invalidation level, the bullish scenario is completely off the table. In that case, the smartest move is to step aside and wait for better confirmation before making any decisions.
🎖Strive for consistency, not quick profits. Treat the market as a businessman, not as a gambler.
MyCryptoParadise
iFeel the success🌴