Nasdaq Crash Incoming: Wave 3 of 3 DownOver in this video, I go through the 5th wave up and identify 2 key things for this top:
1. Wave 5 = Wave 3, since wave 1 is the longest, wave 3 cannot be the shortest wave.
2. 2 Spinning tops marks the peak on 29th and 30th Oct 2025.
The first wave down is a "leading diagonal" because wave 4 overl
Market indices

SPX: Uptrend Intact — But Structural Compression EmergingThe daily structure on SPX remains technically constructive, with price holding above a rising 50-day moving average.
However, the character of price action has shifted.
After a strong multi-month expansion phase, the index is now compressing beneath prior highs (~7,050–7,100 zone), producing over

US30 : Higher Lows Supporting Further UpsideThe arrows highlight a sequence of higher lows with price continuing to rotate upward after each pullback. Momentum remains constructive and dips are being absorbed rather than accelerating lower. As long as this structure holds, the short-term bias favours continuation to the upside.
Disclosure: W

KSE-100 TECH ANALYSIS | 15-02-2026| 30-Min TF| By TCAKSE-100 TECH ANALYSIS | 15-02-2026| 30-Min TF| By TCA
Breakdown Analysis and Support/Resistance Setup:
The index has broken down from a consolidation zone marked by a light pink channel. Furthermore, price action has fallen below the previously established high time frame (HTF) bullish channel, whi

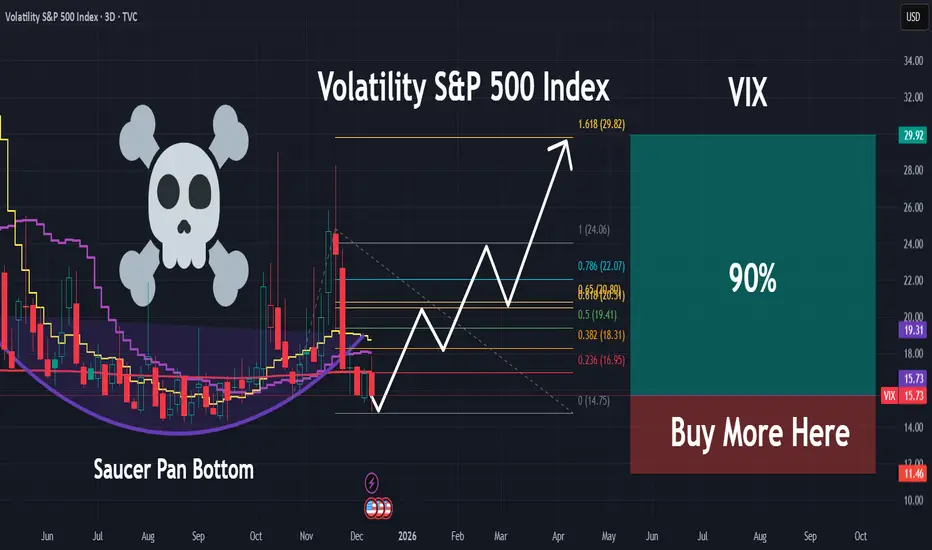
VIX | Major Volatility and Market Correction Incoming | LONGThe VIX Index, formally known as the Cboe Volatility Index, is a real-time market index that represents the market's expectation of 30-day forward-looking volatility for the S&P 500 index. It is widely known as the "fear gauge" because it tends to rise sharply during periods of increased investor fe
Understanding Shiller: Reality vs Expectations I haven't updated at all since my beginning of year post because I am waiting for the market to "do something" instead of what its doing here, which is nothing.
But what I see is an opportunity to discuss some of the fundamentals that can offer an explanation for this "nothing" price action we are

NAS100Nasdaq daily time frame indicated liquidity sweep after generating for quite some time, so we anticipate that this is the last move down that swept all the lows. The move it will make will be similar to the us30 move. We are in a bullish mindset.

WEEKLY MARKET OUTLOOK – STRUCTURE HOLDING, BRKOUT PENDING NIFTy
Nifty closed at 25,471, down 222 points from last week. High 26,009, Low 25,444.
As discussed earlier, I was not convinced by the V-shaped recovery. The market has continued respecting the 26,000–25,200 structure, keeping the broader corrective W-pattern possibility alive.
NIFTY – LEVEL MAP
Sho

Stock markets go side ways for a decade?I would not be surprised to see the stock markets go side ways for a decade...

Possible bullish reversalThe US Dollar Index is currently trading near a key support zone around 96.15–96.20, where price previously showed strong buying reaction. This area could act as a base for a potential bullish reversal.
Although the broader structure recently turned bearish after a strong downside impulse, the curre

See all popular ideas
Index collections
Frequently Asked Questions
An index is a financial instrument that measures the performance of underlying assets or tracks other financial data. Some indices are designed to provide a broad view of the market, while others focus on tracking a particular sector of the economy. Indices give traders an instant snapshot of market sentiment with a rising index suggesting optimism about the economy and a declining index signaling uncertainty.
For example, the S&P 500 Index (SPX) tracks the performance of 500 large publicly traded companies in the United States, while the US consumer price index (CPI) measures US inflation and deflation.
Usually, indices are expressed in points, but some, like the S&P 500, can be expressed in the national currency.
With TradingView, you can follow all indices in one place.
Indices are used to track assets or financial data, so they're not designed for trading, but some financial instruments linked to indices can be traded on exchanges. They include mutual funds, exchange-traded funds (ETFs), index futures, contracts for difference (CFDs), and options on indices.
We recommend conducting a thorough analysis before settling with any of these instruments: explore indices ideas and forecasts and then select a reliable brokerage on TradingView. Once you open an account, you'll be all set to start investing in indices.
We recommend conducting a thorough analysis before settling with any of these instruments: explore indices ideas and forecasts and then select a reliable brokerage on TradingView. Once you open an account, you'll be all set to start investing in indices.
The main global indices that investors and traders track include the S&P 500, FTSE 100, Dow Jones, and more.
For your convenience, we have a list of all major indices in one place — analyze their stats to conduct a well-rounded analysis.
For your convenience, we have a list of all major indices in one place — analyze their stats to conduct a well-rounded analysis.
Stock market indices are mainly used to gauge the health of a particular sector of the world economy. For example, as one of the main global indices, the S&P 500 (SPX) provides investors and traders with insight into the health of the US economy. Another reputable index, the DAX Index, helps assess the performance of German blue-chip companies. It is one of the primary indicators of Germany's economic health in particular and, more broadly, the EU's economic health.
Today, CAC 40 is 8,311.74 EUR. It has decreased by 0.68% over the past month. DAX is 24,914.88 EUR (2.02% down since last month) while FTSE 100 is 10,446.36 GBP (3.05% up since last month).
For the broader outlook, we have a list with indices of the European countries.
For the broader outlook, we have a list with indices of the European countries.
As of today, the S&P 500 stands at 6,836.18 USD, showing a 1.46% decrease over the past month. Dow Jones is currently at 49,500.94 USD, reflecting a 0.84% increase during the same period. Meanwhile, Nasdaq 100 has reached 24,732.73 USD, marking a 3.30% decrease compared to the previous month.
For the broader outlook, we have a list with all indices in one place.
For the broader outlook, we have a list with all indices in one place.
The Standard and Poor's 500 (SPX) is one of the most reputable indices, tracking the performance of 500 largest publicly traded US-based companies. It represents approximately 80% of the total US equity market capitalization, making it the prime indicator of the US economy's health.
Today, the SPX is 6,836.18 USD, it has decreased by 1.46% over the past month.
On TradingView, you can track SPX components and watch the SPX chart to stay on top on index dynamics.
Today, the SPX is 6,836.18 USD, it has decreased by 1.46% over the past month.
On TradingView, you can track SPX components and watch the SPX chart to stay on top on index dynamics.
The Dow Jones, or just the Dow, is short for the Dow Jones Industrial Average Index (DJI). It is one of the most reputable indices, tracking the performance of 30 blue-chip US stocks. All of them are stable and trusted companies boasting a long history of weathering the market under different circumstances, from gains during bull runs to surviving global economic crises.
Today, the DJI is 49,500.94 USD, it has increased by 0.84% over the past month.
On TradingView, you can track DJI components and watch the DJI chart to stay on top of index dynamics.
Today, the DJI is 49,500.94 USD, it has increased by 0.84% over the past month.
On TradingView, you can track DJI components and watch the DJI chart to stay on top of index dynamics.
An index fund is a financial instrument that tracks the performance of a financial index. Since indices cannot be bought as they are, index funds can have different structures that provide investors with exposure to the identical price fluctuations of a given set of stocks.
For example, an index fund can hold the exact stocks in a proportion similar to the index's initial weight, given to each stock. Therefore, as the index changes, a well-structured index fund would change by the same value.
To gain insight into market indices, explore our community ideas on indices.
For example, an index fund can hold the exact stocks in a proportion similar to the index's initial weight, given to each stock. Therefore, as the index changes, a well-structured index fund would change by the same value.
To gain insight into market indices, explore our community ideas on indices.