Bull/Bear CandleThis script identifies whether the current and previous candle is bullish, bearish or neutral. Bullish candles are displayed with a green triangle, bearish with a red, and neutral with a yellow. The bull/bear cut off is set at 65% but this is adjustable to your taste.
Search in scripts for "bear"
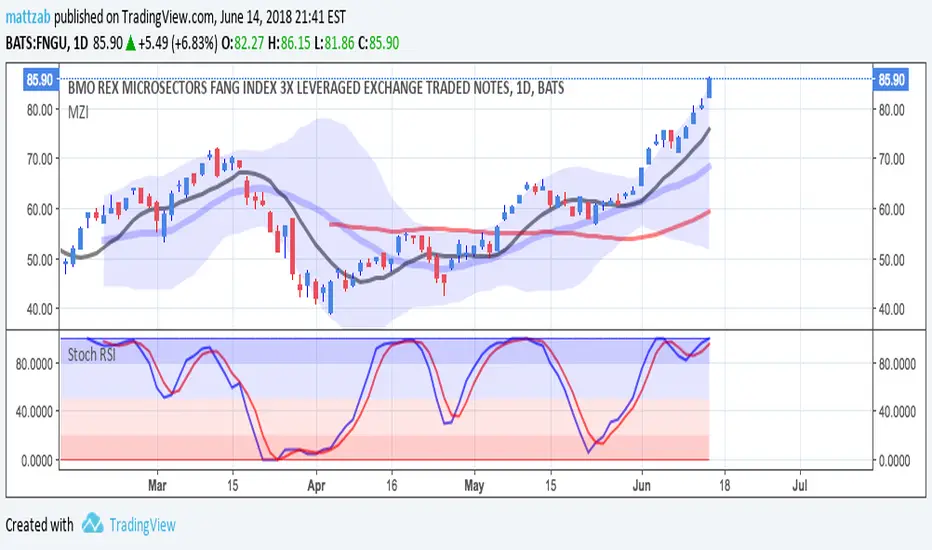
Bull Bear Stoch RSIStandard Stoch RSI with some color modification. 0 - 20 = Really Bearish (Dark Red Zone) 20 - 50 = Bearish (Light Red Zone) 50 - 80 = Bullish (Light Blue Zone) and 80 - 100 = Really Bullish (Strong Blue Zone). Thick lines at top and bottom to easily see 100 and 0.
Confluence Strategy Backtest This is modified version of Dale Legan's "Confluence" indicator written by Gary Fritz.
================================================================
Here is Gary`s commentary:
Since the Confluence indicator returned several "states" (bull, bear, grey, and zero),
he modified the return value a bit:
-9 to -1 = Bearish
-0.9 to 0.9 = "grey" (and zero)
1 to 9 = Bullish
The "grey" range corresponds to the "grey" values plotted by Dale's indicator, but
they're divided by 10.
You can change long to short in the Input Settings
Please, use it only for learning or paper trading. Do not for real trading.

Confluence Strategy This is modified version of Dale Legan's "Confluence" indicator written by Gary Fritz.
================================================================
Here is Gary`s commentary:
Since the Confluence indicator returned several "states" (bull, bear, grey, and zero),
he modified the return value a bit:
-9 to -1 = Bearish
-0.9 to 0.9 = "grey" (and zero)
1 to 9 = Bullish
The "grey" range corresponds to the "grey" values plotted by Dale's indicator, but
they're divided by 10.

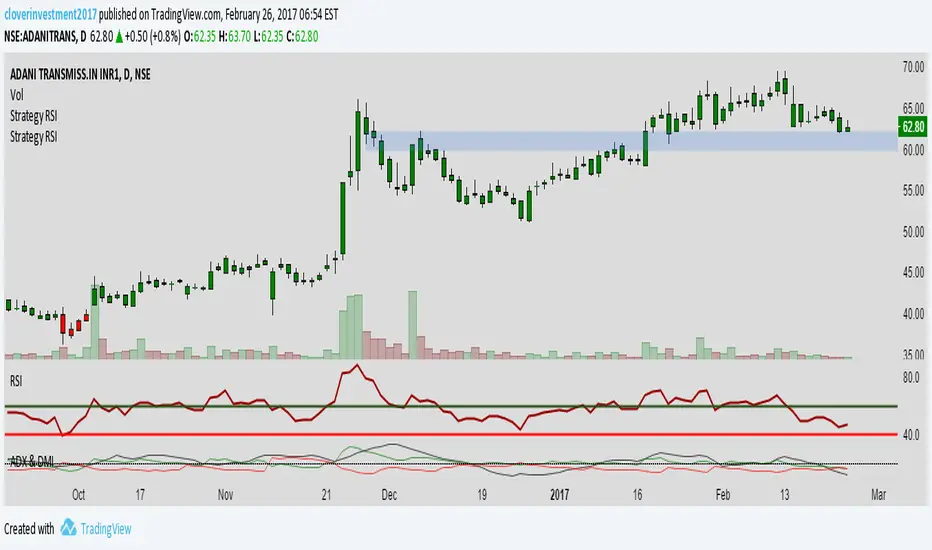
RSI IN Bull AND BEARLook RSI will oversold at 40 and 60 in Bullish Market
and RSI overbought at 60 and 40 at Bearish Market
To know more about Bullish and Bearish Market Criteria
Connect me at cloverinvestmentsindia@gmail.com
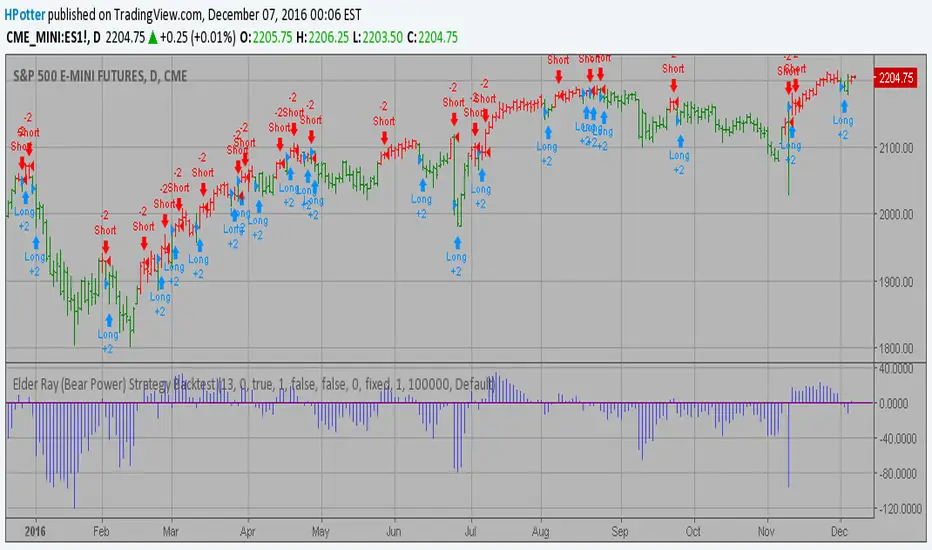
Elder Ray (Bear Power) Strategy Backtest Developed by Dr Alexander Elder, the Elder-ray indicator measures buying
and selling pressure in the market. The Elder-ray is often used as part
of the Triple Screen trading system but may also be used on its own.
Dr Elder uses a 13-day exponential moving average (EMA) to indicate the
market consensus of value. Bear Power measures the ability of sellers to
drive prices below the consensus of value. Bear Power reflects the ability
of sellers to drive prices below the average consensus of value.
Bull Power is calculated by subtracting the 13-day EMA from the day's High.
Bear power subtracts the 13-day EMA from the day's Low.
You can use in the xPrice any series: Open, High, Low, Close, HL2, HLC3, OHLC4 and ect...
You can change long to short in the Input Settings
Please, use it only for learning or paper trading. Do not for real trading.
EMA bullish/bearish dashboard - MTFThis is a good reminder for which way you should be placing orders.
It's best to not ignore these signals!!!
lime = full bull - 100ema above 200ema and price is above 200ema
green = hallf bull - price now below 200ema but 100ema is still above the 200
maroon = full bear - opposite of full bull
red = half bear - opposite of half bull
Also with multi timeframe option - so I guess you could stack several of these on a single framed chart if you wanted.

[NM] EMADiff v01 - an indicator for everyone !Allright gang, we are here with a new indicator that should help you with determining the direction to trade or whether you should trade at all.
It uses the close of the candle and 2 EMAs.
The faster moving line is the difference between the close and the Slow EMA, while the slower moving line shows the difference between the Fast EMA and the Slow EMA.
There are a couple of ways you can use this indicator, depending on your trading style :
For the quick profit, in and out :
- enable the safer trading option and keep smoothing at the default setting, buy when both lines are green, sell when both line are red and get out when one of the lines changes color (or when profit target is reached) (see the top option)
For longer trades :
- you can increase the smoothing, use a higher Slow EMA and disable the Safer trading option, enter either when both lines have the same color, either on a crossover. (the bottom option)
In both cases, if both lines hover around the zero line, the trend is definitely not strong.
Much more options are available so I would love to hear how you use this indicator. A thumbs up if you like it would be highly appreciated :)
Works nicely together with my other indicators below :
To add this indicator (or any other) to your chart, click the "Add to favorites" button. Then while having the chart you wish to apply it to open, click on Indicators > Favorites > EMADiff v01 (or any other indicator that you favorited.

Elder Ray Composite DOA hybrid representation of Elder Ray's Bear/Bull as an oscillator, using TEMA and LRC calculations to average out the signals. The Oscillation is based off of the Derivative oscillator. This gives an interesting interpretation of Bear vs Bull power. Give it a try!

VWAP (Bullish/Bearish Coloring)VWAP (Bullish/Bearish Coloring)
Overview
VWAP (Bullish/Bearish Coloring) is a Pine Script v6 indicator for TradingView that plots a Volume-Weighted Average Price (VWAP) with customizable anchor periods and optional upper/lower bands. It can apply peak/trough-based coloring to reflect recent swing direction. Optional resets tied to corporate actions help maintain continuity over longer periods. It is commonly used to review dynamic support/resistance behavior across timeframes.
How It Works
The indicator computes VWAP using TradingView’s ta.vwap, weighting the selected price source (default: HLC3) by volume and resetting at user-defined anchors (e.g., Session, Week, Month, Earnings). Bands are calculated using either standard deviation or percentage offsets (default multipliers: 1.0, 2.0, 3.0). Peak/trough detection (ta.pivothigh, ta.pivotlow, default lookback: 5 bars) can color the VWAP and bands to reflect recent swing context. Optional resets can reference request.earnings, request.dividends, and request.splits. The VWAP can be hidden on daily or higher timeframes.
Key Features
• Dynamic VWAP Calculation: Resets at user-selected anchors (Session, Week, Month, Quarter, Year, Decade, Century, Earnings, Dividends, Splits).
• Peak/Trough Coloring: Optional swing-based coloring for VWAP and bands.
• Customizable Bands: Up to three band pairs using standard deviation or percentage offsets.
• Flexible Anchors: Time-based or corporate-action-based resets.
• Customizable Visuals: Adjustable colors, opacity, and offsets.
• Timeframe Option: Hide VWAP on daily or higher timeframes.
What It Displays
A VWAP line with optional bands and swing-based coloring, plus flexible anchor resets to align the measure with the user’s analysis framework. This provides a flexible tool for assessing trend context and potential support/resistance behavior across symbols and timeframes.
Originality
Pine v6 implementation using TradingView’s built-ins: ta.vwap, ta.pivothigh, ta.pivotlow, request.earnings, request.dividends, and request.splits.
Common Ways People Use It
• Intraday VWAP as a dynamic reference area.
• Swing alignment with broader context via alternative anchors.
• Reviewing volume-weighted price behavior with optional swing cues.
Configuration Notes
Choose the anchor period (default: Session), price source (default: HLC3), and band multipliers (default: 1.0/2.0/3.0). Optionally enable peak/trough coloring and toggle band visibility as needed.
Legal Disclaimer
This indicator is for informational and educational purposes only—not investment, financial, or trading advice. Past performance does not guarantee future results; trading involves significant risk. Provided “as is” without warranties. Consider consulting a qualified professional before making decisions.

Bullish & Bearish Once Bar PainterThe Bullish & Bearish First Bar Marker is a simple yet powerful indicator designed to highlight the first bullish and bearish bars in a sequence, helping traders identify key momentum shifts in the market. It marks:Bullish Bars: The first bar where the high and low are both higher than the previous bar (high > high and low > low ), painted green with a "Bullish" label.
Bearish Bars: The first bar where the high and low are both lower than the previous bar (high < high and low < low ), painted red with a "Bearish" label.
To avoid clutter, consecutive bullish or bearish bars are not marked until a non-bullish or non-bearish bar resets the sequence. This makes it ideal for spotting the start of strong upward or downward price movements.

Nifty 50 Scalping - Bullish Buy & Bearish Sell (5 Target / 2 SL)Nifty 50 Scalping - Bullish Buy & Bearish Sell (5 Target / 2 SL)

Moons Bearish Pullback Detector# Moons Bearish Pullback Detector
## Overview
**Moons Bearish Pullback Detector** is a trend following indicator intended to identify bearish trend pullbacks to enter on price continuation.
This indicator is useful for setting watchlist alerts! Configure your pullback rules and have it monitor your watchlist for you. You will be alerted when pullbacks have occurred and are starting to continue in the trend direction.
## How It Works
### Bearish Trend Detection
The indicator identifies a bearish trend based on a configurable MA basis
### Pullback Identification
Once in a bearish trend, the indicator tracks:
Swing Lows: Continuously monitors and updates the lowest point in the trend
Pullback Start: Detects the first green candle after establishing new lows
Pullback Duration: Monitors pullback length (configurable number of bars)
Pullback Depth: Ensures pullbacks don't violate a key moving average (optional)
### Multi-Layer Filtering System
The indicator employs several optional filters to ensure signal quality:
Volume Filter: Set a minimum daily volume to ensure sufficient liquidity
Pullback Duration Filter: Pick a min and max bar count you like to see in a pullback.
Pullback Depth Filter: Monitors that pullbacks don't close above the desired EMA, maintaining trend strength
Validation Filter: Checks higher timeframe moving average for trend confirmation
Context Filter: Analyzes even higher timeframe for broader market context
### Alert System
The indicator generates alerts when:
All filtering conditions are met
Price crosses back below the configured alert line
This signals potential continuation of the bearish trend and gives warning to place potential orders
## Key Features
### Alerts
The indicator is useful for driving a watchlist alert to notify you when a pullback is starting to continue the trend.
### Visual Elements
Bollinger Bands: Optional display of 1 and 2 standard deviation bands
Moving Averages: 20 EMA (basis), 50 EMA, and 10 EMA (pullback filter)
Trend High Line: Yellow line showing current swing low during pullbacks
Alert Line: Entry signal line positioned below swing low
Background Highlighting: Gray for normal pullbacks, red tint when rules aren't met
Labels: Price labels at swing lows and depth violation warnings
Wick Detection: Tags bullish and bearish wicks for helpful spotting in your analysis
### Information Table
Comprehensive status table to show the state of your filters and rules as price plays out.
### Configuration Options
Moving average settings
Display Options
Alert Configuration
Filter Settings
## Best Use Cases
Swing Trading: Identify high-probability entries during trend pullbacks
Trend Following: Stay aligned with strong bearish momentum
Risk Management: Multiple filters help avoid false signals
Multi-Timeframe Analysis: Ensures broader market context alignment
## Trading Applications
This indicator works best when:
Markets are in clear downtrends
Sufficient volume is present
Multiple timeframes align
Used in conjunction with proper risk management
The Moons Pullback Detector provides traders with a systematic approach to identifying and capitalizing on pullback opportunities in strong bearish trends, combining technical rigor with practical usability.
---
*Note: This indicator is for educational purposes. Past performance does not guarantee future results. Always use proper risk management and consider multiple factors when making trading decisions.*

Two bullish candles buy and bearish candles sellA simple strategy for test.
Buy when two consecutive bullish candles.
Sell when two consecutive bearish candles.
Bull/Bear Lower Volume (vijayachandru)Bull/Bear Lower Volume (HA + Box + ±15 Lines)
This indicator tracks intraday Heikin Ashi candles and highlights the lowest-volume bull/bear candles after 9:25 (IST). When price breaks above/below these candles, a breakout box is drawn with optional ±15 point dashed levels. It plots clear Buy/Sell signals, marks box breakouts, and provides alert conditions for all setups—helping traders spot early intraday breakouts driven by volume shifts

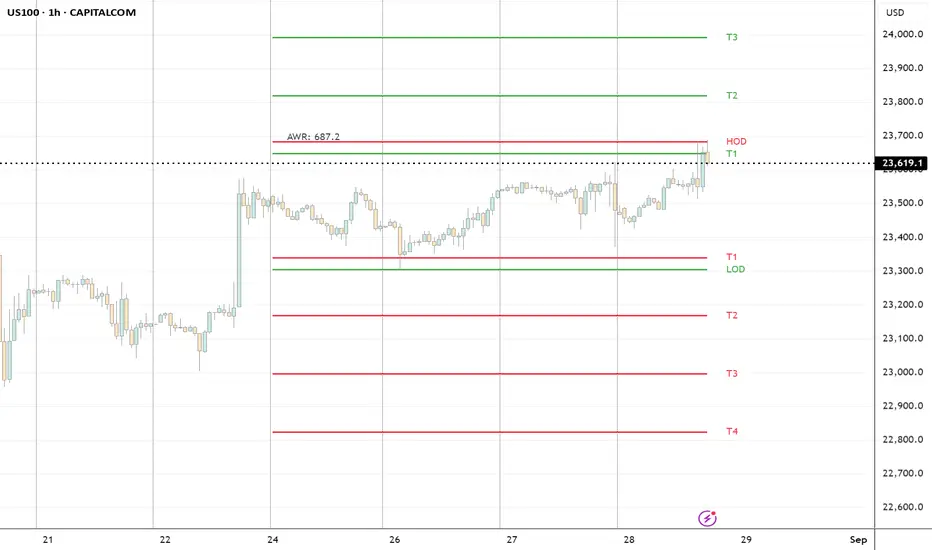
ADR H/L + Bull/Bear TargetsThis indicator calculates the Average Daily/Weekly Range over any given period and plots the Bull and Bear targets for that Session Daily/Weekly or both. Classic targets are calculated at ADR/AWR +/- .50 .75 1.00 1.25. Green is for the + and RED is for the - but colors can been changed to suit.
In 'Settings' there is the ability to toggle:
1. How many sessions you want to plotting on your chart.
2. Switching ON/OFF Bull/Bear targets.
3. Line color/thickness
4. Ability to offset Header for ADR/AWR vertically.
5. I've put in there a FIB option as well as Classic. FIB counts are at .382 .50 .618 1.00 of ADR and labelled as such.
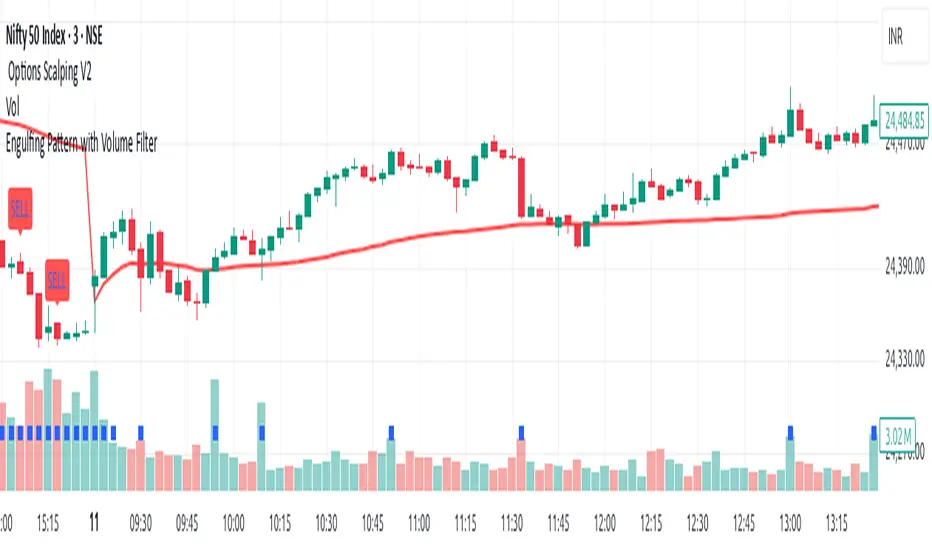
Strong Bullish And Bearish Engulfing PatternCONDITIONS:
🔹 1st Condition — Bullish Engulfing ➜ BUY
Previous Candle (Red): close < open
Current Candle (Green): close > open
Opens below previous red candle’s close: open < close
Closes above previous red candle’s open: close > open
➡️ Plot BUY below the green candle
🔸 2nd Condition — Bearish Engulfing ➜ SELL
Previous Candle (Green): close > open
Current Candle (Red): close < open
Opens above previous green candle’s close: open > close
Closes below previous green candle’s open: close < open
➡️ Plot SELL above the red candle
What this Script Does:
Detects Bullish Engulfing patterns ➜ plots BUY below the green candle.
Detects Bearish Engulfing patterns ➜ plots SELL above the red candle.
Bullish & Bearish Signals (Dual Mode, Strong Filters)on research related to bullish & bearish signal, understanding how ema, macd works...

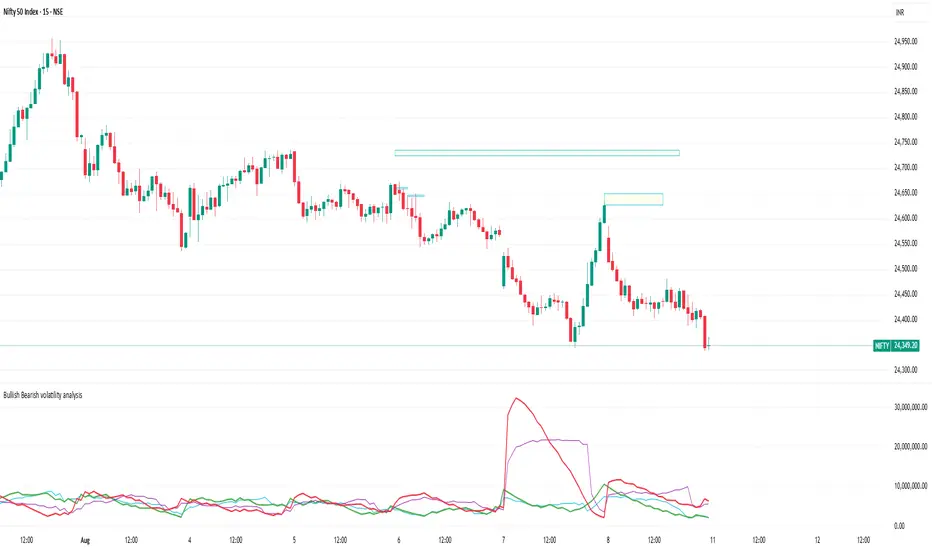
Bullish Bearish volatility analysisThis script is used to analyse Bullish/Bearish volatility direction based on volumes and moving average.
iDea Stochastic Divergence Pro iDea TradeThis indicator automatically detects and highlights bullish and bearish divergences using the Stochastic oscillator.
Main features:
Automatic detection of bullish & bearish divergences
Clear visual signals: red (bearish) and green (bullish) lines
Overbought/oversold zone dots
Price filter option for more reliable divergences
Alerts for reversal and divergence completion
Customizable thresholds and smoothing settings
How to use:
Look for red or green divergence lines for potential trend reversals. Dots in overbought/oversold areas signal possible turning points. Combine with your own analysis for best results.
Note:
This script does not provide buy/sell signals. It is for technical analysis only and is not financial advice. Please use proper risk management.
Protected script. Source code is hidden but free for all TradingView users.
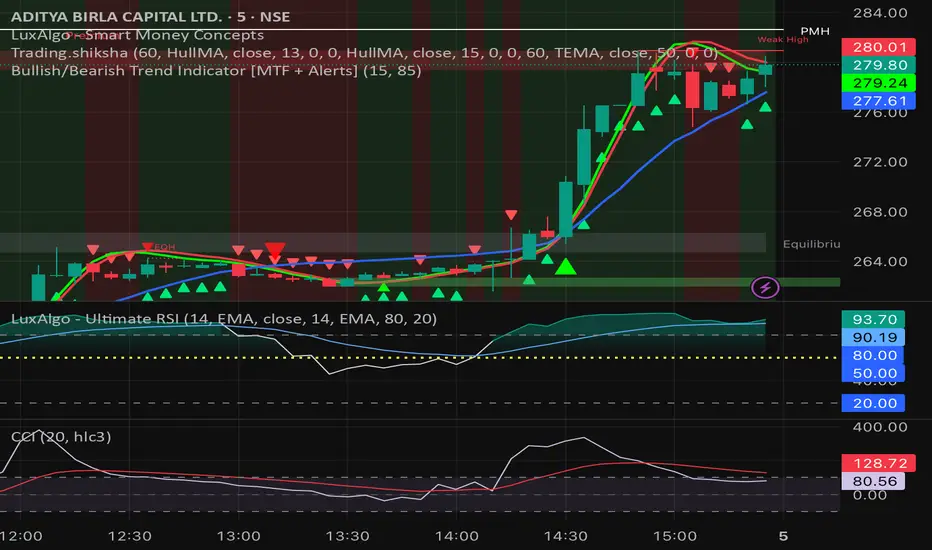
Bullish/Bearish Trend Indicator [MTF + Alerts] by Dow theory Summary of Logic:
✅ Bullish Trend:
Setup Bar: High > Previous High AND Low ≥ Previous Low
Confirmation Bar: High > Highest High of last 3 candles, Low ≥ Setup Bar Low
Trend Continues Until: Latest candle breaks 2nd last candle’s low → then trend becomes Bearish
🔻 Bearish Trend:
Setup Bar: Low < Previous Low AND High ≤ Previous High
Confirmation Bar: Low < Lowest Low of last 3 candles, High ≤ Setup Bar High
Trend Continues Until: Latest candle breaks 2nd last candle’s high → then trend becomes Bullish
RSI with Divergence and Custom Bullish/Bearish RangesRSI indicator with bullish and bearish shaded ranges accounting for:
- tendency of RSI to peak lower than usual and drop lower than usual in bearish trends
- tendency of RSI to peak higher than usual and bottom out higher than usual in bullish trends
