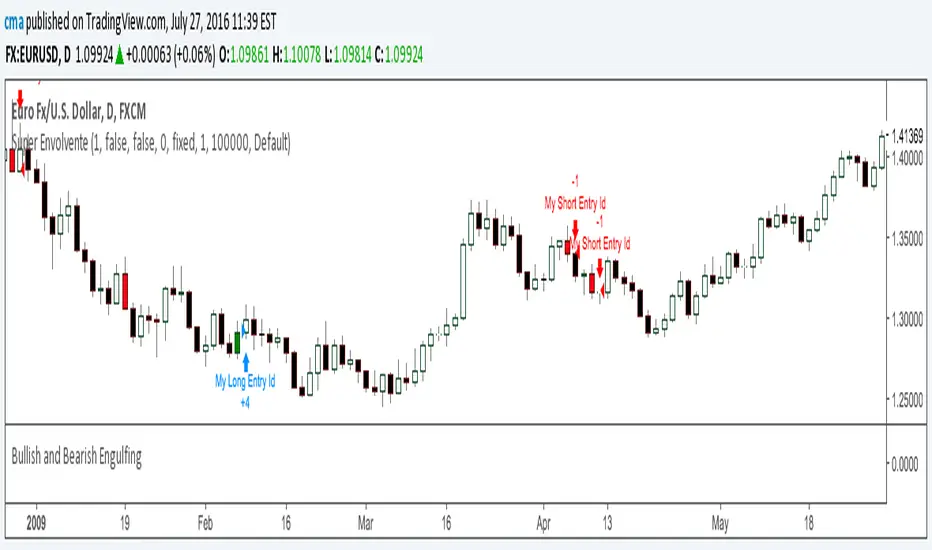
Bullish and Bearish EngulfingIndicator that changes the bar's color to green if there is a Bullish Engulfing or Red if there a Bearish Engulfing Patterns.Pine Script® indicatorby cma11379
Nooner's Heikin-Ashi/Bull-Bear CandlesCandles are colored red and green when Heikin-Ashi and Bull/Bear indicator agree. They are colored yellow when they disagree.Pine Script® indicatorby samnoonanUpdated 29
Bear Market Probability Model# Bear Market Probability Model: A Multi-Factor Risk Assessment Framework The Bear Market Probability Model represents a comprehensive quantitative framework for assessing systemic market risk through the integration of 13 distinct risk factors across four analytical categories: macroeconomic indicators, technical analysis factors, market sentiment measures, and market breadth metrics. This indicator synthesizes established financial research methodologies to provide real-time probabilistic assessments of impending bear market conditions, offering institutional-grade risk management capabilities to retail and professional traders alike. ## Theoretical Foundation ### Historical Context of Bear Market Prediction Bear market prediction has been a central focus of financial research since the seminal work of Dow (1901) and the subsequent development of technical analysis theory. The challenge of predicting market downturns gained renewed academic attention following the market crashes of 1929, 1987, 2000, and 2008, leading to the development of sophisticated multi-factor models. Fama and French (1989) demonstrated that certain financial variables possess predictive power for stock returns, particularly during market stress periods. Their three-factor model laid the groundwork for multi-dimensional risk assessment, which this indicator extends through the incorporation of real-time market microstructure data. ### Methodological Framework The model employs a weighted composite scoring methodology based on the theoretical framework established by Campbell and Shiller (1998) for market valuation assessment, extended through the incorporation of high-frequency sentiment and technical indicators as proposed by Baker and Wurgler (2006) in their seminal work on investor sentiment. The mathematical foundation follows the general form: Bear Market Probability = Σ(Wi × Ci) / ΣWi × 100 Where: - Wi = Category weight (i = 1,2,3,4) - Ci = Normalized category score - Categories: Macroeconomic, Technical, Sentiment, Breadth ## Component Analysis ### 1. Macroeconomic Risk Factors #### Yield Curve Analysis The inclusion of yield curve inversion as a primary predictor follows extensive research by Estrella and Mishkin (1998), who demonstrated that the term spread between 3-month and 10-year Treasury securities has historically preceded all major recessions since 1969. The model incorporates both the 2Y-10Y and 3M-10Y spreads to capture different aspects of monetary policy expectations. Implementation: - 2Y-10Y Spread: Captures market expectations of monetary policy trajectory - 3M-10Y Spread: Traditional recession predictor with 12-18 month lead time Scientific Basis: Harvey (1988) and subsequent research by Ang, Piazzesi, and Wei (2006) established the theoretical foundation linking yield curve inversions to economic contractions through the expectations hypothesis of the term structure. #### Credit Risk Premium Assessment High-yield credit spreads serve as a real-time gauge of systemic risk, following the methodology established by Gilchrist and Zakrajšek (2012) in their excess bond premium research. The model incorporates the ICE BofA High Yield Master II Option-Adjusted Spread as a proxy for credit market stress. Threshold Calibration: - Normal conditions: < 350 basis points - Elevated risk: 350-500 basis points - Severe stress: > 500 basis points #### Currency and Commodity Stress Indicators The US Dollar Index (DXY) momentum serves as a risk-off indicator, while the Gold-to-Oil ratio captures commodity market stress dynamics. This approach follows the methodology of Akram (2009) and Beckmann, Berger, and Czudaj (2015) in analyzing commodity-currency relationships during market stress. ### 2. Technical Analysis Factors #### Multi-Timeframe Moving Average Analysis The technical component incorporates the well-established moving average convergence methodology, drawing from the work of Brock, Lakonishok, and LeBaron (1992), who provided empirical evidence for the profitability of technical trading rules. Implementation: - Price relative to 50-day and 200-day simple moving averages - Moving average convergence/divergence analysis - Multi-timeframe MACD assessment (daily and weekly) #### Momentum and Volatility Analysis The model integrates Relative Strength Index (RSI) analysis following Wilder's (1978) original methodology, combined with maximum drawdown analysis based on the work of Magdon-Ismail and Atiya (2004) on optimal drawdown measurement. ### 3. Market Sentiment Factors #### Volatility Index Analysis The VIX component follows the established research of Whaley (2009) and subsequent work by Bekaert and Hoerova (2014) on VIX as a predictor of market stress. The model incorporates both absolute VIX levels and relative VIX spikes compared to the 20-day moving average. Calibration: - Low volatility: VIX < 20 - Elevated concern: VIX 20-25 - High fear: VIX > 25 - Panic conditions: VIX > 30 #### Put-Call Ratio Analysis Options flow analysis through put-call ratios provides insight into sophisticated investor positioning, following the methodology established by Pan and Poteshman (2006) in their analysis of informed trading in options markets. ### 4. Market Breadth Factors #### Advance-Decline Analysis Market breadth assessment follows the classic work of Fosback (1976) and subsequent research by Brown and Cliff (2004) on market breadth as a predictor of future returns. Components: - Daily advance-decline ratio - Advance-decline line momentum - McClellan Oscillator (Ema19 - Ema39 of A-D difference) #### New Highs-New Lows Analysis The new highs-new lows ratio serves as a market leadership indicator, based on the research of Zweig (1986) and validated in academic literature by Zarowin (1990). ## Dynamic Threshold Methodology The model incorporates adaptive thresholds based on rolling volatility and trend analysis, following the methodology established by Pagan and Sossounov (2003) for business cycle dating. This approach allows the model to adjust sensitivity based on prevailing market conditions. Dynamic Threshold Calculation: - Warning Level: Base threshold ± (Volatility × 1.0) - Danger Level: Base threshold ± (Volatility × 1.5) - Bounds: ±10-20 points from base threshold ## Professional Implementation ### Institutional Usage Patterns Professional risk managers typically employ multi-factor bear market models in several contexts: #### 1. Portfolio Risk Management - Tactical Asset Allocation: Reducing equity exposure when probability exceeds 60-70% - Hedging Strategies: Implementing protective puts or VIX calls when warning thresholds are breached - Sector Rotation: Shifting from growth to defensive sectors during elevated risk periods #### 2. Risk Budgeting - Value-at-Risk Adjustment: Incorporating bear market probability into VaR calculations - Stress Testing: Using probability levels to calibrate stress test scenarios - Capital Requirements: Adjusting regulatory capital based on systemic risk assessment #### 3. Client Communication - Risk Reporting: Quantifying market risk for client presentations - Investment Committee Decisions: Providing objective risk metrics for strategic decisions - Performance Attribution: Explaining defensive positioning during market stress ### Implementation Framework Professional traders typically implement such models through: #### Signal Hierarchy: 1. Probability < 30%: Normal risk positioning 2. Probability 30-50%: Increased hedging, reduced leverage 3. Probability 50-70%: Defensive positioning, cash building 4. Probability > 70%: Maximum defensive posture, short exposure consideration #### Risk Management Integration: - Position Sizing: Inverse relationship between probability and position size - Stop-Loss Adjustment: Tighter stops during elevated risk periods - Correlation Monitoring: Increased attention to cross-asset correlations ## Strengths and Advantages ### 1. Comprehensive Coverage The model's primary strength lies in its multi-dimensional approach, avoiding the single-factor bias that has historically plagued market timing models. By incorporating macroeconomic, technical, sentiment, and breadth factors, the model provides robust risk assessment across different market regimes. ### 2. Dynamic Adaptability The adaptive threshold mechanism allows the model to adjust sensitivity based on prevailing volatility conditions, reducing false signals during low-volatility periods and maintaining sensitivity during high-volatility regimes. ### 3. Real-Time Processing Unlike traditional academic models that rely on monthly or quarterly data, this indicator processes daily market data, providing timely risk assessment for active portfolio management. ### 4. Transparency and Interpretability The component-based structure allows users to understand which factors are driving risk assessment, enabling informed decision-making about model signals. ### 5. Historical Validation Each component has been validated in academic literature, providing theoretical foundation for the model's predictive power. ## Limitations and Weaknesses ### 1. Data Dependencies The model's effectiveness depends heavily on the availability and quality of real-time economic data. Federal Reserve Economic Data (FRED) updates may have lags that could impact model responsiveness during rapidly evolving market conditions. ### 2. Regime Change Sensitivity Like most quantitative models, the indicator may struggle during unprecedented market conditions or structural regime changes where historical relationships break down (Taleb, 2007). ### 3. False Signal Risk Multi-factor models inherently face the challenge of balancing sensitivity with specificity. The model may generate false positive signals during normal market volatility periods. ### 4. Currency and Geographic Bias The model focuses primarily on US market indicators, potentially limiting its effectiveness for global portfolio management or non-USD denominated assets. ### 5. Correlation Breakdown During extreme market stress, correlations between risk factors may increase dramatically, reducing the model's diversification benefits (Forbes and Rigobon, 2002). ## References Akram, Q. F. (2009). Commodity prices, interest rates and the dollar. Energy Economics, 31(6), 838-851. Ang, A., Piazzesi, M., & Wei, M. (2006). What does the yield curve tell us about GDP growth? Journal of Econometrics, 131(1-2), 359-403. Baker, M., & Wurgler, J. (2006). Investor sentiment and the cross‐section of stock returns. The Journal of Finance, 61(4), 1645-1680. Baker, S. R., Bloom, N., & Davis, S. J. (2016). Measuring economic policy uncertainty. The Quarterly Journal of Economics, 131(4), 1593-1636. Barber, B. M., & Odean, T. (2001). Boys will be boys: Gender, overconfidence, and common stock investment. The Quarterly Journal of Economics, 116(1), 261-292. Beckmann, J., Berger, T., & Czudaj, R. (2015). Does gold act as a hedge or a safe haven for stocks? A smooth transition approach. Economic Modelling, 48, 16-24. Bekaert, G., & Hoerova, M. (2014). The VIX, the variance premium and stock market volatility. Journal of Econometrics, 183(2), 181-192. Brock, W., Lakonishok, J., & LeBaron, B. (1992). Simple technical trading rules and the stochastic properties of stock returns. The Journal of Finance, 47(5), 1731-1764. Brown, G. W., & Cliff, M. T. (2004). Investor sentiment and the near-term stock market. Journal of Empirical Finance, 11(1), 1-27. Campbell, J. Y., & Shiller, R. J. (1998). Valuation ratios and the long-run stock market outlook. The Journal of Portfolio Management, 24(2), 11-26. Dow, C. H. (1901). Scientific stock speculation. The Magazine of Wall Street. Estrella, A., & Mishkin, F. S. (1998). Predicting US recessions: Financial variables as leading indicators. Review of Economics and Statistics, 80(1), 45-61. Fama, E. F., & French, K. R. (1989). Business conditions and expected returns on stocks and bonds. Journal of Financial Economics, 25(1), 23-49. Forbes, K. J., & Rigobon, R. (2002). No contagion, only interdependence: measuring stock market comovements. The Journal of Finance, 57(5), 2223-2261. Fosback, N. G. (1976). Stock market logic: A sophisticated approach to profits on Wall Street. The Institute for Econometric Research. Gilchrist, S., & Zakrajšek, E. (2012). Credit spreads and business cycle fluctuations. American Economic Review, 102(4), 1692-1720. Harvey, C. R. (1988). The real term structure and consumption growth. Journal of Financial Economics, 22(2), 305-333. Kahneman, D., & Tversky, A. (1979). Prospect theory: An analysis of decision under risk. Econometrica, 47(2), 263-291. Magdon-Ismail, M., & Atiya, A. F. (2004). Maximum drawdown. Risk, 17(10), 99-102. Nickerson, R. S. (1998). Confirmation bias: A ubiquitous phenomenon in many guises. Review of General Psychology, 2(2), 175-220. Pagan, A. R., & Sossounov, K. A. (2003). A simple framework for analysing bull and bear markets. Journal of Applied Econometrics, 18(1), 23-46. Pan, J., & Poteshman, A. M. (2006). The information in option volume for future stock prices. The Review of Financial Studies, 19(3), 871-908. Taleb, N. N. (2007). The black swan: The impact of the highly improbable. Random House. Whaley, R. E. (2009). Understanding the VIX. The Journal of Portfolio Management, 35(3), 98-105. Wilder, J. W. (1978). New concepts in technical trading systems. Trend Research. Zarowin, P. (1990). Size, seasonality, and stock market overreaction. Journal of Financial and Quantitative Analysis, 25(1), 113-125. Zweig, M. E. (1986). Winning on Wall Street. Warner Books.Pine Script® indicatorby EdgeToolsUpdated 1717557
Combo 2/20 EMA & Bear Power This is combo strategies for get a cumulative signal. First strategy This indicator plots 2/20 exponential moving average. For the Mov Avg X 2/20 Indicator, the EMA bar will be painted when the Alert criteria is met. Second strategy Bear Power Indicator To get more information please see "Bull And Bear Balance Indicator" by Vadim Gimelfarb. WARNING: - For purpose educate only - This script to change bars colors.Pine Script® strategyby HPotter44126
RSI bull & bearRSI BULL AND BEAR INDICATION ( for aggresive buying and aggresive selling(Pine Script® indicatorby GYMTALKS2278
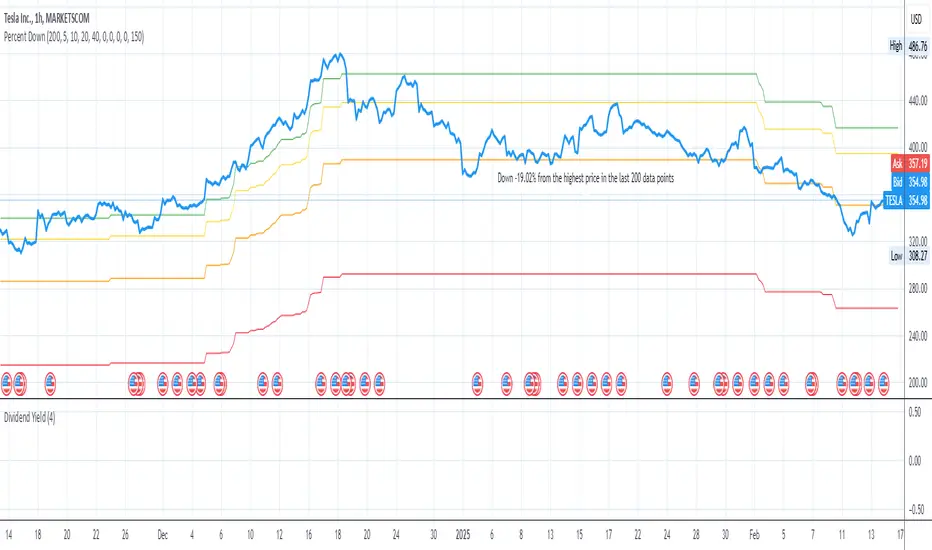
Price Target Pullback Correction or BearPrice Target percent drop is an indicator that allows you to set default percentage down from the 52 week high. A pullback, correction, bear and a bear market is marked as a 5%, 10%, 20% or 40% drop from the 52 week highest price, so this will show the target price to buy at if these thresholds are hit. You can change the default values of 5%, 10%, 20% and 40% to any percentage and the price will reflect the change of the default value. Furthermore, the default to use 52 weeks can be changed to find the highest price from the last 26 weeks or 104 weeks.Pine Script® indicatorby Bill_1142Updated 11269
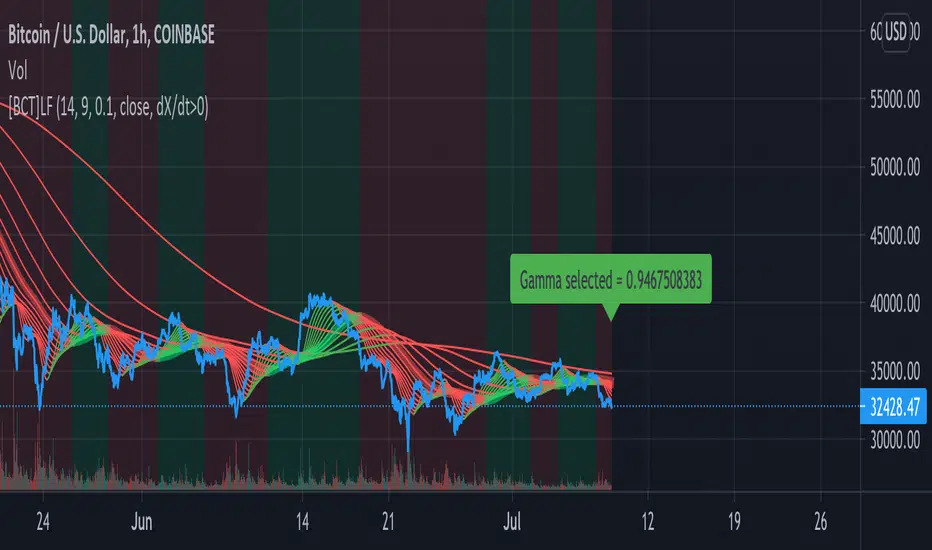
[BCT] Identify BULL / BEAR regimes - Laguerre FilterThe Adaptive Laguerre is based on the Laguerre filter, described by John Ehlers in his paper “Time Warp – Without Space Travel” forex-station.com MAs obtained using a Laguerre filter tend to have much lower lag than MAs obtained from an SMA or EMA. Use cases: - Identify market regime (BULL vs BEAR) - Smooth out a noisy signal (e.g. apply to RSI, prices, log returns, variance, etc) without adding excessive lag Highlight based on: - Smoothed indicator > or < 0 - Derivative of the indicator ("speed") > or < 0 - Second derivative of the indicator ("acceleration" or "momentum") > or < 0 Pine Script® indicatorby THE_REAL_BCT44136
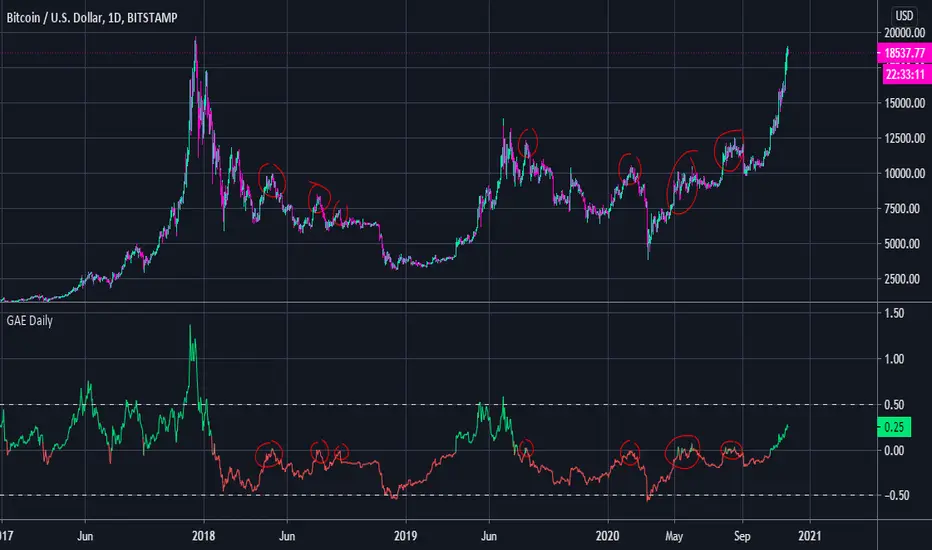
General Accumulation Evaluation BULL or BEAR Daily TrendGeneral Accumulation Evaluation by Lordchicken aka Chikun This indicator is ONLY useful on the daily time frame and ONLY on BTC. It will show you the general trend of BTC. Basic: X > 0 = Bullish trend X < 0 = Bearish trend X > 0.5 = Overbought X < -0.5 = Oversold Advanced: If X < 0 and tries to go above 0 that's a good place to short The end of a Bull/Bear trend is often shown with a strong reaction of X going above/beneath 0.Pine Script® indicatorby Chikunx42
NSDT Background Bear Bull DayA very basic script that changes the background color of the chart to Green if the price closes over the previous day close, and to Red if the price closes under the previous day close. This allows you to easily see if it is currently a Bull or Bear market with a glance. Alerts added.Pine Script® indicatorby NorthStarDayTrading68
Bullish and Bearish by NicolErazoFThis indicator changes the color of the candlesticks when there’s a change in the trend to the rising or falling trend. BEARISH ENGULFING: Yellow candlestick. It is an engulfing falling trend reversal; you must make a sell decision. BEARISH HARAMI: White candlestick. Indicates a possible falling trend change, you must be alert for a possible sale. BULLISH ENGULFING: Black candlestick. It is a change in the engulfing rising trend, you must make a purchase decision. BULLISH HARAMI: Blue candlestick. Indicates a possible rising trend change, you should be alert for a possible purchase. On the chart, you can see the 4 candles, on September 11 the black candle appears indicating a change in the uptrend. But today, the white candle is seen, which appears on September 8, indicating a rebound with a possible change in trend to bearish. Previous days, on August 26, you see the blue candle with a possible change in the upward trend, which then, on August 28, a yellow candle appears with a change in the downward trend. The Engulfing indicator (yellow and black) says that the candle has an engulfing change that is radical. On the other hand, the Harami (blue and white) indicates a possible change in trend that must be previously analyzed. Harami candles are smaller than Engulfing candles, since Harami in a Japanese term that means pregnancy, where the previous candle is the woman and the next candle is the baby. ___________________________________________________________________________ ESPAÑOL Este indicador cambia las velas de color cuando ocurre un cambio de tendencia ALCISTA o BAJISTA BEARISH ENGULFING: Vela de color amarillo. Es una cambio de tendencia bajista envolvente, debes tomar una decisión de venta. BEARISH HARAMI: Vela de color blanco. Indica un posible cambio de tendencia bajista, debes estar alerta para una posible venta. BULLISH ENGULFING: Vela de color negro. Es un cambio de tendencia alcista envolvente, debes tomar una decisión de compra. BULLISH HARAMI: Vela de color azul. Indica un posible cambio de tendencia alcista, debes estar alerta para una posible compra. En el gráfico, se pueden ver las 4 velas, el 11 de Septiembre aparece la vela negra que indica un cambio de tendencia alcista. Pero hoy, se ve la vela blanca, que aparece el 8 de septiembre, indicando un rebote con un posible cambio de tendencia a bajista. Días anteriores, el 26 de Agosto, se ve la vela azul con un posible cambio de tendencia alcista, que luego, el 28 de agosto aparece una vela amarilla con cambio de tendencia bajista. El indicador Engulfing (amarillo y negro) dice que la vela tiene un cambio envolvente que es radical. En cambio, el Harami (azul y blanco) indica un posible cambio de tendencia que debe ser previamente analizado. Las velas Harami son más pequeñas que las Engulfing , ya que Harami en un término japonés que significa embarazo, en donde la vela anterior es la mujer y la vela siguiente es el bebé. Pine Script® indicatorby nicolerazof33311
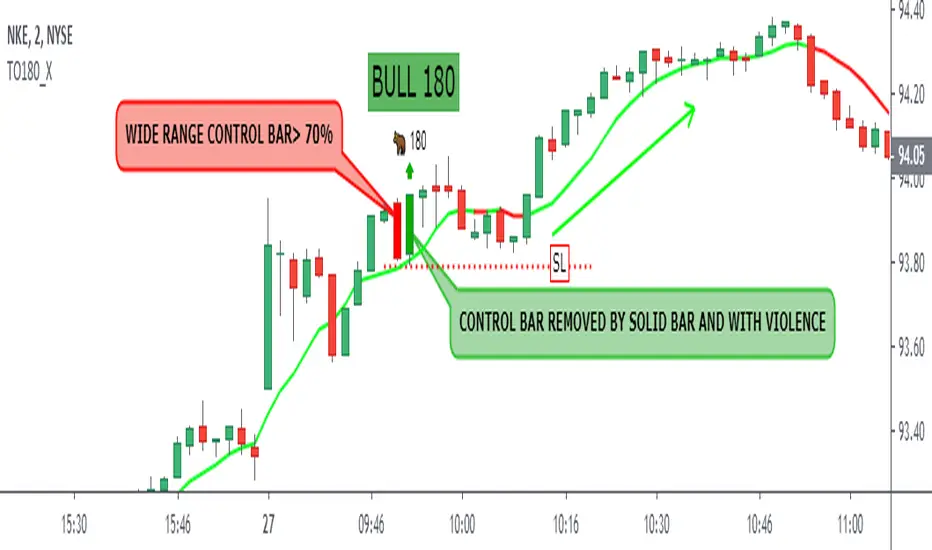
Bull Bear 180 by Oliver VelezThis script detects an event created by Oliver Velez is called Bull / Bear 180, in the following images the event is detailed: - The size of the control bar can be set compared to a number of previous bars - The minimum % of the control bar body can be set - You can filter by trend - Possibility of seeing fast and slow media with direction detection and color change - Various graphic settings - Event alerts To enjoy! A thumbs up if you like me!Pine Script® indicatorby Dreadblitz1313 1.3 K
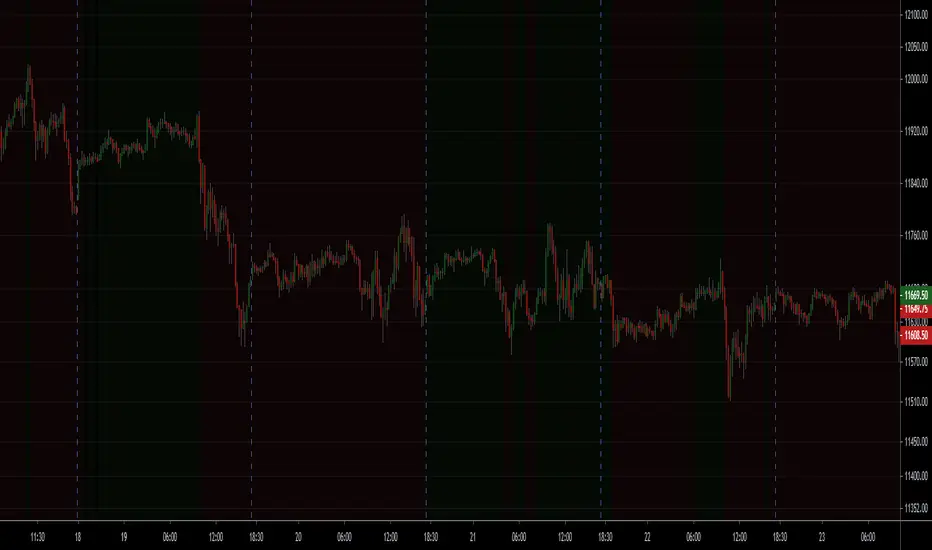
BTC Bear Market Identifier [ChuckBanger]I have never find a use case for Line Break chart before. But I stumbled on the fact that if bitcoin dumps below the low of a big down move. It is very likely Bitcoin is heading for a new bear market. So this script is based on that idea and developed to this. It is intended to be used as a bear market identifier only with Line Break daily or higher time frame chart. If someone find a different use case for this script let me know 2014: 2018: Pine Script® indicatorby ChuckBanger124
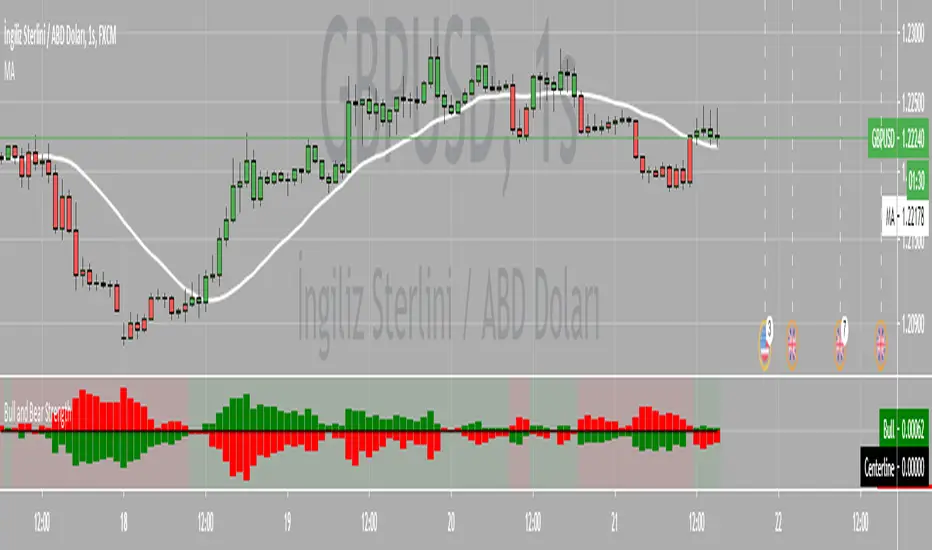
Bull power vs Bear powerBull power vs Bear power Buy=Bull power >0 Sell=Bear power<0 Pine Script® indicatorby ceyhunUpdated 44485
Bull Power Bear Power HistogramBull Power Bear Power HistogramPine Script® indicatorby ceyhunUpdated 88 1.3 K
Bull and Bear Fear Expert by Walter Downs StrategyBull and Bear Fear Expert by Walter Downs StrategyPine Script® strategyby ceyhunUpdated 1010699
Combo Backtest 123 Reversal & Bear Power This is combo strategies for get a cumulative signal. Result signal will return 1 if two strategies is long, -1 if all strategies is short and 0 if signals of strategies is not equal. First strategy This System was created from the Book "How I Tripled My Money In The Futures Market" by Ulf Jensen, Page 183. This is reverse type of strategies. The strategy buys at market, if close price is higher than the previous close during 2 days and the meaning of 9-days Stochastic Slow Oscillator is lower than 50. The strategy sells at market, if close price is lower than the previous close price during 2 days and the meaning of 9-days Stochastic Fast Oscillator is higher than 50. Second strategy Bear Power Indicator To get more information please see "Bull And Bear Balance Indicator" by Vadim Gimelfarb. WARNING: - For purpose educate only - This script to change bars colors.Pine Script® strategyby HPotter2263
Combo Strategy 123 Reversal & Bear Power This is combo strategies for get a cumulative signal. Result signal will return 1 if two strategies is long, -1 if all strategies is short and 0 if signals of strategies is not equal. First strategy This System was created from the Book "How I Tripled My Money In The Futures Market" by Ulf Jensen, Page 183. This is reverse type of strategies. The strategy buys at market, if close price is higher than the previous close during 2 days and the meaning of 9-days Stochastic Slow Oscillator is lower than 50. The strategy sells at market, if close price is lower than the previous close price during 2 days and the meaning of 9-days Stochastic Fast Oscillator is higher than 50. Second strategy Bear Power Indicator To get more information please see "Bull And Bear Balance Indicator" by Vadim Gimelfarb. WARNING: - For purpose educate only - This script to change bars colors.Pine Script® indicatorby HPotter2236
Bull&Bear Signals by uykusuzpenguenHow to use Bull&Bear Signals Script Purpose: We developed this indicator for short and middle term buyer and seller small inverstor. Scope of Script: This script should use stock markets and digital currency markets. We are not recommend this script for use in any other assets. General Approaching: While this script creating, mostly take support, highest high price & lowest low price, volume and RSI . We strongly recommending to use 4h,1d,1w time frame on the graph. Notation: Purple Point: If a bar volume more than volume moving average four times Grey Point : If a bar volume less than volume moving average four times Turquois Bar Color : If a bar RSI level more than 75 ( Overbought areas ) Purple Bar Color : If a bar RSI level less than 25 ( Oversell areas ) Note: We don’t want all your graphs filling text and line etc. But generally spectacular price movement become after that points. That’s why we think this notation will be usefull. Important Warning: Please do your risk management . This formula does not eliminate the possibility that it may mislead you in the next process. Take risk and set a stop-loss HIGH & LOW STRATEGY This scripts calculate previous 3 bar from current bar to prev. 26 bar highest high and lowest lowe price and drawing on board. This lines just like a bollinger band but not. If price closing upper line , price wants to down and if price closing bottom line , price wants to up, like a bollinger band. But we will not to use this script like this PRINCIPLE : For safety buy point ; Price should fall bottom line and again rise over the bottom line completely. For sell point ; Price should rise over the upper line and again fall the upper line completely. For Detailed Description in English : drive.google.com Detaylı Türkçe Anlatım için : drive.google.comPine Script® indicatorby uykusuzpenguen3344
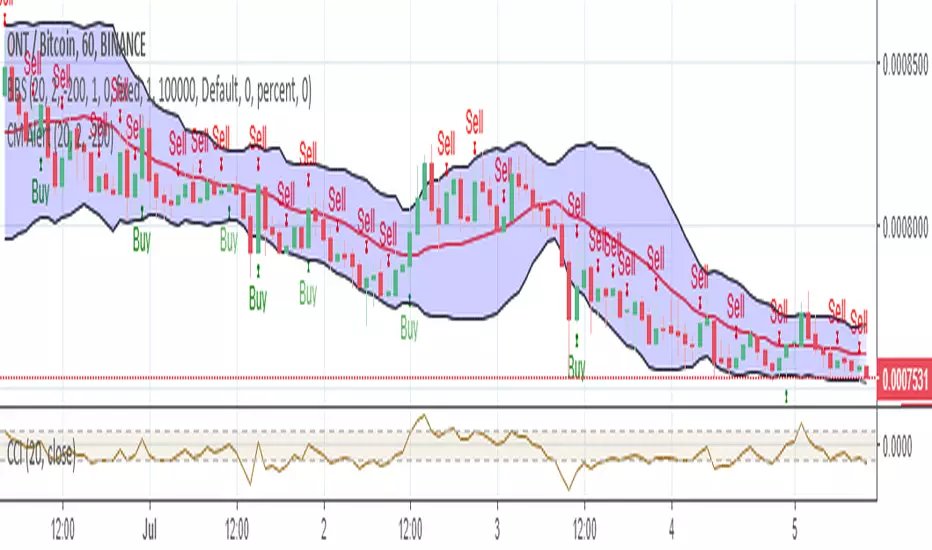
Bollinger Bear SniperThis script uses Bollinger Band but with different interpretation. The upper Bollinger Band is the resistant level, the lower Bollinger Band is the base or support level. The Commodity Channel Index (CCI) and the Bollinger Bandwidth helps us avoid high risk. The script identifies candles that are marking bold upward moves in prices and fires buy signal. Sales signals are fired when the candle closes in positive. The idea is to buy and sell on the same candle or next positively closed candle. This is anti-bear-anti-bags strategy. You either make profit or loss holding no bag. When you gain more than lose you are in business. This script is set to gain more than lose. We however offer no guarantee, expressed or implied. We are NOT responsible. Pine Script® strategyby azucoUpdated 3
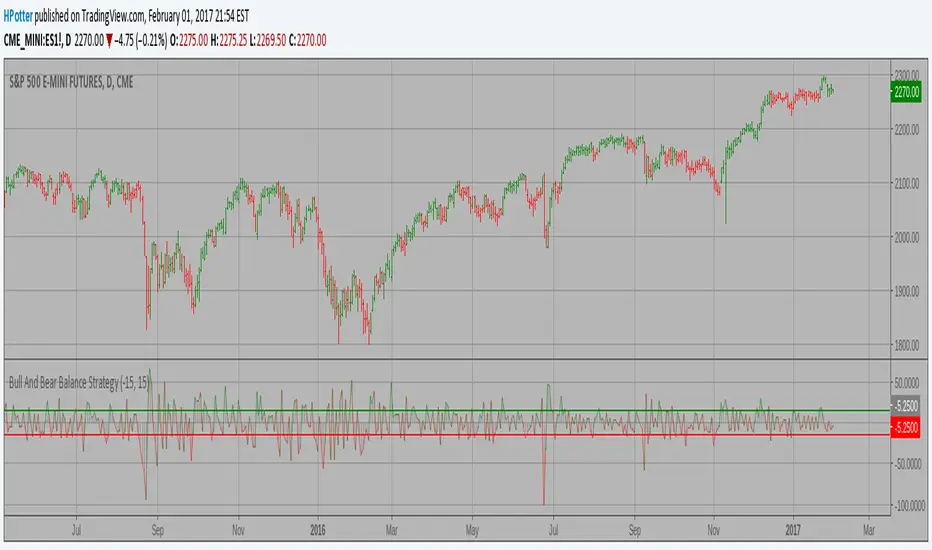
Bull And Bear Balance Strategy Backtest This new indicator analyzes the balance between bullish and bearish sentiment. One can cay that it is an improved analogue of Elder Ray indicator. To get more information please see "Bull And Bear Balance Indicator" by Vadim Gimelfarb. This modified strategy backtest from HPotterPine Script® strategyby HPotter95
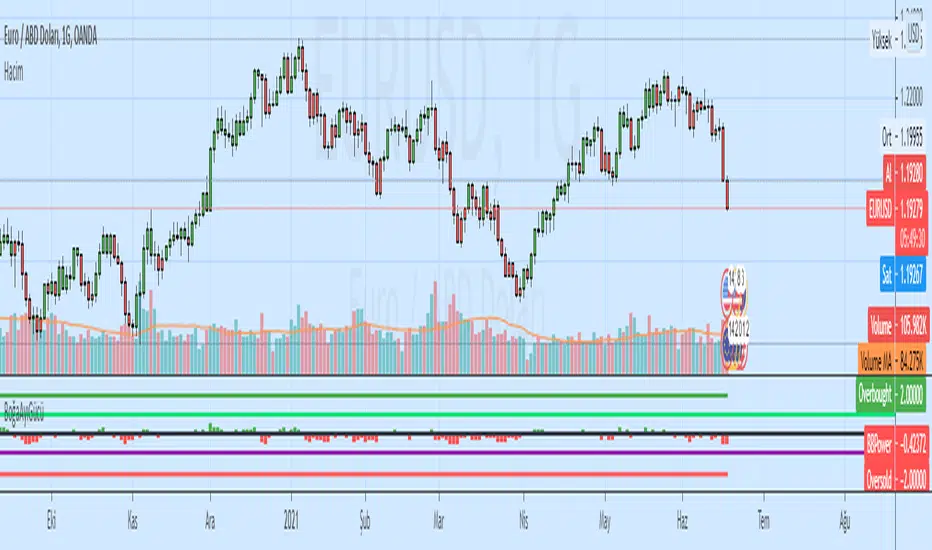
Bull And Bear Balance Strategy This new indicator analyzes the balance between bullish and bearish sentiment. One can cay that it is an improved analogue of Elder Ray indicator. To get more information please see "Bull And Bear Balance Indicator" by Vadim Gimelfarb. Pine Script® indicatorby HPotter44122
[RS]Linear Regression Bull and Bear Power Accumulation V1EXPERIMENTAL: Bull and Bear power based on linear regression (this is a non lagging oscillator, the parameter are for the lookup window for the donchian extremes) this indicator can also be used for convergence/divergence. (accidentjev2) added multi timeframe support (indicator may repaint values)Pine Script® indicatorby RicardoSantosUpdated 66 1.2 K