ndt Bull & Bearndt Bull & Bear là tìm hướng đi lên hay xuống; dễ dàng cho việc mua và bán. Chúc bạn nhiều may mắn. ndt cảm ơn mọi sự giúp đỡ của bạn để ra nhiều dụng cụ hỗ trợ các anh chị !!!! Chúc bình an.
Khi thấy mũi tên XANH chỉ lên là Mua (long);
Khi thấy mũi tên TRẮNG chỉ xuống là Bán (short)
=========================================
ndt Bull & Bear used to find the trend; it is easy to use as color and Arrow indication
When you see a Light BLUE arrow UP, indicate trending is UP (time to go long)
When you see a WHITE arrow pointing down, indicate trending is DOWN (Time to short)
ndt@copyright
tin & sang
Search in scripts for "bear"

Volume Bull & BearHello Trader,
thanks to the new request.security_lower_tf()-function we are able to calculate intrabar volume. So here is my approach.
Please be aware, that the selected resolution should always be smaller than the selected chart timeframe.
You can find the exact values for bullish and bearish volume in the data window.
Hope it helps some of you :)

MACD Multiple AlertsThis script help traders to catch bullish and bearish momentum. It creates an alert for 40 altcoins based on the MACD cross over and cross under.
The MACD input are adjustable in the settings and you can choose your favorite assets.
Simply add this indicator to the chart wait that if finish to load and then create an alert on the time frame of your choice.
Enjoy your trading
F_rank_01

Glow Node VolumeThis volume indicator overlays bullish and bearish bars so you can see exactly who's winning the fight
also includes an information box that reads the markets trend to tell you whether it's safe to enter and trade in which direction.
Display Info Box
This box is used to advise whether it's safe to take a trade and tell you what direction (Short / Long).
It analyses the market to find the trend, Then when there is a safe time to take a trade it will advise in the direction the market is trending.
Green / Red Dots
The dots on the top of the indicator give you a quick and easy way to see who's winning the fight buyers or sellers as an average over the last couple bars

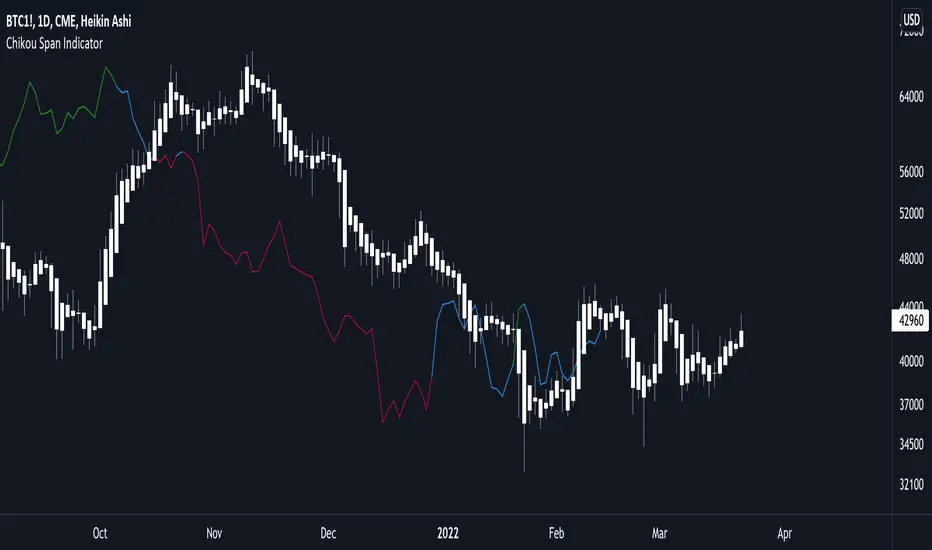
Ichimoku Chikou Lagging Span Bullish Bearish NeutralIchimoku Chikou Lagging Span Bullish Bearish Neutral
Money Flow Index With Bullish & Bearish SignalsMONEY FLOW INDEX WITH BULLISH AND BEARISH SIGNALS
Money Flow Index shows whether money is coming into the market or going out of the market. This can be used to gauge market sentiment and whether people are buying or selling at the current price.
***HOW TO USE***
If the MFI line is green, it is above the 50 line and in a bullish trend.
If the MFI line is red, it is below the 50 line and in a bearish trend.
If the background color is green, Money Flow is in a bullish trend, holding above the 50 line.
If the background color is red, Money Flow is in a bearish trend, holding below the 50 line.
If the MFI is above the 75 level it indicates a possible top or overbought conditions.
If the MFI is below the 25 level it indicates a possible bottom or oversold conditions.
***BULLISH/BEARISH LABELS***
There is also a label on the right side that tells you whether the overall trend is bullish or bearish, if there is a possible bottom or top and if the current money flow index is going up or down. This table updates in real time and changes colors so you can get an easy, quick interpretation of the current money flow without having to look at the data so you can make faster decisions on whether to enter or exit a trade. The flashing from red to green or the opposite also grabs your attention so you know immediately if there is a change in trend. The table changes colors in sync with the MFI line and it's trends and bottom/top areas. Green means money is coming in. Red means money is going out. Blue means a neutral amount of money flow.
***MARKETS***
This indicator can be used as a signal on all markets, including stocks, crypto, futures and forex.
***TIMEFRAMES***
This Money Flow Index indicator can be used on all timeframes.
***TIPS***
Try using numerous indicators of ours on your chart so you can instantly see the bullish or bearish trend of multiple indicators in real time without having to analyze the data. Some of our favorites are our Auto Fibonacci, DMI, Momentum, Auto Support And Resistance and Volume Profile in combination with this Money Flow Index. They all have real time Bullish and Bearish labels as well so you can immediately understand each indicator's trend.

Bull Bear Momentum (MYTRIC)█ What market information does this indicator tell you ?
Bull Bear Momentum(BBM) indicator is a combination of leading + lagging indicator.
• Leading Indicator are used to predict the next movement.
• Lagging Indicator are used to show the current movement.
The main purpose of BBM is to measure the factors that affect the rise and fall of stock prices, and thereby increase confidence on your trading.
We use an unique algorithm to separate the movement of each candlestick in the market to calculate the individual momentums between buyer and seller.
By using BBM, you will be able to know whether the current market is leading by buyers or sellers, and know what is the current trend.
Below is the function of indicator.
1 - The battle between buyers & sellers ⚔️
Momentum Balancing
【🟦 Buyer Leading The Market / 🟨 Seller Leading The Market】
2 - Buyer & Seller active 🔥 or inactive
【🟩 Buyer active / 🟥 Seller active】
3 - Buyer & Seller momentum strength 💪
BBM has a value between -20 to +50 and is used to measure the strength of current trend.
-20 ~ -10 = Very Weak Momentum
-09 ~ -05 = Weak Momentum
-04 ~ +00 = Lower Neutral Momentum (Downward Sideway / Ranging Market)
+00 ~ +05 = Upper Neutral Momentum (Upward Sideway / Ranging Market)
+06 ~ +15 = Strong Momentum
+16 ~ +50 = Very Strong Momentum
4 - AD Osc / Risk Osc (same as DT Smart Trend AD Osc)
██████████████████████████████████████████████████████████████████████████████████████████████████████████████████████
——————————————————————————————————————————————————————————————————————————————————————————————————————————————————
█ Benefits & Features
✅ Momentum Balancing
Momentum balancing is measure combination of momentums between buyer and seller
——————————————————————————————————————————————————————————————————————————————————————————————————————————————————
✅ Buyer & Seller / Bull & Bear Momentum
Analyze the momentums of the buyer and seller individually
🟩 Buyer Momentums
• 🟩 Buyer Momentums Active 🔥
• ⬜ Buyer Momentums inactive
🟥 Seller Momentums
• 🟥 Seller Momentums Active 🔥
• ⬜ Seller Momentums inactive
——————————————————————————————————————————————————————————————————————————————————————————————————————————————————
✅ Risk Oscillator / Accumulation & Distribution Oscillator
██████████████████████████████████████████████████████████████████████████████████████████████████████████████████████
——————————————————————————————————————————————————————————————————————————————————————————————————————————————————
█ CASE STUDY
*Length setting default as "10", this value determines the period of the algorithm.
The more common settings are 10 or 60.
Below settings are recommended for different trading style.
• Short-term trader / Swing trader = 8 ~ 14
• Mid-term trader = 20 ~ 60
• Long-term trader = 60 and above
• Example 01 (Downtrend) * We do not recommend trading in a downtrend, it is only suitable for swing trade or batch investment
• Example 02 (Weak Trend)
• Example 03 (Strong Trend)
██████████████████████████████████████████████████████████████████████████████████████████████████████████████████████
——————————————————————————————————————————————————————————————————————————————————————————————————————————————————
█ CASE STUDY OF DIVERGENCE ANALYSIS
• Ex 01
• Ex 02
██████████████████████████████████████████████████████████████████████████████████████████████████████████████████████
——————————————————————————————————————————————————————————————————————————————————————————————————————————————————
█ How to find super-trend by using BBM?
*Length setting change to "60"
1. Superbull (Potential Rate 90%) 🐮
• Buyer's momentum must greater than 10 = Strong Trend 🟩; in the meantime Seller's Momentum smaller than -5 = Weak Trend ⬜
• The potential for stock prices to rise 📈 is very large, which is 90% and above, refer example below.
2. Superbear (Potential Rate 90%) 🐻
• Seller's momentum must greater than 10 = Strong Trend 🟥; in the meantime Buyer's Momentum smaller than 0 = Weak Trend ⬜
• The potential for stock prices to fall 📉 is very large, which is 90% and above, refer example below.
• Example 01
• Example 02
• Example 03

Bias Pivot PointA simple indicator that uses Pivot Points as a filter and to generate a Directional Bias .
How to use this indicator?
1. Directional Bias
Bullish => Closing Price > Pivot Point
Bearish => Closing Price < Pivot Point
2. Support / Resistance
Each Pivot Points can be used as Support or Resistance
3. Take Profit Targets
Each Pivot Points can be used as targets for taking profit

20 SMA based Bull/Bear sentiment indicatorThis script is only doing one thing, plots the 20 SMA and based on whether the asset's price is above or below of the SMA it changes the color of the SMA and the background's color.
Helping it to visualize whether from the 20 SMA's point of view we are in a Bull or a Bear trend.
I created this because I myself use this SMA with Bitcoin on the weekly time frame to identify the macro trend on the weekly.
IMO this is a good crypto market sentiment indicator.

The Namib SpikeThank you to Karl S who coded my idea. Below are the trigger conditions. Testing would be welcomed. I have not looked at the effectivity on higher or lower timeframes. Feedback highly appreciated.
A 3-tiered alert/notification system:
Level 1 Alert (Pop-up notification "Level 1 Bullish Alert" or "Level 1 Bearish Alert"
1. Determine bullish or bearish trend of price above or below 200 EMA
2. RSI level (customizable level)
3. ADX (customizable level as well as option to filter that the current ADX value is higher/lower as 1,2,3,4,or 5 candles ago)
AND/OR
Level 2 Alert (Pop-up notification "Level 2 Bullish Alert" or "Level 2 Bearish Alert"
1. Determine bullish or bearish trend of price above or below 200 EMA
2. RSI level (customizable level)
3. ADX (customizable level as well as option to filter that the current ADX value is higher/lower as 1,2,3,4,or 5 candles ago)
4. Higher Timeframe trends for 2 higher Timeframes (price above/below 200EMA) agrees with current Timeframe
AND/OR
Level 3 Alert (Pop-up notification "Level 3 Bullish Alert" or "Level 3 Bearish Alert"
1. Determine bullish or bearish trend of price above or below 200 EMA
2. RSI level (customizable level)
3. ADX (customizable level as well as option to filter that the current ADX value is higher/lower as 1,2,3,4,or 5 candles ago)
4. Higher Timeframe trends for 2 higher Timeframes (price above/below 200EMA) agrees with current Timeframe
5. Percentage (customizable) from previous H1/H4/D1/W1's (customizable) high & low prices

RSI Average Swing BotThis is a modified RSI version using as a source a big length(50 candles) and an average of all types of sources for candle calculations such as ohlc4, close, high, open, hlc3 and hl2.
In this case we are going to use a 0-1 scale for an easier calculation, where 0.5 is going to be our middle point.
Above 0.5 we consider a bullish possibility.
Below 0.5 we consider a bearish possibility.
I made a small example bot using that initial logic, together with 2 exit points for long or short positions.
If there are any questions, let me know !

XTZ trading strategy for Bear monthsThis is my 3rd approach into trading XTZ. It is tuned into bear months and needs to work for at least 30 days.
It looks at the rebalance oscillator and bear market indicator and tries to find a position in the market that does not lose money within the month.
Use the cog icon to update the trading window to fit previous months, and check out the data window for its real performance. Do not rely on the Strategy Tester since this strategy is performing only with `strategy.order` making the values of the Strategy Tester irrelevant and inconsistent with its performance.

NSDT Bearish-Bullish CandlesThis is another interesting take on candlesticks . These Bearish-Bullish Candles do not show the wicks. Instead, the upper wick is made into a Red body and the lower wick is made into a Green body. If you match the candle body color in the chart settings (or turn off the candles completely), you get a unique way of seeing how Bearish or how Bullish a candle is because the wick will now match the body size and color.
This indicator is very similar to our NSDT Special High-Low Candles.

MTF Bullish/Bearish IndicatorThe script plots a bullish/bearish indicator by evaluating a variety of moving averages for a security across multiple timeframes. It's derived from built in Technical Analysis indicator published by TradingView. The result of evaluation is plotted on the chart in green light/red light format in a configurable location.
evaluated moving averages include
- SMA 10, 20, 30, 50, 100, 200
- EMA 10, 20, 30, 50, 100, 200
- Hull MA 9
- VWMA 20
- Ichimoku Cloud
moving averages are evaluated at chart timeframes and 5 min, 15 min, 30 min, 120 min, 240 min, and daily by default but can be customized.

Macd Divergence + MTF EMA MACD Divergence + Multi Time Frame EMA
This Strategy uses 3 indicators: the Macd and two emas in different time frames
The configuration of the strategy is:
Macd standar configuration (12, 26, 9) in 1H resolution
10 periods ema, in 1H resolution
5 periods ema, in 15 minutes resolution
We use the two emas to filter for long and short positions.
If 15 minutes ema is above 1H ema, we look for long positions
If 15 minutes ema is below 1H ema, we look for short positions
We can use an aditional filter using a 100 days ema, so when the 15' and 1H emas are above the daily ema we take long positions
Using this filter improves the strategy
We wait for Macd indicator to form a divergence between histogram and price
If we have a bullish divergence, and 15 minutes ema is above 1H ema, we wait for macd line to cross above signal line and we open a long position
If we have a bearish divergence, and 15 minutes ema is below 1H ema, we wait for macd line to cross below signal line and we open a short position
We close both position after a cross in the oposite direction of macd line and signal line
Also we can configure a Take profit parameter and a trailing stop loss

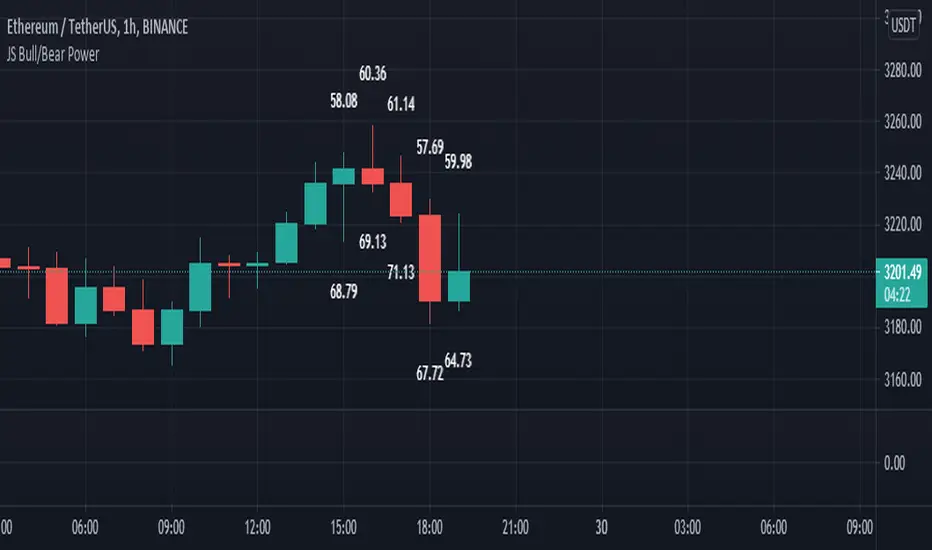
JS Bull/Bear PowerI created this Indicator for all chart lovers.
This Indicator measures the wick parts of candles and sum it up. Wick part of candle is a sign of strength that's why it measures the 60 bars of candles wick. then sum it up and converted it in percentage. The output is indicated in the last 10 candles. that's how simple this indicator is but very useful to analyze the strength of every candles.
The upper numbers is the bear power.
The lower numbers is the bull power.
Happy Trading
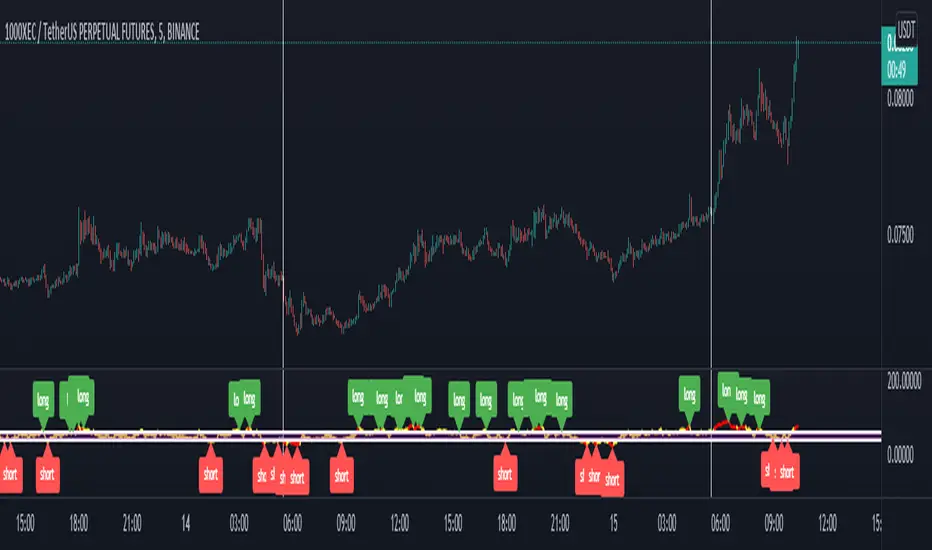
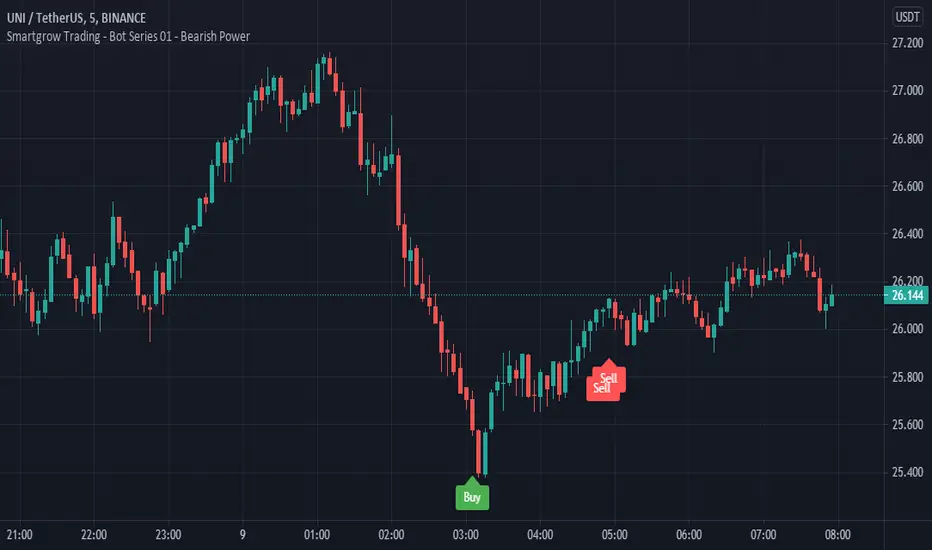
Smartgrow Trading - Bot Series 01 - Bearish PowerWelcome to our first Tradingview trading bot.
We develop signals which have been specially developed for crypto trading bots. We publish new indicators at regular intervals.
The main idea behind the bot is to use custom created indicators in a short and longer term timeframe to signal potential trendreversals in downtrends or ranging markets. The bot is not waiting for a trend confirmation signal before entering a trade, on the contrary, the bot waits for statistical extreme values to open a trade. When potential signals are detected we are trailing price to find the best spot to enter a trade. With this approach we buy in strong oversold areas as these have great potential to move in the other direction again. The sell signals are also generated by this custom indicator only selling off, if a stronger recovery in the market has occured. The potential profit margin is therefore between the best possible entry into a heavily oversold market and a recovery of the market.
So this tradingbot isnt designed to work with take profit, stop loss or trailing stop loss. This would result in a long term loss and is therefore not recommented. Also the bot is not tested in any other market like futures or stocks. So we recommend to use it in crypto spot market only.
Depending on market situations, potential losses can occur when a market is strongly bearish and does not want to recover over a long range, or when the bot has entered a trade to early. We have built in a safety mechanism for detecting further downtrends to avoid major losses. This mechanism is part of the needed risk management Therefore we are suggesting to use a proper risk management so only use 2-5% of your funds per trade. We use this bot with 2,5% funds per trade for our personal use. The study needs to be set up in the 5 min chart to work and you need to set up one buy alarm and one sell alarm per pair. The Signals are very picky therefore it is suitable to apply it on all possible pairs on your exchange excluding stable and shitcoins. You could test it in other financial markets but the bot was developed especially for crypto markets. If you have questions regarding pairs or want to see real life performance, feel free to contact us.
This indicator using different timeframes so it is sending a repainting warning. Cause it calculates values in a different timeframe. But thats normal and it wont recalculate results.
We sell this indicator so it is invite only. But of cause you can test it before buying.
If there are questions, write them into the comments or contact us directly over the direct message. Happy Trading!
Skript nur auf Einladung
Harmonic Pattern Educational Volume 0 (Source Code)This indicator was intended as educational purpose only for Harmonic Patterns using XABCD Pattern Tool.
Gartley and Butterfly patterns were ideal patterns explained from The Harmonic Trader written by Scott M Carney.
Some values are further updated later in Harmonic Trading: Volume Three, also by Scott M Carney.
The Harmonic Trader book was also known as Harmonic Trading: Volume Zero.
Usually Bullish Patterns show as "M" shape while Bearish Patterns show as "W" shape.
";" indicates range, example : 1.27;1.618 meaning that value between 1.27 to 1.618.
Indikator ini bertujuan sebagai pendidikan sahaja untuk Harmonic Pattern menggunakan XABCD Pattern Tool.
Pattern Gartley dan Butterfly, juga sebagai pattern ideal telah diterangkan dari buku The Harmonic Trader ditulis oleh Scott M Carney.
Beberapa nilai kemudiannya telah dikemaskini dalam Harmonic Trading: Volume Three, juga oleh Scott M Carney.
Buku The Harmonic Trader book juga dikenali sebagai Harmonic Trading: Volume Zero.
Kebiasaanya Bullish Pattern tunjuk sebagai bentuk "M" manakala Bearish Pattern tunjuk sebagai bentuk "W".
";" menunjukkan range, contoh : 1.27;1.618 bermaksud nilai 1.27 hingga 1.618.
Indicator features :
1. List XAB=CD patterns including ratio and reference page.
2. For desktop display only, not for mobile.
Kemampuan indikator :
1. Senarai XAB=CD pattern termasuk ratio and rujukan muka surat.
2. Untuk paparan desktop sahaja, bukan untuk mobile.
FAQ
1. Credits / Kredit
Scott M Carney, The Harmonic Trader
2. Pattern and Chapter involved / Pattern dan Bab terlibat
Bullish Ideal Gartley - Page 160
Bearish Ideal Gartley - Page 171
Bullish Ideal Butterfly - Page 194
Bearish Ideal Butterfly - Page 204
3. Code Usage / Penggunaan Kod
Free to use for personal usage but credits are most welcomed especially for credits to Scott M Carney.
Bebas untuk kegunaan peribadi tetapi kredit adalah amat dialu-alukan terutamanya kredit kepada Scott M Carney.
Bullish (M) / Bearish (W) Ideal Gartley
Bullish (M) / Bearish (W) Ideal Butterfly

Percentage Oscillator SwingThe percentage price oscillator (PPO) is a technical momentum indicator.
It shows the relationship between the close of a candle and the highest/lowest point with a specific lenght in percentage terms.
Rules
The higher percentage on the values upwards, compared to those downwards, the higher the power of the bull trend.
The higher percentage on the values downwards, compared to those upwards, the higher the power of the bear trend.

Bull and Bear Marubozus Candlestick PatternMarubozus are an interesting candle pattern wherein the close and open of the candle are also the high / low points of the candle. In other words, a candle with no shadows or wicks.
How reliable are they, though? Probably not very reliable on their own. It may also depend on the size of the candle. You would probably want to incorporate this candle pattern with other filters, like RSI, MACD, to filter trade opportunities.

[HuD] Fast Bull Bear This indicator based on mathematical algorithm of 2 fast ema lines.
The purpose is to see the overall trend of wheather Bull is stronger than Bear and vice versa.
This can assist traders to spots trends and reversals
Green Line = Bull Line
Red Line = MA Line of Bull
How to use this Indi :
Green Dot = Buy Signal
Red Dot = Sell Signal
Green Line Cross Up Level 0 = Strong Momentum ( represent by "⭐️" icon )
Green Line Cross Down Level 0 = Momentum Become Weak

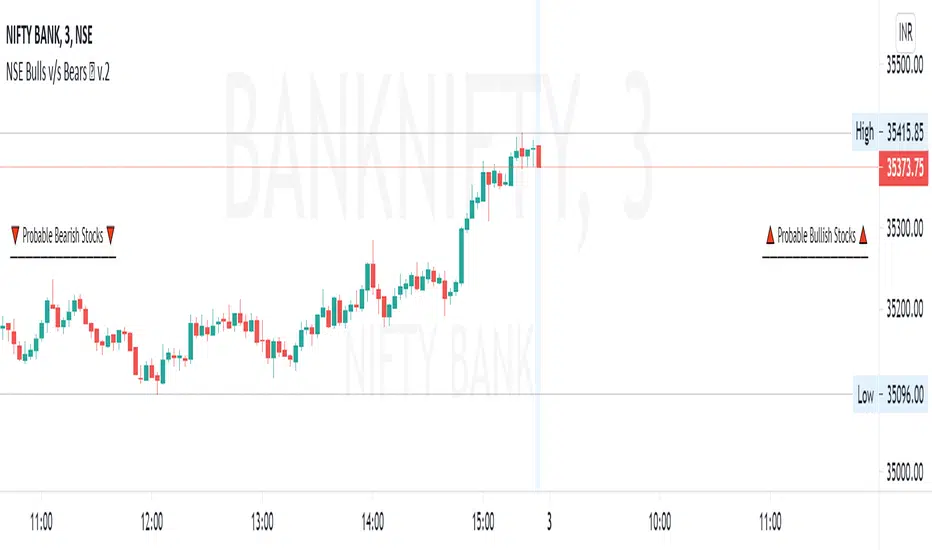
Nifty50 Bullish Bearish Scanner▪ How to use ?
The Screener has 40 stocks which are selected from NSE Nifty50 (list is given below) (cannot be editable) and after 9:15 am IST, it will scan most probable Bullish and Bearish stocks, both stocks will be labelled separately.
▪ Entry may be made at specified near the Stock name and target and SL is also mentioned nearby. Priority to be given to the stop-loss first. User can change profit percentage and Stop-loss percentage as per need, max. 10% can be done, default SL = 0.5% and Profit = 2%. Do use the indicator with other analysis, indicators, strategies, etc. Do not wait for target to hit, also use your calculations to book profit.
▪ How the figures are calculated ?
Conditions for Bullish and Bearish are calculated when trade day starts, and the default timeframe is for 1 Day (i.e.-Current Whole Day)
means the target and stop-loss are for intraday whole day, which can be changed to week, month, etc., Here Entry points are calculated depending upon the current days open price, with consecutive profit and stop-loss are calculated. The Percentage profit and stop-loss are
calculated including previous days price also, confusion to be avoided with figures.
▪ Caution :
If in morning any stock comes in any of list and if it goes from that list, that means the reversal took place for that stock(s) and stop-loss is hit. If any stock is opened Gap-Up or Gap-Down that it will come in either of the Bullish / Bearish stocks, then those stocks maybe
avoided.
▪ Which Nifty50 Stocks are included ?
Top 40 stocks from NSE Nifty50 are selected which are included are below =
ADANIPORTS, ASIANPAINT, AXISBANK, BAJAJ_AUTO, BAJFINANCE, BHARTIARTL, BPCL, BRITANNIA, CIPLA, DIVISLAB, DRREDDY,
EICHERMOT, GRASIM, HCLTECH, HDFC, HDFCBANK, HEROMOTOCO, HINDALCO, HINDUNILVR, ICICIBANK, INDUSINDBK, INFY
ITC, JSWSTEEL, KOTAKBANK, LT, M_M, MARUTI, RELIANCE, SBILIFE, SBIN, SUNPHARMA, TATACONSUM, TATAMOTORS, TATASTEEL
TCS, TECHM, TITAN, UPL, WIPRO.
▪ Indicator options :
Choice to hide bearish / bullish stocks labels, change background color of label, change text color of label, user can change position of label from the current bar, modify stop-loss and profit percentage.
▪ Alerts
You can create an alert from it easily. No additional configuration is required, message and alert on close is used the code.
The current timeframe candle is considered as alerts is set to once per bar close.
▪ Note: The initial load may be slow. If something doesn't seem to work, you can try the following:
- wait more time for it to load.
- hide & show or remove & add back to chart.
- don't add the indicator to chart multiple times in a short amount of time, as you may be rate limited
- Remember that majority of indicators fails in a sideways market, also every indicator is not 100% accurate.
▪ Disclaimer
Please remember that past performance may not be indicative of future results.
Due to various factors, including sudden changing market conditions, the indicator may not perform good.
This description and the indicator don’t provide any financial advice.