Search in scripts for "bear"
Market analysis panel MAP DejaVuTradesThe market analysis dashboard allows you to view multiple markets simultaneously to make a quick and timely decision.
You can add up to 6 markets per panel between Forex, Cryptos, Stocks, Futures, CFDs, Indices, and comparing their current state in any different timeframe in which you are currently, selecting it from its configuration.
Below is the explanation of each column of the panel.
►Title: Select the name of your panel grouping by type of market.
►Bullish or bearish market: Reference of the selected time frame indicating a green progress bar when the market trend is bullish, and red when the market is bearish, with the strength percentage.
►Variation by temporality: Current relationship with the close of the previous candle, depending on the selected temporality. indicating you in a green progress bar when the variation is positive, and red when the variation is negative, with their respective percentage.
►Nominal volume: it is a multiplication of the current volume with the current price, its immediate relationship is from the marketcap of the selected market with its respective value.
To view the values, simply put the mouse over the progress bar.

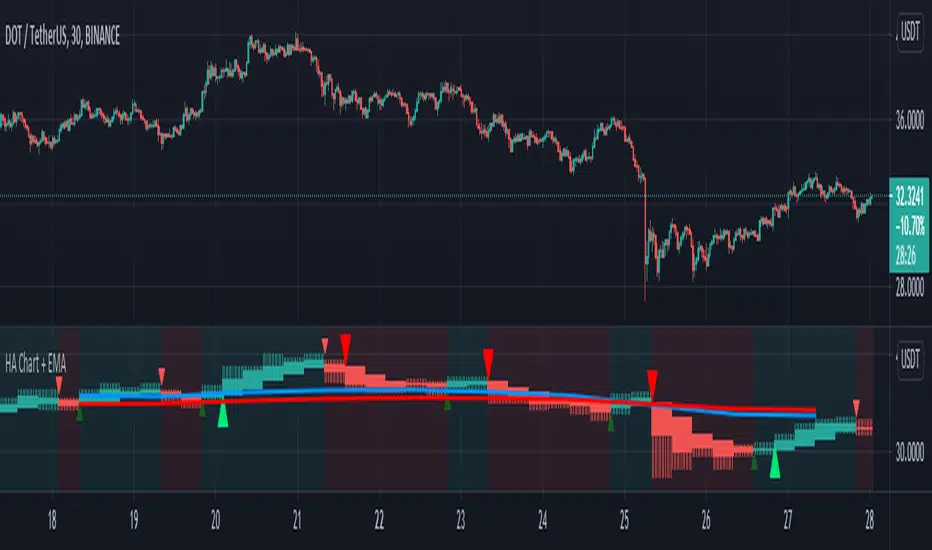
HA Chart with two EMA Trends and Signal Alert by GodtrixHi guys, how ya doing!
Benefits:
1) This tool is to add convenience of viewing HA chart at the same time with your main candle chart at different timeframe (resolution), so you save energy from switching between the candles and timeframe.
2) It comes with two seperate EMA:
a) 1day EMA trend lines set at length 10 & 20, this is the best setting ever for seeing long term trend.
-> Bull Trend - Blue line (10) above Red line (20) AND the same time price candle is above the Red line
-> Bear Trend - Red line (20) above Blue line (10) AND the same time price candle is below the Blue line
b) 2nd EMA trend lines for your own preference and conveniences. I use it at 2 hour timeframe, to help me decide for Entry/Exit orders, works great for me.
3) Provided with Singal Alert for Buy Sell Entry & Exit (This is not strategy, please study history and do your own calculation before following the Alert Signals)
There is two choices:
-> Normal Crossover - it simply alert you going from Red to Green or Green to Red candle
-> Strong Crossover with short Tail - This is a better version that checks on the candle size, tail size and body (open-close) size
If you want a complete Strategy, please go over to my script section, I've also published Strategy tool.
COINBASE:BTCUSD COINBASE:ETHUSD
Decomposed Average True RangeThis simple script decomposes the value of the Average True Range into a bullish component and a bearish component .
The script supports two plotting methods; Mirrored and Two Lines . If Mirrored is chosen, the indicator plots the bullish component as a positive number, and the bearish component as a negative number. If Two Lines is chosen, the indicator plots two lines, both of positive values. It is the same data, just visualized differently.
Side note: This is very similar to how the strength (average gain) part in the Relative Strength Index calculation works. However, the RSI uses the realized range (close - previous close) rather than true range. If we were to use the bullish component of the ATR as the average bullish gain part in the RSI calculation, and the bearish component of the ATR as the average bearish gain part in the RSI calculation, we would get very similar (but not equal) results to the standard RSI. This shows how the ATR and the RSI are related to each other.

[astropark] Fast Supply Demand Order Blocks FinderDear Followers,
today another awesome Analysis Tool, that you can use both for Swing and Scalping Trading: Fast Supply Demand Order Blocks Finder !
Every time it finds a bullish Order Block (Demand) or a bearish OB (Supply), it shows it immediatelly and when the OB is touched by price, an alert is triggered and a circle is displayed.
Keep in mind that trading Supply and Demand is quite easy:
short/sell at Supply (Bearish OB)
long/buy at Demand (Bullish OB)
short/sell if Demand (Bullish OB) gets broken
long/buy if Supply (Bearish OB) gets broken
This indicator has the resolution option , so you can checkout higher timeframes OBs, whatever timeframe you are.
Also you can refine the OBs finder algo fine tuning some filter options or you can just disable them all.
The indicator keeps track of all previous historic Supplies and Demands , but if too much are shown and you don't like it, you can just cut them by defining a specifc Analysis Starting Date/Time using the specific input options in the indicator settings.
Optionally you can also change lines' color and width, as well as enable/disable the OB hits circles.
Here below you can see some charts that shows how the indicator works on many timeframes, resolutions and markets.
XAUUSD 1h, using 6h resolution - part 1
XAUUSD 1h, using 6h resolution - part 2
XAUUSD 1h, using 6h resolution - part 3
BTCUSD 1h, without using resolution
EURUSD 5m, using 30m resolution
SPX500 5m, using 30m resolution
As I always says, all tools are great if you use them correctly: this is not the "Holy Grail", so always use proper money and risk management strategies.
This is a premium indicator , so send me a private message in order to get access to this script.

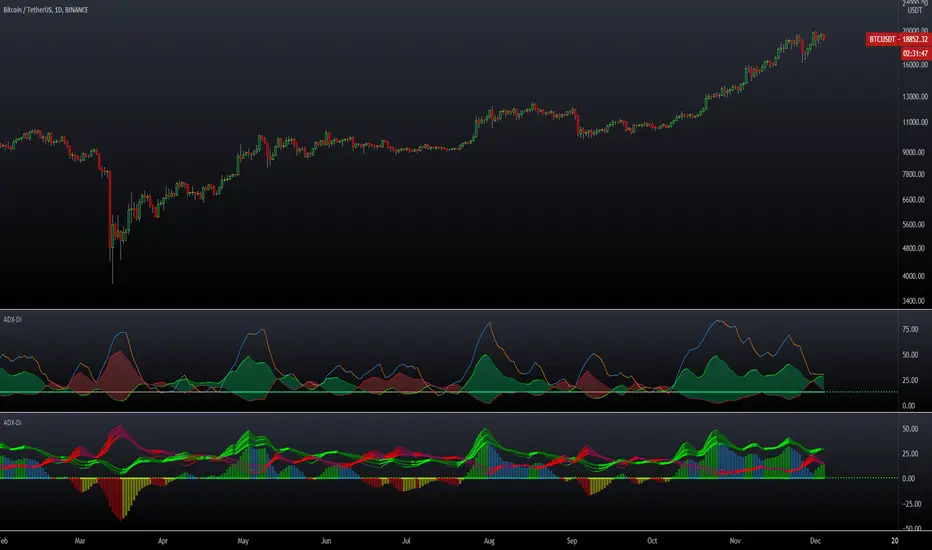
ADX DMI 3x - Dingue- ADX DMI DINGUE -
Français (bottom) / English
The best baddest - The Ultimate ADX DMI indicator for you to use.
Good to clearly see who's in control. Bear Bull
Includes :
- 3x ADX
- 3x DMI
- 3 line system which uses DMI calculation and put it in a single line instead of positive / negative.
Manual or Auto settings which adjusts length based on time frame used on screen.
Color coded for clear direction.
Squeeze shows when both sides are close together and this is when the trend might change or keep going.
Suggestions are welcome, ask below for any questions.
Try my other "DINGUE" indicators.
Thanks.
----------------- Français -----------------
Le meilleur, le plus génial - L'ultime indicateur ADX DMI pour votre utilisation
Très bon pour voir qui est en contrôle.
Inclu :
- 3x ADX
- 3x DMI
- 3 lignes qui remplace les lignes positives négatives du DMI pour une visualisation plus simple.
Paramétrage manuel ou automatique qui ajuste les valeurs selon la grandeur de chandelles utilisée à l'écran.
Codé avec des couleurs pour une visibilités de la direction claire.
Squeeze qui montre quand les 2 côtés sont près l'un de l'autre et quand un changement de contrôle ou une continuation de la tendance se produit.
Suggestions appréciées, pour toutes questions, écrire dans les commentaires plus bas.
Essayez les autres indicateurs "DINGUE".
Merci.
AM Bullish/Bearish Confluence IndicatorThis indicator is designed as an additional layer of confluence to the AM Trading Strategies. It is not meant to be relied on as a buy or sell indicator.
The indicator works by plotting swing high and swing low points across multiple timeframes. When price breaks the most recent swing high or swing low point in combination with price being above or below at least 3 major moving averages, a bullish or bearish indicator will be shown respectively.
The indicator is effective in trending markets but less effective in ranging markets.
All indicator colors can be modified in the settings.
The text can be removed in the settings for a more minimalist look.
There is also an alert function which can be used to send an alert when a bullish or bearish indicator becomes available.
The indicator works on all currency pairs, gold , oil , crypto, and stocks in a very similar way.
Use the link below to obtain access to this indicator.

Combined MA Trend FilterToday I propose a simple but an effective tool to use as a trend identifier.
It is simple because it doesn't require user to tinker with it and it works on all scripts and all time frames.
It is effective because it's based on what I believe to be the most used ma's by the traders who are successful and usually trade with large qty.
So, what's under the hood?
-It's a combination of MA's and its alpha multiplier to replicate effect of higher TF MA without producing the weird square shapes.
-We are utilizing the range between the two as a way to identify "noise areas" or "ranging areas" for the price action, where taking a trade might not be the best decision.
-As soon as bar starts closing above the both MA and its alpha multiplier, it is in strong bullish zone
-And as soon as bar start closing below the same we have a strong bearish zone.
-Bar Colour coding
Lime - Strong Bullish sentiment
Yellow - Weak Sentiment (Ranged area)
Red - Strong bearish sentiment
-This indicator works in two modes, one is noise mode and one is noiseless mode.
When we select noiseless mode, we are utilizing here a filter to reduce noise, which can be also plotted on chart and option for doing so is given in settings.
Some examples?
I've used alpha of 5 in above examples (You can change it to anything you want, depending on your script and TF)
As you can see, it produces far better filtering and keeps you out from possible "noise areas" when trading, it is also good at working as scaling in and out tool for purpose of maximizing the profits when you do catch the trend.
Please note that higher the alpha you use, you will be shifting to higher TF MA, while its difficult to have a set number of set TimeFrame effect replication, its best to keep the alpha multiplier value around 5.
Authors note:
This indicator is free to use for all, I'm only protecting the code to avoid people selling it to unsuspecting new users. It happens a lot on TV.
Past performance does not mean future profit and trader is responsible for his own losses or profits, author does not take any responsibility to wrong application of the tool provided here.
Have a profitable trading journey and enjoy~

TBT ForecasterThe TBT Forecaster is a visual representation of the "weather forecast" for the crypto market, mainly Bitcoin and ALT coins.
Purpose:
The reason behind creating this indicator is to help give crypto traders a sense of what to expect in crypto currency markets. In general, crypto markets (ALT coins) are extremely dependent on the price action and sentiment of Bitcoin. By knowing what to expect for both BTC and ALT markets, crypto traders will have an edge on other traders by:
knowing when it's a good time to run BTC or stable coin pairs for bots on 3Commas
knowing when the ALT market is in a Bullish or Bearish mood
knowing if we're in a true ALT season or not
knowing if they should be focusing more on active trading on the BTC or stable coin market
Time Frame:
The TBT Forecaster can be viewed on any time frame, but it was originally designed to work off of the 6-hour time frame. Note that faster (higher) time frames can make the tool somewhat unreliable since faster (higher) time frames are subject to more sudden, volatile movements compared to the 6-hour or Daily time frames. To help users of the TBT Forecaster keep a healthy perspective, the indicator can be set to "same as symbol" (the indicator will adapt to any time frame you use) or "6 hours" (the original and intended time frame).
Metrics:
The two lines of the indicator represent Bitcoin (top) and ALT coins (below). The TBO Forecaster uses information derived from the price of Bitcoin, Bitcoin price volatility, moving averages, ATR (Average True Range), Bitcoin Dominance, and the ALT coin indexes (TOTAL2 and OTHERS). All of these metrics are combined and weighted into a system that quantifies the market sentiment for BTC and ALTs.
Sentiment:
The TBT Forecaster shows a gradient of market sentiment, from Bearish to Bullish. These market sentiment labels consist of a variety of different metrics that have to do with volume, price action, and several indices. The full gradient of sentiment is:
Bearish
Weak Bearish (ALT line only)
Neutral
Weak Bullish
Bullish
Realistic Expectations:
Note that it is impossible and unrealistic for the ALTs line to represent every single ALT coin/token/chart/symbol on every exchange. In my experience, there are always good charts to trade no matter what Bitcoin is doing. However, if we as traders know that ALTs are Bearish, then we can focus our efforts on trading Bitcoin (or just staying out of the ALT market until conditions change).
Use the link below to obtain access to this indicator

Future Put bear spread indicatorFuture Put bear spread indicator developed by Chobotaru Brothers.
You need to have basic knowledge in option trading to use this indicator!
This spread is a DEBIT SPREAD.
The indicator shows P&L lines of the options strategy. Use only for futures since the mathematical model of options for Future instruments is different from stocks. Plus, the days' representation in futures is also different from stocks (stocks have fewer days than futures ).
***Each strategy in options is based on different mathematical equations, use this indicator only for the strategy in the headline.***
What does the indicator do?
The indicator is based on the Black-Scholes model, which uses partial differential equations to determine the option pricing. Due to options non-linear behavior, it is hard to visualize the option price. The indicator calculates the solutions of the Black-Scholes equation and plots them on the chart so traders can view how the option pricing will behave.
How the indicator does it?
The indicator uses five values (four dominants and one less dominant) to solve the Black-Scholes equation. The values are stock price, the strike price of the option, time to expiration, risk-free interest rate, and implied volatility .
How the indicator help the users?
-View the risks and rewards so you can know the profit targets in advance which means you can compare different options in different strikes.
-View the volatility change impact so you can know the risk and the P&L changes in case of a change in the volatility over the life of the option before you enter the trade.
-View the passage of time impact so you can know where and when you could realize a profit.
-Multi-timeframes so you can stay on the same chart (Daily and below).
All these features are to help the user improve his analysis while trading options.
How to use it?
The user needs to obtain from the “option chain” the following inputs:
- Put spread price (Debit): The debit paid for one unit of options strategy.
-Instrument price when entered spread: the stock price when you enter the options strategy.
-Upper strike price: the upper strike price of the options strategy.
-Lower strike price: the lower strike price of the options strategy.
-Interest rate: find the risk-free interest rate from the U.S. DEPARTMENT OF THE TREASURY. Example: for 2% interest rate, input: 0.02.
-Days to expire: how many days until the option expires.
-Volatility: the implied volatility of the option bought/sold. Example: for 45% implied volatility , input: 0.45.
-Day of entry: A calendar day of the month that the option bought/sold.
-Month of entry: Calendar month the option bought/sold.
-Year of entry: Calendar year the option bought/sold.
-% of Max Profit/Loss: Profit/loss line defined by the user. Minimum input (-0.95) ; maximum input (0.95).
Example: In this spread, -0.95 means, 95% of the options strategy maximum loss is reached and, 0.95 means, 95% of the options strategy maximum profit is reached.
After entering all the inputs, press Ok and you should see “Calculation Complete” on the chart.
The user should not change the entry date and days to expire inputs as time passes after he entered the trade.
How to access the indicator?
Use the link below to obtain access to the indicator

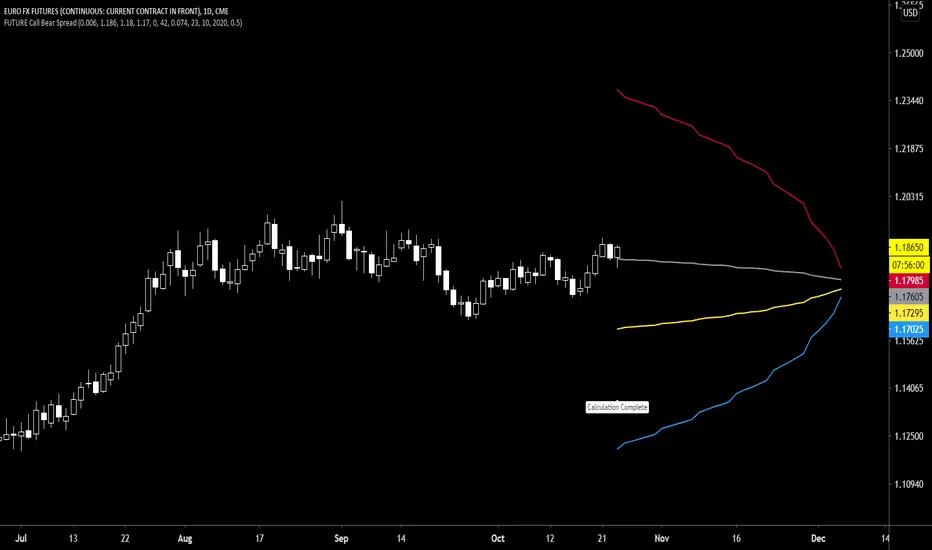
Future Call Bear Spread indicatorFuture Call bear spread indicator developed by Chobotaru Brothers.
You need to have basic knowledge in option trading to use this indicator!
This spread is a CREDIT SPREAD.
The indicator shows P&L lines of the options strategy. Use only for futures since the mathematical model of options for Future instruments is different from stocks. Plus, the days' representation in futures is also different from stocks (stocks have fewer days than futures ).
***Each strategy in options is based on different mathematical equations, use this indicator only for the strategy in the headline.***
What does the indicator do?
The indicator is based on the Black-Scholes model, which uses partial differential equations to determine the option pricing. Due to options non-linear behavior, it is hard to visualize the option price. The indicator calculates the solutions of the Black-Scholes equation and plots them on the chart so traders can view how the option pricing will behave.
How the indicator does it?
The indicator uses five values (four dominants and one less dominant) to solve the Black-Scholes equation. The values are stock price, the strike price of the option, time to expiration, risk-free interest rate, and implied volatility .
How the indicator help the users?
-View the risks and rewards so you can know the profit targets in advance which means you can compare different options in different strikes.
-View the volatility change impact so you can know the risk and the P&L changes in case of a change in the volatility over the life of the option before you enter the trade.
-View the passage of time impact so you can know where and when you could realize a profit.
-Multi-timeframes so you can stay on the same chart (Daily and below).
All these features are to help the user improve his analysis while trading options.
How to use it?
The user needs to obtain from the “option chain” the following inputs:
- Call spread price (Credit): The credit received for one unit of options strategy.
-Instrument price when entered spread: the stock price when you enter the options strategy.
-Upper strike price: the upper strike price of the options strategy.
-Lower strike price: the lower strike price of the options strategy.
-Interest rate: find the risk-free interest rate from the U.S. DEPARTMENT OF THE TREASURY. Example: for 2% interest rate, input: 0.02.
-Days to expire: how many days until the option expires.
-Volatility: the implied volatility of the option bought/sold. Example: for 45% implied volatility , input: 0.45.
-Day of entry: A calendar day of the month that the option bought/sold.
-Month of entry: Calendar month the option bought/sold.
-Year of entry: Calendar year the option bought/sold.
-% of Max Profit/Loss: Profit/loss line defined by the user. Minimum input (-0.95) ; maximum input (0.95).
Example: In this spread, -0.95 means, 95% of the options strategy maximum loss is reached and, 0.95 means, 95% of the options strategy maximum profit is reached.
After entering all the inputs, press Ok and you should see “Calculation Complete” on the chart.
The user should not change the entry date and days to expire inputs as time passes after he entered the trade.
How to access the indicator?
Use the link below to obtain access to the indicator
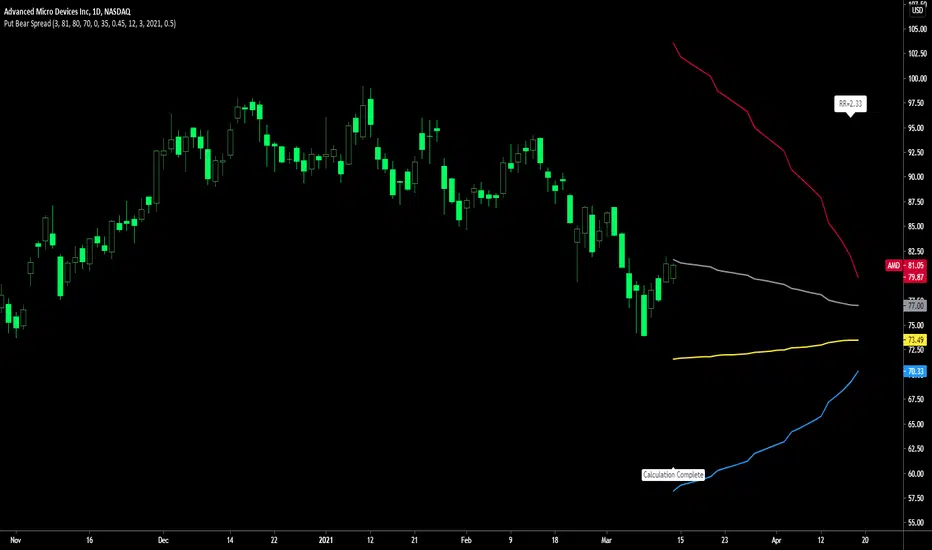
Put Bear Spread indicatorPut bear spread indicator developed by Chobotaru Brothers.
You need to have basic knowledge in option trading to use this indicator!
This spread is a DEBIT SPREAD.
The indicator shows P&L lines of the options strategy. Use only for stocks since the mathematical model of options for Future instruments is different from stocks. Plus, the days' representation in futures is also different from stocks (stocks have fewer days than futures ).
***Each strategy in options is based on different mathematical equations, use this indicator only for the strategy in the headline.***
What does the indicator do?
The indicator is based on the Black-Scholes model, which uses partial differential equations to determine the option pricing. Due to options non-linear behavior, it is hard to visualize the option price. The indicator calculates the solutions of the Black-Scholes equation and plots them on the chart so traders can view how the option pricing will behave.
How the indicator does it?
The indicator uses five values (four dominants and one less dominant) to solve the Black-Scholes equation. The values are stock price, the strike price of the option, time to expiration, risk-free interest rate, and implied volatility .
How the indicator help the users?
-View the risks and rewards so you can know the profit targets in advance which means you can compare different options in different strikes.
-View the volatility change impact so you can know the risk and the P&L changes in case of a change in the volatility over the life of the option before you enter the trade.
-View the passage of time impact so you can know where and when you could realize a profit.
-Multi-timeframes so you can stay on the same chart (Daily and below).
All these features are to help the user improve his analysis while trading options.
How to use it?
The user needs to obtain from the “option chain” the following inputs:
- Put spread price (Debit): The debit paid for one unit of options strategy.
-Instrument price when entered spread: the stock price when you enter the options strategy.
-Upper strike price: the upper strike price of the options strategy.
-Lower strike price: the lower strike price of the options strategy.
-Interest rate: find the risk-free interest rate from the U.S. DEPARTMENT OF THE TREASURY. Example: for 2% interest rate, input: 0.02.
-Days to expire: how many days until the option expires.
-Volatility: the implied volatility of the option bought/sold. Example: for 45% implied volatility , input: 0.45.
-Day of entry: A calendar day of the month that the option bought/sold.
-Month of entry: Calendar month the option bought/sold.
-Year of entry: Calendar year the option bought/sold.
-% of Max Profit/Loss: Profit/loss line defined by the user. Minimum input (-0.95) ; maximum input (0.95).
Example: In this spread, -0.95 means, 95% of the options strategy maximum loss is reached and, 0.95 means, 95% of the options strategy maximum profit is reached.
After entering all the inputs, press Ok and you should see “Calculation Complete” on the chart.
The user should not change the entry date and days to expire inputs as time passes after he entered the trade.
How to access the indicator?
Use the link below to obtain access to the indicator
Call Bear Spread indicatorCall bear spread indicator developed by Chobotaru Brothers.
You need to have basic knowledge in option trading to use this indicator!
This spread is a CREDIT SPREAD.
The indicator shows P&L lines of the options strategy. Use only for stocks since the mathematical model of options for Future instruments is different from stocks. Plus, the days' representation in futures is also different from stocks (stocks have fewer days than futures ).
***Each strategy in options is based on different mathematical equations, use this indicator only for the strategy in the headline.***
What does the indicator do?
The indicator is based on the Black-Scholes model, which uses partial differential equations to determine the option pricing. Due to options non-linear behavior, it is hard to visualize the option price. The indicator calculates the solutions of the Black-Scholes equation and plots them on the chart so traders can view how the option pricing will behave.
How the indicator does it?
The indicator uses five values (four dominants and one less dominant) to solve the Black-Scholes equation. The values are stock price, the strike price of the option, time to expiration, risk-free interest rate, and implied volatility .
How the indicator help the users?
-View the risks and rewards so you can know the profit targets in advance which means you can compare different options in different strikes.
-View the volatility change impact so you can know the risk and the P&L changes in case of a change in the volatility over the life of the option before you enter the trade.
-View the passage of time impact so you can know where and when you could realize a profit.
-Multi-timeframes so you can stay on the same chart (Daily and below).
All these features are to help the user improve his analysis while trading options.
How to use it?
The user needs to obtain from the “option chain” the following inputs:
- Call spread price (Credit): The credit received for one unit of options strategy.
-Instrument price when entered spread: the stock price when you enter the options strategy.
-Upper strike price: the upper strike price of the options strategy.
-Lower strike price: the lower strike price of the options strategy.
-Interest rate: find the risk-free interest rate from the U.S. DEPARTMENT OF THE TREASURY. Example: for 2% interest rate, input: 0.02.
-Days to expire: how many days until the option expires.
-Volatility: the implied volatility of the option bought/sold. Example: for 45% implied volatility , input: 0.45.
-Day of entry: A calendar day of the month that the option bought/sold.
-Month of entry: Calendar month the option bought/sold.
-Year of entry: Calendar year the option bought/sold.
-% of Max Profit/Loss: Profit/loss line defined by the user. Minimum input (-0.95) ; maximum input (0.95).
Example: In this spread, -0.95 means, 95% of the options strategy maximum loss is reached and, 0.95 means, 95% of the options strategy maximum profit is reached.
After entering all the inputs, press Ok and you should see “Calculation Complete” on the chart.
The user should not change the entry date and days to expire inputs as time passes after he entered the trade.
How to access the indicator?
Use the link below to obtain access to the indicator

[SCL] True Market StructureSee market structure at a glance with Higher Highs and Lower Lows. Bullish/Bearish/Ranging market bias is automatically derived. Optionally get alerted for breaks in market structure. Uses true Local Highs/Lows instead of simply the highest/lowest "pivot" for x bars. Can be useful as a support for learning market structure or for alerts for a change in structure while you're not at the computer.

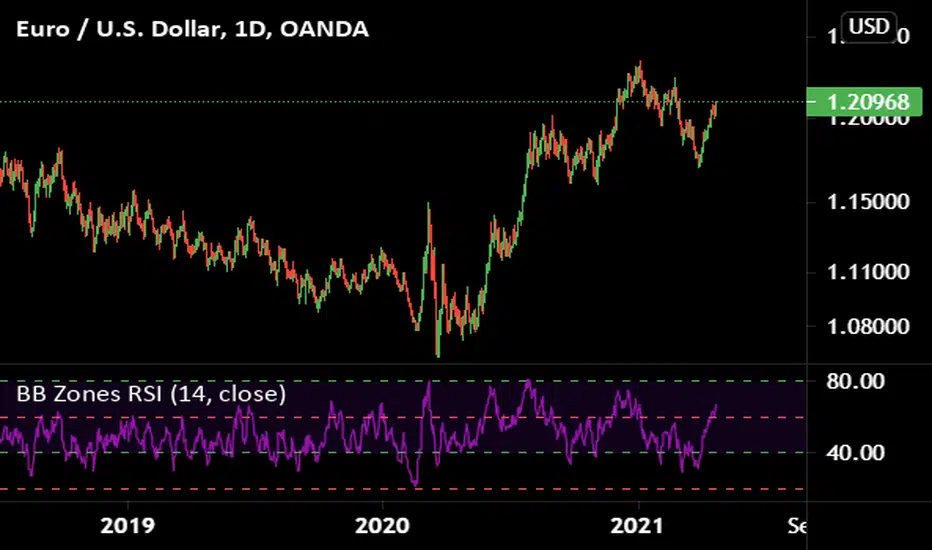
RSI + MFI - Crypto Bull and Bear market A fancy styled version of the RSI (Relative Stochastic Index) + MFI (Money Flow Index) oscillators in order to emphasize buy and sell opportunities.
The 80 and 20 Bands are meant to be used in Bull or Bear markets. Better performing in D timeframes.
The circles represent the cross between RSI and MFI .
Designed for Crypto Markets
Thanks @micheleprandina
Credits:

CCI Bearish BullishCommodities Channel Index and Bearish Harami, Bearish Engulfing, Bullish Harami, Bullish Engulfing.

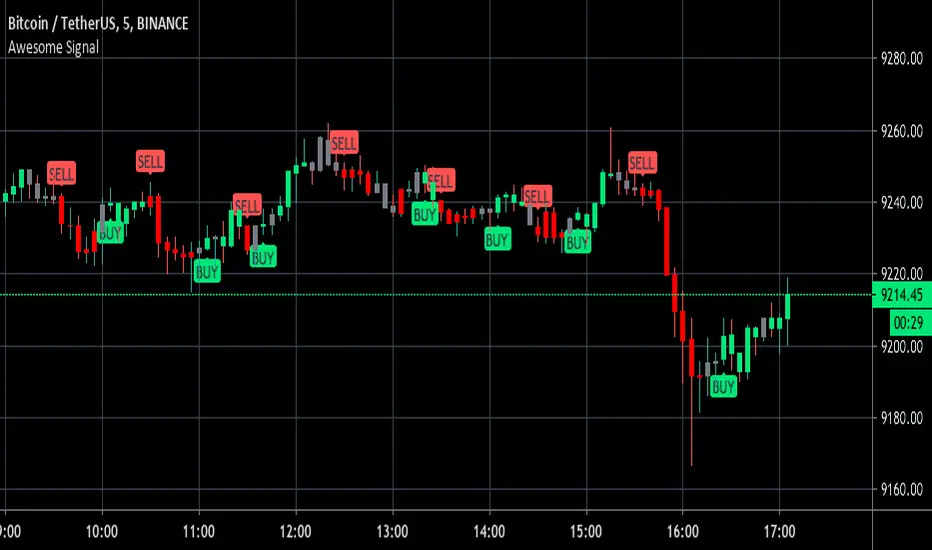
Awesome Buy/Sell SignalBuy and Sell signals using Bill William oscillators. Works for anything with high volume both crypto and stocks.
Optimal at Lower time frames and larger time frames can give you trend.
Green painted bars bullish momentum
Grey painted bars undecided momentum
Red painted bars bearish momentum.
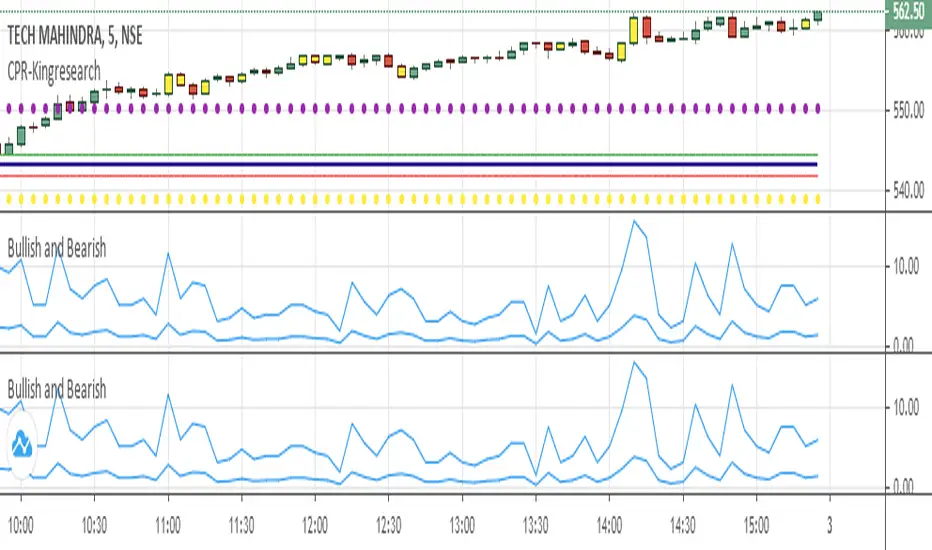
Bullish and Bearish 4This is for finding bullish and bearish candles
*** USE AT YOUR OWN RISK ***
Description:
This script finds the bullish and bearish candles for risk free entries
Setup:
the system works better in 5 min timeframe. alerts are given on the formation of bullish and bearish candles.
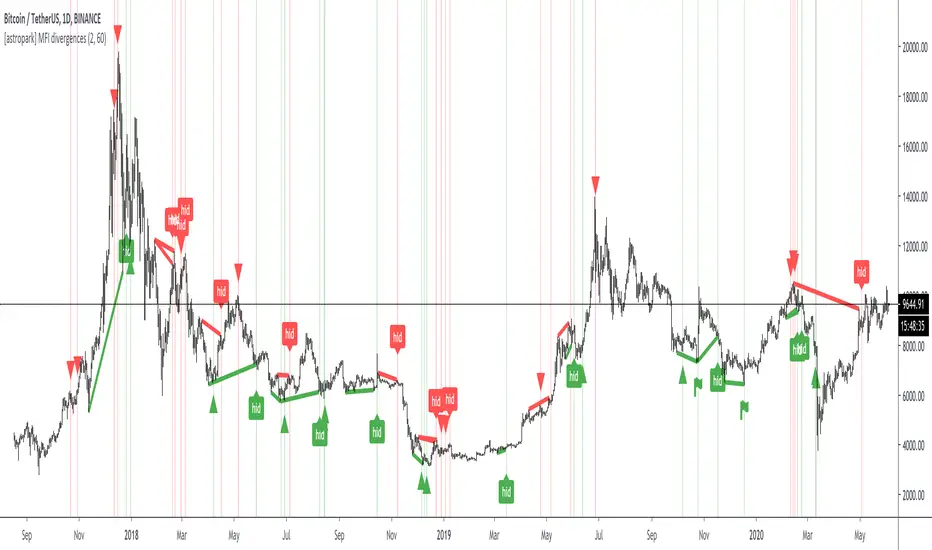
[astropark] MFI divergencesDear Followers,
today a new great Scalper Tool , based on a custom version of Money Flow (MFI) oscillator, which works on both Candlesticks, Heiking Ashi and Renko charts , from 1 second Renko chart and above (on non Renko charts, the higher, the better of course!), both on FOREX, Cryptocurrencies, Stocks and Commodities!
This tool has some cool features:
it works on all timeframes , on both Renko, Heikin Ashi and Candlesticks chart
it shows you both bullish and bearish divergences with a triangle up or down respectively
when it finds a strong bullish/bearish divergence , a flag will be displayed instead of a triangle
it shows you both hidden bullish and bearish divergences with a label "hid"
This script will let you set all notifications you may need in order to be alerted on each triggered divergence.
You may like to use it together with my Renko OBV Divergences indicator (which works on Candlesticks and Heiking Ashi too)
and my Renko RSI Divergences indicator (which works on Candlesticks and Heiking Ashi too)
On Bitmex/ByBit/Binance Bitcoin/USD chart best Renko settings is Traditional Renko chart with 11$ box size, while 0.5$ box size is suggested on Ethereum/USD pair.
This is a premium indicator , so send me a private message in order to get access to this script.
Combo Backtest 123 Reversal & Elder Ray (Bear Power) This is combo strategies for get a cumulative signal.
First strategy
This System was created from the Book "How I Tripled My Money In The
Futures Market" by Ulf Jensen, Page 183. This is reverse type of strategies.
The strategy buys at market, if close price is higher than the previous close
during 2 days and the meaning of 9-days Stochastic Slow Oscillator is lower than 50.
The strategy sells at market, if close price is lower than the previous close price
during 2 days and the meaning of 9-days Stochastic Fast Oscillator is higher than 50.
Second strategy
Developed by Dr Alexander Elder, the Elder-ray indicator measures buying
and selling pressure in the market. The Elder-ray is often used as part
of the Triple Screen trading system but may also be used on its own.
Dr Elder uses a 13-day exponential moving average (EMA) to indicate the
market consensus of value. Bull Power measures the ability of buyers to
drive prices above the consensus of value. Bear Power reflects the ability
of sellers to drive prices below the average consensus of value.
Bull Power is calculated by subtracting the 13-day EMA from the day's High.
Bear power subtracts the 13-day EMA from the day's Low.
You can use in the xPrice any series: Open, High, Low, Close, HL2, HLC3, OHLC4 and ect...
WARNING:
- For purpose educate only
- This script to change bars colors.

Combo Strategy 123 Reversal & Elder Ray (Bear Power) This is combo strategies for get a cumulative signal.
First strategy
This System was created from the Book "How I Tripled My Money In The
Futures Market" by Ulf Jensen, Page 183. This is reverse type of strategies.
The strategy buys at market, if close price is higher than the previous close
during 2 days and the meaning of 9-days Stochastic Slow Oscillator is lower than 50.
The strategy sells at market, if close price is lower than the previous close price
during 2 days and the meaning of 9-days Stochastic Fast Oscillator is higher than 50.
Second strategy
Developed by Dr Alexander Elder, the Elder-ray indicator measures buying
and selling pressure in the market. The Elder-ray is often used as part
of the Triple Screen trading system but may also be used on its own.
Dr Elder uses a 13-day exponential moving average (EMA) to indicate the
market consensus of value. Bull Power measures the ability of buyers to
drive prices above the consensus of value. Bear Power reflects the ability
of sellers to drive prices below the average consensus of value.
Bull Power is calculated by subtracting the 13-day EMA from the day's High.
Bear power subtracts the 13-day EMA from the day's Low.
You can use in the xPrice any series: Open, High, Low, Close, HL2, HLC3, OHLC4 and ect...
WARNING:
- For purpose educate only
- This script to change bars colors.

Separated ATR - evoThis script plots two ATR (Average True Range) values, one based on only bullish and the other based on only bearish bars. If the current bar is positive, the negative ATR will use its last known negative bar for the calculation. You can smooth bar directions by using the Heikin Ashi setting.
Use this the same way how you would use the regular ATR indicator, but with the added value of knowing which side of the market has more volatility.

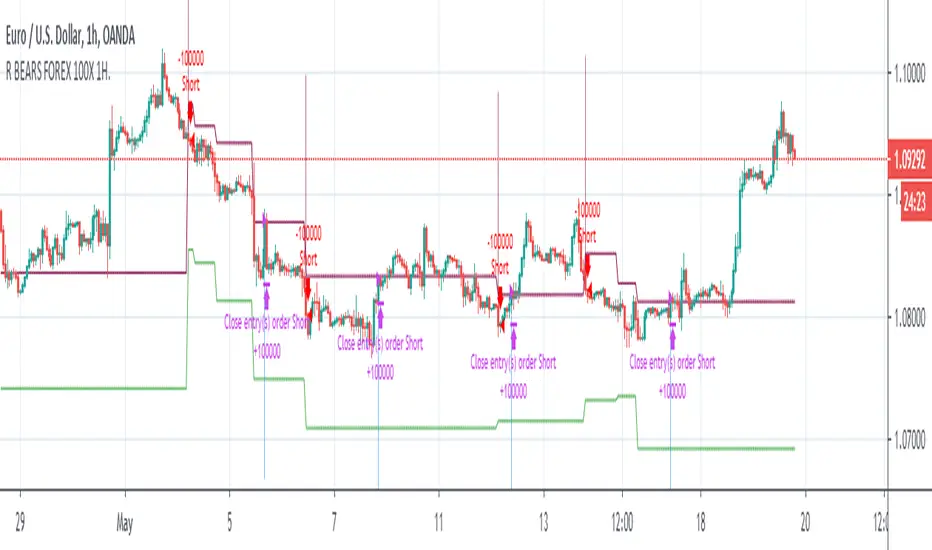
Relativity BEARS FOREX 100X 1H AlgorithmHi,
This system is prepared only for leveraged markets and only for Forex.
System parameters:
Timeframe = 1H (1 Hours)
Leverage = 100X
Position Size = %1 (0.01) Each Trade
System features :
- It targets the Risk /Reward Ratio of 1/3 and above. (Risk/Reward Ratio >= 3 )
- If a Take Profit Point has come in a successful trade but the parameter conformity has not deteriorated, system continues the trade.
- In this way, you can catch strong short trends several times a year.
But it is strict as stop-loss and avoids large declines,whipsaws whenever possible.
- The system tries to avoid unnecessary processes as much as possible.
This means less commission and less sideways market.
- Since it takes advantage of the reverse market, it is suitable not only for long and short but only for short position, ie "bears".
But this neutralizes unnecessary processes.
- Stop-Loss points and Take Profit (TP) points are shown in red and green.
-However, if there is a small amount of follow-up available at the computer, it is recommended to put stop-loss only.
Because the system revises both stop-loss and take profit points according to the conditions formed.
Doing this in the right major long trend here allows you to be in trades.
-The system takes into account the risk and only opens transactions where the value corresponding to 100 leverage ratio is greater than the risk.
This provides as much protection from risk as possible.
-Alerts added.
***Since it is located in the most risky market, the forex market, a balanced algorithm has been optimized, considering that it has a very unstable structure similar to dilithrium crystals (same logic as investment bank trader test).
So if this algorithm was a person, it would be an incredibly disciplined but equally skeptical person =)
Also, like other systems, this system also uses ANN (Artificial Neural Networks).
About Backtest :
Since this system is for leveraged market, backtest results are not healthy.
But since it targets the 1/3 Risk Reward Rate (3.00),
we must look Ratio Avg Win/Loss and it must be over 0.5 because :
This ratio means: When we reach 33% of our correct trades in all our trades, we are at breakeven.
This is 100 - 33 = 66
33/66 = 0.5
So whenever this rate is over 0.5, we make a profit.
*** The fact that this ratio must over 0.75 (worst scenario) in terms of securing ourselves because there will be extra comission fees for worst scenario.
Above this ratios ,we can do successful snowball trades.
And we achieve success cumulatively.
Important Note : This system is prepared only for these parameters.
NOTE :
The system has been prepared as a strategy to present success in a transparent manner.
Please check "Ratio Avg . Win / Avg Loss" rates in backtests.
Important Note 2 -
Although the system revises the stop and take profit points in the required parameters, the most accurate place is when the signal comes.
It should be entered when the signal comes as much as possible and if this did not happen,
trade must be opened in the nearest bars after the signal comes.
Best regards.
EDIT : Comission added. (%0.1)