Bull Bear Trend IndicatorIntroduction: Origin of the Swing Point Indicator
In the quest for a reliable indicator that accurately predicts trend directions and identifies valid highs and lows, the genesis of the Swing Point Indicator emerged. Faced with the challenge of finding a tool that provided comprehensive market analysis and actionable insights, the need for a novel solution became evident. Combining insights gleaned from market analysis and innovative algorithmic approaches, the Swing Point Indicator was born.
Enhanced Feature: Highs and Lows Labeling in Trend Direction
In addition to its core functionalities, the Swing Point Indicator incorporates an advanced feature that enhances the visualization of trend direction. This feature provides further clarity by selectively labeling highs and lows based on the prevailing trend, reinforcing the identification of higher highs and lower lows in uptrends and downtrends, respectively. Overlapping labels on highs and lows signify a potential trend change, providing traders with valuable insight into market reversals.
Detailed Description:
1. Uptrend Labeling:
- Higher Highs (Green Label with Price): In an uptrend, where higher highs are observed, the indicator labels these points with vibrant green color and includes the corresponding price value. This visually highlights the significance of higher highs as pivotal points in the upward trajectory of prices.
- Higher Lows (Red Marker without Text or Diamond): To complement the identification of higher highs, higher lows are marked with a distinct red marker or diamond, devoid of any accompanying text. While these points are crucial in delineating the ascending trend, their emphasis lies in their role as support levels, providing a foundation for upward price movements.
2. Downtrend Labeling:
- Lower Lows (Red Label with Price): Conversely, in a downtrend characterized by lower lows, the indicator labels these points with conspicuous red color, accompanied by the corresponding price value. Lower lows signify critical levels of downward price momentum, acting as indicators of potential bearish continuation.
- Lower Highs (Green Marker without Text or Diamond): Lower highs, indicative of downward retracements in a downtrend, are marked by distinctive green markers or diamonds without accompanying text. While these points denote temporary pauses or pullbacks in the bearish trend, their emphasis lies in their role as resistance levels, impeding upward price movements.
Functionality and Utility:
- Customizable Lookback Candle Count: Traders have the option to adjust the lookback candle count, which is set by default at 108 candles in the settings. This flexibility allows traders to tailor the indicator to their specific trading preferences and timeframes.
- Equal Highs or Lows Option: When enabled, the Swing Point Indicator can identify equal highs or equal lows, providing traders with additional insight into market dynamics.
- Formation Confirmation: A new higher high along with its higher low or a new lower low along with its lower high is confirmed after two candles have closed following the swing point candle. This ensures the reliability of the identified trend direction.
Conclusion:
The incorporation of selective labeling for highs and lows based on trend direction, alongside the introduction of customizable settings and formation confirmation criteria, enhances the effectiveness of the Swing Point Indicator. This feature-rich tool empowers traders with a nuanced understanding of market dynamics, highlighting critical price levels and trend reversals. By offering enhanced visualization, customizable options, and confirmation criteria, the Swing Point Indicator equips traders with the confidence and precision needed to navigate the markets successfully, contributing to more informed and profitable trading strategies.
Search in scripts for "bear"

Zig-Zag Volume Profile (Bull vs. Bear) [Kioseff Trading]Hello!
Thank you @Pinecoders and @TradingView for putting polylines in production and making this viable!!
This script "Zig Zag Volume Profile" implements the polyline feature for Pine Script!
Features
Volume Profile anchored to zig zag trends
Bull vs Bear profiles!
Delta x price level
Standard POC and value area lines, in addition to separated POCs and value area lines for bull profiles and bear profiles
Up to 9999 profile rows per zigzag trend
Stylistic options for profiles
Configurable zig zag - profiles generated for small to large trends
Polylines!
This script generates Bull vs. Bear volume profiles for zig zag trends!
The zigzag indicator is configurable as normal; minor and major trend volume profiles are calculable. This indicator can be thought of as "Volume Profile/Delta for Trends''.
Up to 9999 volume profile levels (price levels) can be calculated for each profile, thanks to the new polyline feature, allowing for less aggregation / more precision of volume at price and volume delta.
Zig Zag Bull Vs Bear Profiles
The image above shows primary functionality!
Green profiles = buying volume
Red profiles = selling volume
Profiles are generated for each trend identified by the zigzag indicator.
The image above shows the indicator calculating volume delta for specific price blocks on the profile. Aggregate volume delta for the identified trend is displayed over the profile!
The image above shows Bull Profile POC lines and value area lines. Bear Profile POC lines and value area lines are also shown!
All colors and transparencies are configurable to the user's liking :D
Additionally, you can select to have the profiles drawn on contrasting sides. Bull Profile on left and Bear Profile on right.
For a more traditional look - you can select to draw the Bull & Bear profiles on the same x-point.
The indicator is robust enough to calculate on "long zig zags" and "short zig zags"; curved profiles can also be used!
The image above exemplifies usage of the indicator!
Bull & Bear volume profiles are calculated for trends on the 30-second timeframe.
The image above shows a more "utilitarian" presentation of the profiles. Once more, line and linefill colors/transparencies are all customizable; the indicator can look however you would like it to!
The image above shows key levels, the Bull vs. Bear profile, and volume delta for the current trend!
That's about it :D
This indicator is part of a series titled "Bull vs. Bear" - a suite of profile-like indicators I will be releasing over coming days. Thanks for checking this out!
Of course, a big thank you to @RicardoSantos for his MathOperator library that I use in every script.
If you have any suggestions please feel free to share!

Bull Bear Zones for Bank Nifty and Nifty IndexThis indicator will automatically plot daily Bullish and Bearish Zones. Also this indicator mainly works in the Nifty and Bank Nifty Intraday trades. Preferred time frames (3/5/15 Mins)
Calculation
Take Last 5 days O H L C then find H-O and H-L, take average of the difference of H-O and H-L then Minimum Value then the average difference is added with the day opening to get the bullish zone and the average is subtracted from the opening price to get the bearish zone
Long Trade
Buy above the bullish zone line or Buy near the bearish support levels when it takes support
Example 1 (Buy above Bullish Zone)
Short Trade
Sell below the bearish zone line or Sell when there is a rejection from the bullish zone
Example 1 (Sell Below Bearish Zone)
No Trade Zone
If the market move between the zones then, the momentum is very week.
Example 1

Bull and Bear Market '20% IndicatorThis indicator uses the somewhat crude method of calculating bear/bull markets using the following popular ' 20% rule ':
A bear market begins when an asset trades 20% below its recent high for more than two months, a bear market ends when an asset trades 20% above its recent low for one month or more.
The 1d time-frame should be used, here's why:
"A bear market begins when an asset trades 20% below its recent high for more than two months."
If we take the standard trading month to be around 20-22 days (excluding weekends), then two months would be approximately 40-44 days. This is why we set the `bearDuration` to 60 days in the script to capture the "more than two months" criteria. Using a daily timeframe, 60 bars represent roughly 3 months (since markets are not open every day due to weekends and holidays).
"...a bear market ends when an asset trades 20% above its recent low for one month or more."
This is why the `bullDuration` is set to 20 days in the script, which represents roughly one trading month on a daily timeframe.
So, to capture the mentioned bear and bull market definitions, you'd want to apply the script on a daily (1d/1D) chart.

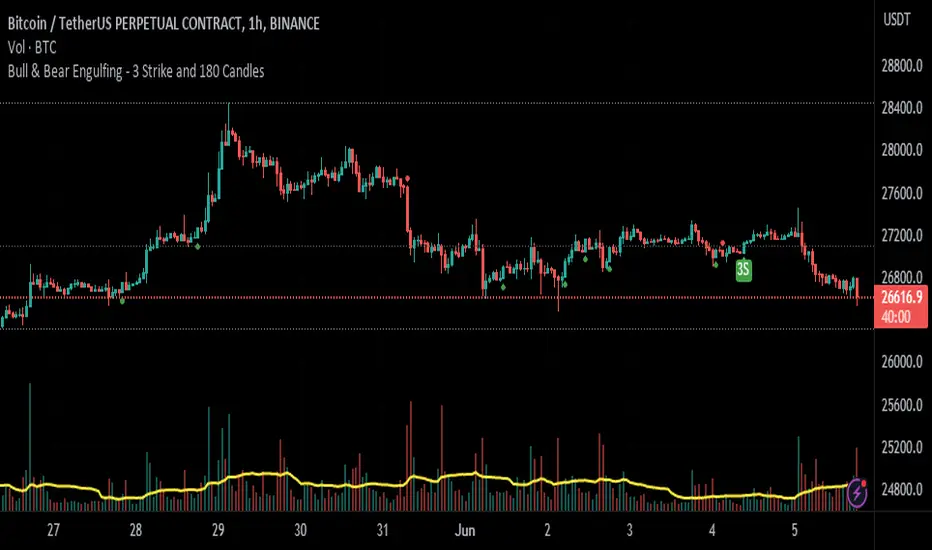
Bull & Bear Engulfing - 3 Strike and 180 CandlesHello, SenatorVonShaft here.
This indicator shows 3 differend candlestick formations:
1- Bullish & Bearish Engulfing Candle
2- Bullish & Bearish 3 Strike Candle
3- Bullish & Bearish 180 Degree Candle
It has 3 variables
1- Bar Fullness - Differs from %50 - %100 showing 1 candle's fullness
2- Avg. Backwds Candls - Gets the average weight of the backward candles
3- Avg. Bar Height Multiplier - This variable is multiplied by above value to determine engulfing candles.
Plots:
- Green & Red Arrows Only : Shows Bullish & Bearish engulfing candles
- Green & Red 180 : Shows a bullish or bearish engulfing candle taken over by a bigger opposite candle
- Green & Red 3S : Shows bullish & bearish 3 strike candle formation
Please feel free to comment your thoughts below.
See you.
Bull Bear Correlation Tracker PaneThe Bull Bear Correlation Tracker is a versatile indicator designed to help traders identify the direction and strength of market trends by comparing the price action of multiple assets. It is particularly useful for those who are familiar with the carry trade principle, as it can detect when positively or negatively correlated assets move in favor or against the asset being traded. This indicator can be used for various markets, including crypto and forex, by simply adjusting the default options.
Key features of the Bull Bear Correlation Tracker include:
Multiple methods for determining trend direction: Supertrend, Pivot Point SuperTrend by LonesomeTheBlue, MACD - Zero Cross, and MACD - Grow/Shrink. These methods help traders identify the primary trend direction and potential trade opportunities.
Optional slow trend display for additional insights into market trends, allowing traders to analyze both short-term and long-term trends simultaneously.
Supports up to three symbols, enabling traders to analyze multiple assets simultaneously and better understand their correlation.
Assumed correlation settings to test traders' hypotheses about asset relationships, allowing traders to make informed decisions about potential correlations between different assets.
Customizable correlation period and smoothing settings to fine-tune the indicator's performance, providing traders with the ability to optimize the indicator based on their preferred trading style and market conditions.
Market hours filter to focus on specific trading hours, ensuring that the indicator only displays data during the hours specified.
Customizable color settings for easy visualization of trends, helping traders quickly identify the direction and strength of market trends.
Correlation histogram display to visualize asset relationships, providing traders with a clear visual representation of how different assets are correlated.
This indicator can be used to either force the correlation to be assumed positive or negative if the trader knows the correlation, or to use the actual data calculated between the traded asset and other assets if the correlation is broken often. This flexibility makes the Bull Bear Correlation Tracker suitable for trading various assets, including cryptocurrencies and forex, as well as for traders with different levels of experience.
By utilizing the Bull Bear Correlation Tracker, traders can gain valuable insights into market trends and correlations between different assets, helping them make more informed decisions and improve their trading strategies.
Note: I used back-testing for fine tuning do not base your trades on signals from the testing framework.

Bull Bear Power VoidThere are a million oscillators out there based on volume. My biggest problem with them is that they simply tell you whether you have volume to the upside or volume to the down side. it's kind of tricks you with the lack of information into thinking you have a change in your trend or that you're going to be able to break out of a range across a moving average or through some trend line or support and resistance.
However many of these Oscillators are failing because they lacked to tell you one key thing. they tell you that you have volume but they never tell you if it's enough volume.
Even a popular indicator like the MACD can have its MACD Line crossing upwards over the signal, telling you that you have an uptrend but again it's still failing to give you the results of how much volume you have and is it enough volume in that crossover. It boils down to the one key fact that with out volume there is no momentum. This should be able to make trading crossovers a lot easier.
So in today's video I'm going to show you the newest addition to the trading View Community Scripts and it is called,
"The Bull Bear Void Volume Oscillator"
From my own testing, this oscillator can predict weather the next candle will get you the move you need or not.
In the markets you cannot have anything good without volume. after you have volume you have momentum. you cannot have momentum without volume and this is the key thing that causes people to fail when they look for breakouts, trend reversals, or if they're wondering whether this move is a fake out.
This indicator is based on the study volume spread analysis or VSA.
This indicator is designed to be paired perfectly with the Heiken Ashi Algo oscillator.
www.INSERTA-LINK-HERE.com
This indicator is strictly to be used as a confirmation indicator and not to be used by itself to tell you when to buy or sell.
what are its parts.
The void
is a bullish and bearish Cloud that appear extending from the center of words and the center down words. This is the average range of volume. anything that appears to close inside of this void is usually a ranging volume and it is not enough to break the trend or break out.
The MACD and MACD Signal Line
Just like using the macd these two lines indicate whether the trend is moving up for the trend is moving down
The Colored Columns
RED Column - Indicates volume movie downward
Light Red - indicates volume is pulling back from a downward move
Green - indicates volume is moving upwards
Light Green - indicates volume is moving down from an outboard move
Rules for a SELL CONFIRMATION TRADE
The macd line must be underneath the signal line and the macd line must be below the midline.
A bullish column must appear below the midline and it must extend outside of the red void.
if you are using the heikin-ashi Aldo oscillator you must also have a red heiken Ashi candle close below -10.
To do a by trade you simply reverse the rules.

Bull/Bear Buy/Bail CandlesBased on BullBearPower indicator, this is a heavily modified version with colored candles to show when bulls or bears are buying or bailing. Includes Fibonacci Levels based on Highest/Lowest value in variable length, along with optional second timeframe and alternative calculation for candles and linear regression curves for increased versatility. Green = bullish /long, Aqua = still-bullish albeit weakening, blue = weak albeit strengthening and red = weak/short. Perfect as a confirmation indicator for those looking to time markets.
Bull& Bear Bars Count/CalculatorIn bull trend, bull bars are more than bear bars and vice versa.
More important, if the bull/bear bars are more continuous, the trend is typically stronger.
So, if the bars amount is visualized, it would be much more easier to identify the unfolding trend in front of you.
This indicator shows you the amount of bull/bear bars by columns.
The higher the column, the bars are more continuous, the trend is stronger.

Combo 2/20 EMA & Bull And Bear Balance This is combo strategies for get a cumulative signal.
First strategy
This indicator plots 2/20 exponential moving average. For the Mov
Avg X 2/20 Indicator, the EMA bar will be painted when the Alert criteria is met.
Second strategy
This new indicator analyzes the balance between bullish and
bearish sentiment.
One can cay that it is an improved analogue of Elder Ray indicator.
To get more information please see "Bull And Bear Balance Indicator"
by Vadim Gimelfarb.
WARNING:
- For purpose educate only
- This script to change bars colors.
Indicator Direction Table With Bullish & Bearish LabelsINDICATOR DIRECTION TABLE WITH BULLISH AND BEARISH LABELS
This is a table that shows the bullish, bearish or neutral trend for nine different popular indicators. Each indicator label will change color in real time to make you aware of each change in direction. This way you don’t have to read and analyze a bunch of different indicators constantly and you can focus on price action instead.
Look for the entire table to turn green or red before taking positions.
You can also set alerts for when the entire table of indicators is bullish or bearish.
The indicator settings allow customization of indicator lengths & values, table position and turning the indicator table on or off.
The length and other values for each indicator can be customized to suit your preferences, but by default all of them are set to the normal default settings that Tradingview supplies the indicators with. Typically 14 as the length.
The indicators used in this table are as follows:
MACD - Moving Average Convergence Divergence
Stochastic RSI - Stochastic Relative Strength Index
Vortex - Vortex Indicator
Momentum - Momentum Indicator
RSI - Relative Strength Index
PSAR - Parabolic Stop & Reverse
DMI - Directional Movement Index
MFI - Money Flow Index
Fisher - Fisher Transform Price Action
***MARKETS***
This indicator can be used as a signal on all markets, including stocks, crypto, futures and forex.
***TIMEFRAMES***
This indicator table can be used on all timeframes.
***TIPS***
Try using numerous indicators of ours on your chart so you can instantly see the bullish or bearish trend of multiple indicators in real time without having to analyze the data. Some of our favorites are our Auto Fibonacci, Directional Movement Index + Fisher Price Action, Volume Profile With Buy & Sell Pressure, Auto Support And Resistance and Money Flow Index in combination with this indicator direction table. They all have unique features to help you make better and faster trading decisions.

MTF Bull Power Bear Power(Elder Ray Indicator)■Overview
This indicator enables to select an upper timeframe’s Bull Power Bear Power(aka Elder Ray Indicator) (MTF) and the one of chart’s timeframe simultaneously by which users can always analyze looking at upper timeframe situation.
Also, it displays signals when bull power bear power cross zero line with an ability to set alerts.
■Formula
The indicator calculates bull power and bear power following the original Elder Ray indicator as follows.
1.Bull Power : High - EMA(13)
2.Bear Power : Low - EMA(13)
3.Bull Power Bear Power : 1 + 2
※MTF is same as above
※MA period can be changed
※High/Low is highs/lows of a chart timeframe that users are opening unless you show MTF.
See the link below for the details.
www.investopedia.com
To enable MTF, users can select “Auto” mode and “Manual” mode. When “Auto” selected, upper timeframes are determined based on the chart’s timeframes that users are currently opening as follows.
Chart timeframes -> upper timeframes
Weekly -> Monthly
Daily -> Weekly
4hour -> Daily
1hour -> 4hour
30min -> 4hour
15min -> 1hour
5min -> 1hour
1min -> 15min
■Signals
When bull power bear power cross zero line, signals can be displayed. These can be used to analyze reversal of buying/selling power.
Alerts can be set with the same condition.
——————————————
エルダー·レイ·インジケーターとしても知られるブルパワー·ベアパワーのMTFバージョンインジケーターです。
一つの上位足のブルパワー·ベアパワーとチャートのタイムフレームのブルパワー·ベアパワーの両方を同時に表示することができるため、常に上位足の状況を鑑みながら分析することができます。
また、それぞれのブルパワー·ベアパワーとゼロラインとの交差でシグナル表示、アラート設定が可能です。
■計算式
ブルパワー·ベアパワーの計算式は以下の通りです。
オリジナルのエルダー·レイ·インジケーターと同じくEMAと高値·安値を用いて計算しています。
1.ブルパワー: 高値 - EMA(13)
2.ベアパワー: 安値 - EMA(13)
3.ブルパワー·ベアパワー = 1 + 2
※MTFも上記に同じ
※MAの期間は変更可能
※高値·安値は現在開いているチャートの高値·安値です。(MTFは指定したタイムフレームの高値・安値)
ブルパワー·ベアパワーの詳細は以下のリンクを参照してください。
www.investopedia.com
MTFのブルパワー·ベアパワーを表示するにあたっては、”Auto”モードと”Manual”モードの二つから選択することができます。
“Auto”モード選択時は、現在開いているチャートのタイムフレームに基づき、上位足のタイムフレームが下記の通りに自動的に決定されます。
チャートタイムフレーム -> 上位足タイムフレーム
週足 -> 月足
日足 -> 週足
4時間足 -> 日足
1時間足 -> 4時間足
30分足 -> 4時間足
15分足 -> 1時間足
5分足 -> 1時間足
1分足 -> 15分足
■シグナル
ブルパワー·ベアパワーとゼロラインとの交差でシグナルを表示します。
売り買いの強弱反転ポイントの目安として使ってください。
同じ条件でアラート設定も可能です。

Rebalance as a Bear/Bull indicatorCheck if the current market has a Bear tendency or a Bull tendency.
Bear areas are marked as red squares going down from 0.
Bull areas are marked as green squares going up from 0.
Buying/Selling windows of opportunity
On top of the Bear/Bull squares, this indicator tries to show you the windows where to look for good buying/selling opportunities.
These are marked as full columns:
Blue columns represent a window to look out for good buying opportunities
Pink columns represent a window to look out for good selling opportunities
How is this possible?
This is an indicator of a simple idea to check if the market has a Bear or Bull tendency:
1. Start with a virtual portfolio of 60/40 tokens per fiat.
2. Rebalance it when its ratio oscillates by a given % (first input)
3. Count the number of times the rebalancer buys, and sells
4. When the number of buys is greater than the number of sells => the market is going down
5. When the number of sells is greater than the number of buys => the market is going up
This is shown as the "Bear/Bull Strength" squares (red when bear, green when bull)
An extra rebalancer is also kept that works at each bar (regardless of the input %).
This is used to calculate an amount of tokens beying sold/bought and used as a "market force" coefficient.
Another extra: based on both the bear/bull strengh and market force an attempt is made to
provide good buying/selling windows of analysis.
The blue background is a buying opportunity, the red background is a sell opportunity.
In a bear market sales are delayed, and in a bull market buys are delayed.

when bull D timeframeEcco a voi la mia strategia basata su atr con implementazioni personali per definire facilmente la condizione di mercato su btc e eth, come potete vedere punta ad identificare solo le salite più importati ignorando i falsi segnali che avvengono nelle fasi di bear market (o di incertezza). Da utilizzare con timeframe D.
Condivido una versione disponibile e funzionante gratuitamente fino al 31/12/2022 dopo tale data lo script tornerà a pagamento.
Here is my strategy based on atr with personal implementations to easily define the market condition on btc and eth, as you can see it aims to identify only the most important climbs ignoring the false signals that occur in the bear market (or uncertainty) phases. For use with timeframe D. I share a version available and working for free until 31/12/2022 after that date the script will return not for free.
Stay Tuned

CandleEvaluationLibrary "CandleEvaluation"
Contains functions to evaluate bullish and bearish, engulfing, and outsized candles. They are different from the built-in indicators from TradingView in that these functions don't evaluate classical patterns composed of multiple candles, and they reflect my own understanding of what is "bullish" and bearish", "engulfing", and "outsized".
isBullishBearishCandle()
Determines if the current candle is bullish or bearish according to the length of the wicks and the open and close.
int _barsBack How many bars back is the candle you want to evaluate. By default this is 0, i.e., the current bar.
returns Two values, true or false, for whether it's a bullish or bearish candle respectively.
isTripleBull()
Tells you whether a candle is a "Triple Bull" - that is, one which is bullish in three ways:
It closes higher than it opens
It closes higher than the body of the previous candle
The High is above the High of the previous candle.
int _barsBack How many bars back is the candle you want to evaluate. By default this is 0, i.e., the current bar.
returns True or false.
isTripleBear()
Tells you whether a candle is a "Triple Bear" - that is, one which is bearish in three ways:
It closes lower than it opens
It closes lower than the body of the previous candle
The Low is below the Low of the previous candle.
int _barsBack How many bars back is the candle you want to evaluate. By default this is 0, i.e., the current bar.
returns True or false.
isBigBody()
Tells you if the current candle has a larger than average body size.
int _length - The length of the sma to calculate the average
float _percent - The percentage of the average that the candle body has to be to count as "big". E.g. 100 means it has to be just larger than the average, 200 means it has to be twice as large.
returns True or false
isBullishEngulfing()
Tells you if the current candle is a bullish engulfing candle.
int _barsBack How many bars back is the candle you want to evaluate. By default this is 0, i.e., the current bar.
int _atrFraction The denominator for the ATR fraction, which is the small amount by which the open can be different from the previous close.
returns True or false
isBearishEngulfing()
Tells you if the current candle is a bearish engulfing candle.
int _barsBack How many bars back is the candle you want to evaluate. By default this is 0, i.e., the current bar.
int _atrFraction The denominator for the ATR fraction, which is the small amount by which the open can be different from the previous close.
returns True or false

SB Average Gain/Loss OscillatorI created an algorithm to analyze overbought/oversold levels through the use of average gain/loss.
This method of measurement is utilizing the 20 period and 50 period moving averages.
Light Green: 20 Period Oversold
Dark Green: 50 Period Oversold
Green Dot: 20 and 50 Period Oversold
Light Red: 20 Period Overbought
Dark Red: 50 Period Overbought
Red Dot: 20 and 50 Period Overbought
Places of overlap green/red would be considered indecision and/or volatility in both directions.
I would consider this more of an sentiment indicator, bullish/bearish. The reason for this classification is that its only using price action. No real technical indicators other than period gain/loss).

[astropark] Trend Is Your Friend SERIES [alarms]Dear Followers,
today I'm glad to present you an indicator which is a mix of three indicators of mine: Trend Is Your Friend Series !
As you may easily understand from the name, this indicator incorporates all 3 Trend is You Friend indicators I made in past.
This way you can control all of them just with one indicator.
Of course this comes with some useful integration features:
a bull green triangle appears when all trends are bullish (you can set an alert for this)
a bear purple triangle appears when all trends are bearish (you can set an alert for this)
bar coloring reflects the bullish/bearish integration too
you have an option to enable/disable all trends buy/sell signals
you have an option to hide trend clouds borders (chart will be way cleaner this way)
you can still customize each trend indicator settings and set alerts on each trend individually
you can enable/disable heikin ashi analysis
As per Trend is Your Friend V1/V2/V3, this indicator is for higher timeframe trading, from 4h and above is suggested.
This indicator is pretty good for both Swing and Scalping , you can run it over a bot or use it on Renko chart!
If you are a scalper, you will love suggested entries for fast profit. You can run it on 1h timeframe in this case (below is not suggested, there is "no-trend" below 1h!). If you are used to scalp trading, be sure to close each trade whenever you feel happy (a proper trailing stop strategy is suggested for example).
As I always say, all tools are great if you use them correctly: this is not the "Holy Grail", so always use proper money and risk management strategies.
For your reference, here you can see original basic indicators that were integrated here:
V1 backtesting strategy
V2 backtesting strategy
V3 backtesting strategy
This is a premium indicator , so send me a private message in order to get access to this script.
KINSKI ADXThis ADX indicator (Average Directional Index) tries to estimate the strength of a trend. The Average Directional Index is derived from the positive (+DI) and the negative directional indicator (-DI). The direction of movement is determined by comparing the highs and lows of the current and past periods.
As soon as the indicator determines a trend strength for upward or downward trend, a label is displayed. An upward trend is labelled "Bullish Trend". The downward trend bears the label "Bearish Trend".
The clouds in the background represent the movements of the Average Directional Index High/Low:
Color orange: neutral, uncertain in which direction it is going.
Color green: upward trend
Color red: downward trend
The line represents the average value of the ADX signal:
Color orange: neutral: still uncertain in which direction it is going
Color green / outgoing line: upward trend
Color green / descending line: weakening upward trend
Color red / exiting line: downward trend
Color red / descending line: weakening downward trend
The following configurable options are possible:
"ADX Smoothing
Directional Index Length
Level Range
Level Trend

Crypto Strategy for Bearish Markets (Binance, FTX, Futures...)BINANCE:BTCUSDTPERP
Even in months like May '21 you can win by going long on Bitcoin. This strategy proves it and is not overwhelmed by Elon's ...
The backtest was carried out during the month of May of this year and, as you can see, all the long operations opened during the fall were successful.
So if we are going to continue to have a bear market for some time, why not take advantage of it while we remain bulls?
This strategy uses Dollar-Cost-Average (DCA) to average the entry price. Thanks to this, it is able to close profitable trades even in times of great volatility and bearish pressure.
It includes alerts that can be configured that will be sent every time the conditions to operate are met. These alerts can also be linked with 3commas for a fully automatic operation.
For Leverage Futures or Margin traders, all you have to do is divide the initial capital by the leverage used.
Enjoy!

Best Bulls Bears Volume trend Breakout V2 [badshah_e_alam]This is a intraday indicator. Only to be used on timeframe less than daily charts.
This indicator purely uses volume to plot the graph. The indicator helps in conforming a breakout strategy.
This indicator is advanced version of my previously developed indicator you can check this link
Total volume is made up of buying volume and selling volume . Buying volume is the number of shares, contracts, or lots that were associated with green bars, and selling volume is the number that were associated with red bars.
The labels on the right side are the current bar value and that days bulls /bears weightage.
the first value shows the current bar volume.
second value show the bulls weight in %
third value show the bears weightage throughout the day ( %)
The Blue plot in graph keeps the track of bulls movement in intraday( %)
The Red plot in graph keeps the track of bears movement in intraday ( %)
X axis is time.
Y axis ranges from 100 to -100
I use 1:2 risk to reward ratio. Do your own research.
**not a financial advice**
Example of price increasing, volume decreasing
this indicator can be used for confirming a breakout strategy with bulls or bears in action. In the current example, the buyer’s volume percentage is reducing and the price is increasing throughout the day. Hence a breakout of the trendline is confirmation of a short trade.
Example of Price reducing, volume decreasing
example of price moving down , bears losing the grip
Example of price decreasing volume increasing
Thanks to nizar9599 for giving idea to improve my previous indicator.
DISCLAIMER
Any and all liability for risks resulting from investment transactions or other asset dispositions carried out by the user based on information received or a market analysis is expressly excluded by me.
All the information made available here is generally provided to serve as an example only, without obligation and without specific recommendations for action. It does not constitute and cannot replace investment advice. We therefore recommend that you contact your personal financial advisor before carrying out specific transactions and investments.
Do your own research, This is not a financial advice.

Percentile Rank Market FilterA simple script to filter bull and bear markets by using percentile rank filter. Using market regimes to filter by bull/bear/sideways markets helps to understand how your strategy will
behave in various market regimes and allows you to avoid unprofitable regimes and only trade in profitable ones.
The idea of market regime filtering is used in the most successful technical algorithmic trading strategies, as one should always design a trading strategy with a particular market in mind according to trading legend, Larry Connors
Feel free to use this script in your strategies to improve your profits and lower drawdowns.

Sentiment analysis combined with multiple MA types for CRYPTOThis is a strategy made from price action combined with multiple moving averages calculations used for the candle histograms.
In this case we calculate the bear and the bull candles based on the next criteria :
Bull candle : ((CLOSE - LOW ) + (HIGH -OPEN) / 2 ) / Candle length
Bear candle: ((HIGH - CLOSE ) + (OPEN-LOW ) / 2 ) / Candle length
Once we have the candle we use moving average to smooth the process, and then we calculate the differece between the bull ma and bear ma.
The result is going to be our histogram.
Once we have the histogram we can start setting up rules for entries and exit.
If you have any question, please let me know!

Altered True Strength Indicator (TSI) Reupload-
Altered TSI provides a slightly more volatile signal that demonstrates extremities in price action with greater success than standard TSI. In addition, I added bull/bear cross indicators (green/red) to make it easier to notice the crosses to save time when the market is moving fast (I couldn't find a regular TSI script with this addition). Finally, the signal also has overextension parameters (red and green lines)
I think this is best used on Intraday time frames as the signals respond to volatility very well and using Heikin Ashi candles, trend is more visual. In this particular example, I am showing SPY on the 3m time chart (my favorite short time frame) and the signal alone provided many opportunities for trades when using simple divergences and countering overextension direction when short term (blue) signal crosses either
In the first example (purple lines), SPY ramps but it was a dull signal given the signal strength flatlining- we would be looking for a short entry. When the signal fires, it provides a clean $1.50 move down in spy.
In the second example (orange), the blue signal provides a nice V shape (rebound signal) in which we are looking for a long entry. 390.50 is a strong SPY support in confluence with 2nd std dev VWAP extension, but disregarding that bull signal fires resulting in a 2 dollar move upwards. Exit is provided when blue line crosses green overextension.
In the third example (white), we are searching for a short entry at 392.5 resistance in confluence with divergently higher highs. Bear cross signal when fired and a significant cross is visible provides a $2.50 move to the downside with a potential exit provided when blue line crosses red overextension line in confluence with previous LOD area.
In the fourth example (green), we watch as the blue line provides a V pattern, we are searching for a long entry. If you didn't take a riskier long at 2nd std dev VWAP overextension with V recovery on blue line at red overextension for a ride to vwap, then you are looking for a secondary entry long as you wouldn't take the trade at resistance (vwap). Bullishly divergent lows provide this entry and the signal does not bear cross at all (but looking for significant crosses is more important even if the signal were to make a minor bear cross). Bullishly divergent double bottom provides a long entry to end of day with a nice clean signal for a $5.00 move until eod or when signal crosses overextension range.
Ideally, close to the money options or SPY/SPXS/SPXL are best used in the intraday time frame.
Again, this is not a standalone indicator but it's best used in conjunction with other indicators/trading strategies
Any questions feel free to comment
