PT Trend BarsVersion 1.0 of our Trend Bars Indicator offers a visual of the current trend. The purpose of it is to help you avoid counter trading the trend. It will not identify the exact top or bottom, but it will help you identify overall in which direction the market wants to head. High time frame trend bar candles will allow you to ride the wave for multiple weeks.
White candles indicate bullish trend
Black candles indicate bearish trend
Strategy:
Daily is our favorite time frame to use when trying to identify the overall macro trend of the asset. Once we cross bull with three consecutive white candles, we can assume we are bullish until the candles flip bear again (black). On lower time frame, if the candles flip color but the price is going against trend, you can assume we are going for a retest.
This Oscillator is best used with the PT Buy Sell indicators we provide. It offers extra confluence for a stop loss & for a target for swing setups. It is included as part of the library. Just message us for access!
Search in scripts for "bear"

[astropark] DMI/ADX strategy [alarms]Dear Followers,
today I'm happy to share with you my DMI / ADX Strategy .
It provides directional trend information, so if a bullish or a bearish trend is going to start. Statistically it works better on lower timeframes (from 5 minutes to 1 hour).
It is both a Swing and Scalping Strategy indicator , based on a simple trend following theory , good for trading FOREX, Indexes, Stocks, Commodities and Cryptocurrencies.
To help in Taking Profits, the strategy integrates 2 special other than bull/bear signals:
Overbought and Oversold RSI Signals , which appear both as darker background (the darker the color, the more the price is in overbought/oversold) and green "ob"-"tp" / red "os"-"tp" labels (they optionally pop up only on a configurable stronger overbought/oversold condition) (you can enable/disable it optionally)
Peak Profit Tracker , which resets every time a new trade starts and keeps track of price fluctuation during the trade: the message is don't be too greedy and take profits or lock them with a stoploss in profit (you can enable/disable it optionally)
You can edit many options in order to
have more/less bull/bear signals
enable/disable showing bull/bear signals
enable/disable showing RSI TP signals (you can edit RSI length, overbought (OB) and oversold (OS) levels)
enable/disable showing peak profits on each trade
The user who wants to use this strategy, especially via an automated bot, must always set a stoploss (example 150$ from entry on bitcoin ) or use a proper risk management strategy .
This is not the "Holy Grail", so use it with caution. It's highly suggested to use a proper money management .
This script will let you set all notifications you may need in order to be alerted on each triggered signals.
You can find the strategy version for backtesting here below:
Here there are some examples how this DMI / ADX strategy works on many markets:
LTC/USDT 15m
BTC/USD 15m
BNB/BTC 15m
ETH/USD 15m
GOLD (XAU/USD) 15m
GOLD (XAU/USD) 1h
FB 15m
AAPL 15m
TSLA 1h
BANKNIFTY Index 5m
NIFTY 50 Index 5m
This is a premium indicator , so send me a private message in order to get access to this script .

Combo Backtest 123 Reversal & Elder Ray (Bear Power) This is combo strategies for get a cumulative signal.
First strategy
This System was created from the Book "How I Tripled My Money In The
Futures Market" by Ulf Jensen, Page 183. This is reverse type of strategies.
The strategy buys at market, if close price is higher than the previous close
during 2 days and the meaning of 9-days Stochastic Slow Oscillator is lower than 50.
The strategy sells at market, if close price is lower than the previous close price
during 2 days and the meaning of 9-days Stochastic Fast Oscillator is higher than 50.
Second strategy
Developed by Dr Alexander Elder, the Elder-ray indicator measures buying
and selling pressure in the market. The Elder-ray is often used as part
of the Triple Screen trading system but may also be used on its own.
Dr Elder uses a 13-day exponential moving average (EMA) to indicate the
market consensus of value. Bear Power measures the ability of sellers to
drive prices below the consensus of value. Bear Power reflects the ability
of sellers to drive prices below the average consensus of value.
Bull Power is calculated by subtracting the 13-day EMA from the day's High.
Bear power subtracts the 13-day EMA from the day's Low.
You can use in the xPrice any series: Open, High, Low, Close, HL2, HLC3, OHLC4 and ect...
WARNING:
- For purpose educate only
- This script to change bars colors.
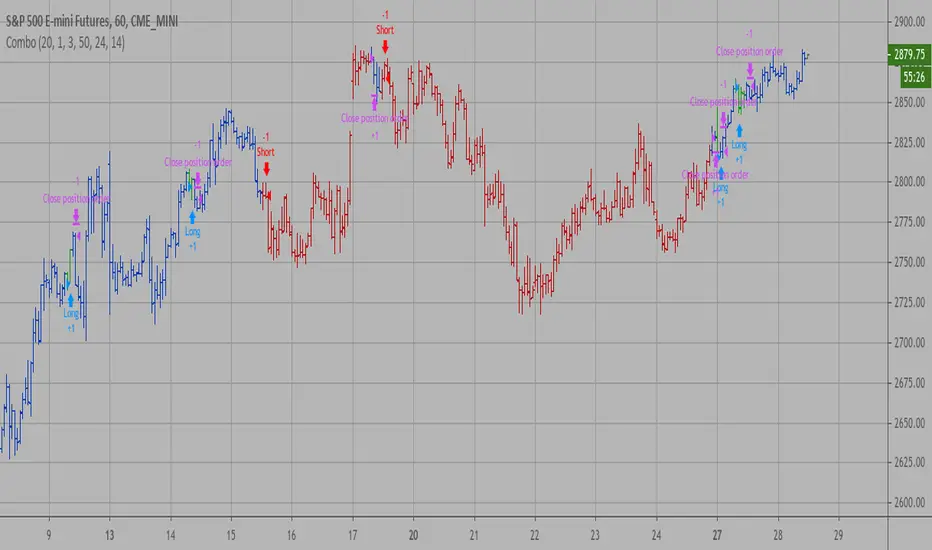
Combo Strategy 123 Reversal & Elder Ray (Bear Power) This is combo strategies for get a cumulative signal.
First strategy
This System was created from the Book "How I Tripled My Money In The
Futures Market" by Ulf Jensen, Page 183. This is reverse type of strategies.
The strategy buys at market, if close price is higher than the previous close
during 2 days and the meaning of 9-days Stochastic Slow Oscillator is lower than 50.
The strategy sells at market, if close price is lower than the previous close price
during 2 days and the meaning of 9-days Stochastic Fast Oscillator is higher than 50.
Second strategy
Developed by Dr Alexander Elder, the Elder-ray indicator measures buying
and selling pressure in the market. The Elder-ray is often used as part
of the Triple Screen trading system but may also be used on its own.
Dr Elder uses a 13-day exponential moving average (EMA) to indicate the
market consensus of value. Bear Power measures the ability of sellers to
drive prices below the consensus of value. Bear Power reflects the ability
of sellers to drive prices below the average consensus of value.
Bull Power is calculated by subtracting the 13-day EMA from the day's High.
Bear power subtracts the 13-day EMA from the day's Low.
You can use in the xPrice any series: Open, High, Low, Close, HL2, HLC3, OHLC4 and ect...
WARNING:
- For purpose educate only
- This script to change bars colors.

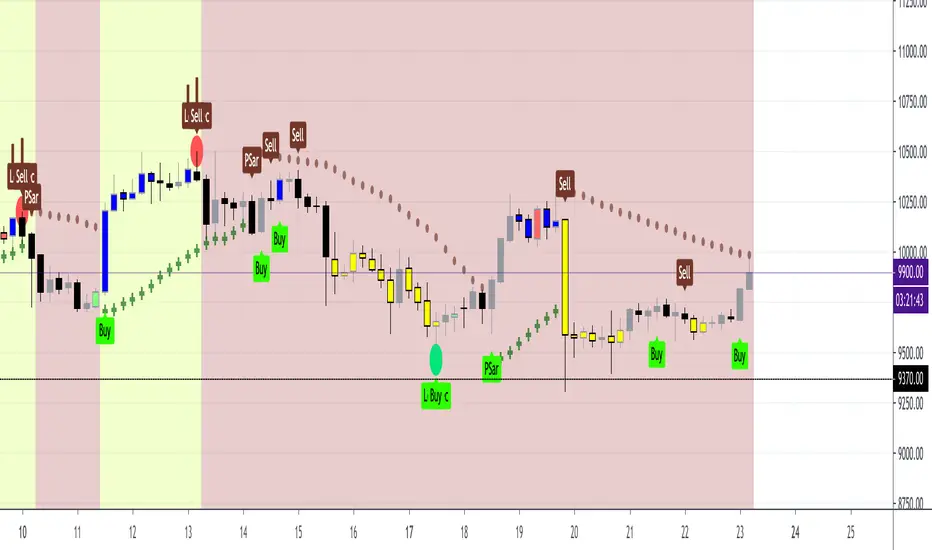
BTC Bullish or Bearish (Joy)Quite often we are faced with the question of whether Bitcoin is macro bullish or bearish.
I tried to take a punch at this.
There many ways to find that answer.
This is one crude way.
Whenever the background colour is light lime, it means it thinks the Bitcoin is macro bullish
Whenever the background colour is red lime, it means it thinks the Bitcoin is macro bearish
How would I use this information?
I can possibly use it in position sizing and hedging. If I see a sell in a lime background, I can potentially just hedge & vice versa.
Do note that it works best in the higher timeframes.
Do note that it is not supposed to be used to open any new trade or to close any trade.
I use it alongside other indicators for confirmation bias.
This can possibly be used for other instruments. As I only use it for trading BTCUSD, I have crudely tested for BTCUSD
For info on gaining access see the ⬇ link below ⬇ in our signature field & direct message me. I have a busy schedule at my own workplace. Trading is my hobby. Hence, please be kind to me if I am late in replying.
inwCoin Sto RSI Bullish/Bearish Divergence + Scalping StrategyStochastic RSI is well-known oscillator indicator for finding potential bottom/top within each timeframe.
Inspired by some dude from twitter that showing how his bot is working. So I tried to write this strategy to work with small timeframe.
After trial and error, I found out that if we take profit by using previous high of lookback period, we still able to make some profit with small TF.
How it work?
---------------
1) This strategy will find the STO RSI bullish or bearish divergence in 15 min timeframe, if found one, it will enter the trade long or short.
2) If price sideway and the candle since last entry is more than "Cooldown period", it will start looking for STO RSI bull/bear divergence again.
3) It will keep pyramid your entry to "max pyramid" option
4) If price close above or below previous high/low from "TP lookback period" option, it will take profit or take loss of that position.
Cautions
-----------
1) The result is good because in the pass 2 months, we enter bull trend for BTC and other crypto.. So chance that we able to close position with profit is alot higher than loss.
2) But if trend change. This scalping strategy is dangerous to use, because you will take loss down and your loss will build up every single day. ( Make sure to filter trend first )
3) I tried with bear trend with short trade, and it seem profitable. ( But you'll bankrupt if you run long scalp in downtrend, and vise versa )
Alert?
------
I also have alert version of this strategy, if you want to use, please let me know.

inwCoin Sto RSI Bullish/Bearish Divergence StrategyinwCoin Stochastic RSI Bullish / Bearish Divergence Strategy
This strategy is an alternated version of inwCoin RSI Bull/Bear div Strategy.
Because I want to know if the popular "STO RSI Divergence" Strategy really work in real trade?
The good thing about Sto RSI that it can provide us with more entry data for both long and short.
Because sometime RSI will never go to OB or OS zone again..
But sto will keep swinging between OB and OS zone.
Entry Condition
=============
BUY = Smooth K is higher low + price is lower low
SELL = Smooth K is lower high + price is higher high
Other Parameters
===============
- Use stop loss + stop loss %
- Data source for high/low price check
- Lookback period for divergence
Conclusion
==========
This strategy is working great for short entry when market is in sideway down.
Like in 1/7/2019 - 1/1/2020
or 1/1/2018-1/1/2019
But your portfolio will go kaboom if you short in the uptrend....
Also, this is not the good strategy for trend following + long position
But it's great addition if you want to pyramid your position in uptrend.
or looking for good spot to entry long if you miss the uptrend bus.

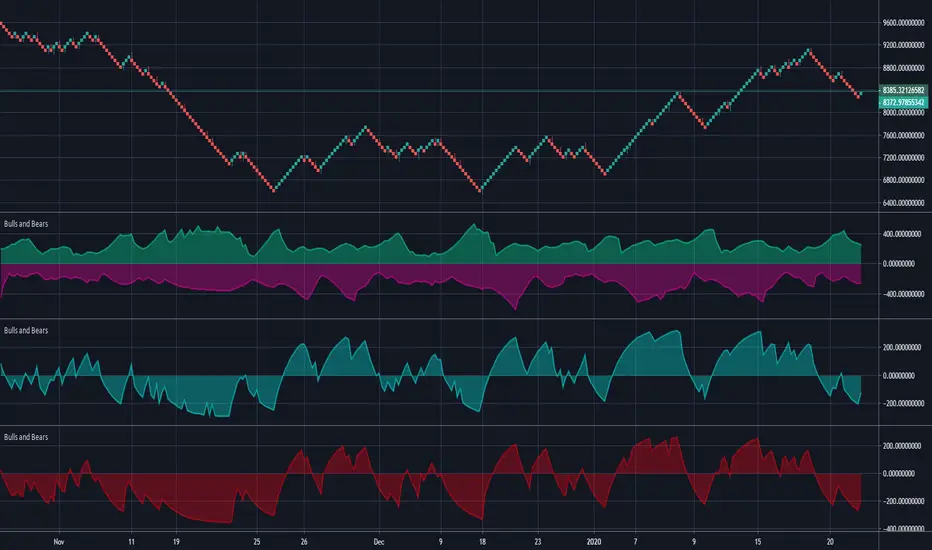
Bulls and BearsThis is a standard 'Bulls and Bears Power" Oscillator, how ever,...
There are two different formulas for calculating bulls and bears, the standard version, uses Highest and Lowest of prices in a given period, BUT, the version we have in meta trader platform, uses the current high and current low for each bar.
Within this indicator, you can use the standard version or the meta trader version, it will draw both bulls and bears and you can turn each one on and off in the style section.
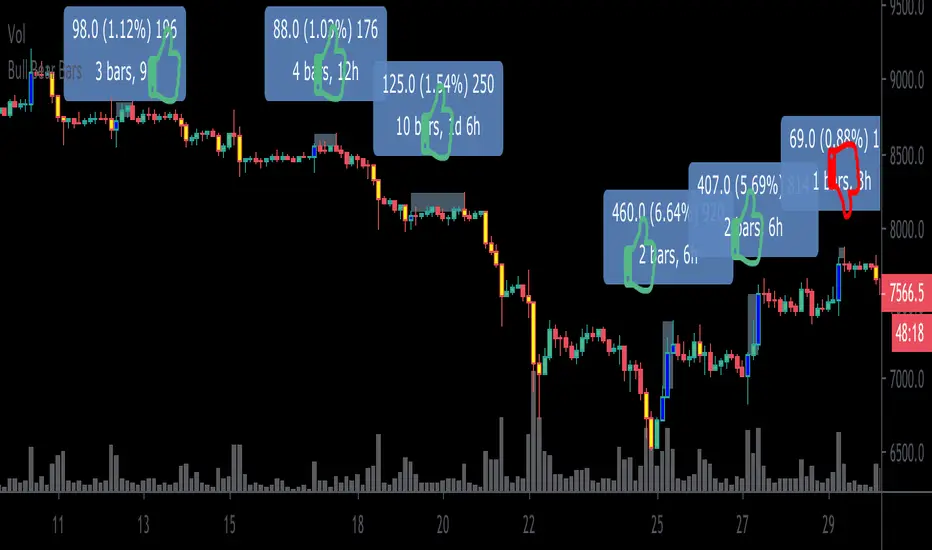
Bull Bear BarsHighlights when the movement of a candle is supported by a major increase in volume. Thus one could reasonably assume that a follow thru is likely to occur.
Blue= bullish
Yellow = bearish
I personally use this as an entry system. I enter only if the blue high or yellow low is surpassed by the very next candle , if not, then i do not enter. Thus trading with momentum and greatly avoiding choppy market conditions.
***Example*** In the chart above, during $XBT’s month long November 2019 Downtrend.. I am showing my bull long entries (without showing the obvious winning bear entries!) and found that only once did the price fail to advance less than 1% before any significant drawdown occurs (As shown on the chart by thumbs up & thumbs down symbols.)
***When using this indicator it is important to keep in mind that Blue bullish bars can and will appear at the top of upswings likewise, yellow bearish bars can and will appear at the bottom of downswings.. which could potentially signify trend reversals.
This knowledge can also can be used to ones advantage (” buy when everyone is selling, sell when everyone is buying.”)
This is a common occurrence because retail traders are often late to the party before they catch on to a trend resulting in buying heavily at the top and selling heavily at the bottom providing liquidity to earlier entrants to exit and as per usual the price then reverses on the mass of late bloomers.***
This indicator can be used in many different ways so goodluck in finding the method that best suits your style and be careful out there. Cheers
BONUS: Also has the ability to set alerts!
Periodic Price ActionI have developed this indicator to compare the current price with the any given periods opening price and to spot if the market is bullish or bearish. You can compare the current price with the past periods using "Shift" feature.
Disclaimer: This is not financial advice
Trade safe,
Atilla

Bull/Bear Test v0.1 [Experimental/Conceptual]For now, I shall assume that the script fulfills the idea that I have in my mind, but since I barely have any programming knowledge, it is likely that it does not.
I am not claiming any originality, it is just that I do not know if there is any indicator that meets this exact purpose. The coding was relatively easy, so here we are.
This is more like an experimental and conceptual study. It needs “cut-off” points to be efficient, like 38.2 and 61.8 Chop values.
So, the reasoning: We know that even during bear market, the number of red candles is larger than the number of green candles, thus any study used to determine whether it is a bull or bear market cannot rely on that. Instead, the “B/B test” focuses on how strong green/bull candles and red/bear candles are.
I think that every market is in any of the following three stages: Bull, Bear, Neutral. A Neutral Stage differs from a consolidation period. Simply looking at the chart does not tell you what stage the market is in. If you have the monthly BTC/USD chart in front of you, it is definitely a bear market. If it is the daily one, then it is controversial.
It sums every percentile change in last n green (red) candles, then divides it to n. This is shown by the Bull (Bear) Test. If the green line (the Bull Test line) is above the red line (the Bear Test line), that means that the Bull movement is stronger than the Bear movement in the last n periods.
Bull Test= Sum (Percentile change of green candles in last n periods) / n
Bear Test= Sum (Percentile change of red candles in last n periods) / n
Percentile change of a candle = (Close – Open) / Open
Relative Strength is obtained by dividing Bull Test to Bear Test, so yields a “clearer” study.
Relative Strength = Bull Test / Bear Test
In the same manner, Relative Strength’s being above 1.0 means that the bull attacks are stronger than the bear attacks in the last n periods.
Currently, there are two ways to use it:
1) Use Bull Test and Bear Test, but not Relative Study
2) Use Relative Study, but not Bull Test and Bear Test
A few things to consider:
1) As the use of Heiken-Ashi candles over ordinary candlesticks changes some of the candles’ colors, they yield relatively different results. I have back-tested some bear markets only with Heiken-Ashi.
2) For charts with ordinary candlesticks, as far as I can tell, a higher n number is better.
3) Due to the way Bull Test, Bear Test, and Relative Strength values are calculated, the same result of n x p (n: the number of candles, p: chart period [like 12h, 1d, 1w, etc.) yields different Bull Test, Bear Test, and Relative Strength values.
For instance: 10 bars on a 12h chart gives slightly different results than 5 bars on a 1d chart.
For the future, I am planning to add a derivative of Relative Study, so we can observe its change rate. Although I am not sure, I think that a crossover of the derivative on Relative Study might be used to determine if the market provably went parabolic.

Dependent Variable Odd Generator For Machine Learning TechniquesCAUTION : Not suitable for strategy, open to development.
If can we separate the stagnant market from other markets, can we be so much more accurate?
This project was written to research it. It is just the tiny part of the begining.
And this is a very necessary but very small side function in the main function. Lets start :
Hi users, I had this idea in my mind for a long time but I had a hard time finding the parameters that would make the market stagnant. This idea is my first original command system. Although it is very difficult to make sense of the stagnant market, I think that this command system can achieve realistic proportions. With 's money flow index, I opened the track to determine the level. On the other hand, the prices were also using a money flow index, and it forced me to make the limitations between the levels in a logical way. But the good thing is that since the bollinger bandwidth uses a larger period, we are able to print normal values at extreme buy and sell values.
In terms of price, we can define excessive purchase and sale values as the period is smaller. I have repeatedly looked at the limit values that determine the bull, bear, and bollinger bandwidth (mfi), and I think this is the right one. Then I have included these values in the probability set.
The bull and bear market did not form the intersection of the cluster, and because there are connected events, the stagnant market, which is the intersection, will be added to the other markets with the same venn diagram logic and the sum of the probability set will be 1. is equal to. I hope that we can renew the number generators in the very important parameters of machine learning such as Markov Process with generators dependent on dependent variables, which bring us closer to reality. This function is open to development and can be made of various ideas on machine learning. Best wishes.
This code is open source under the MIT license. If you have any improvements or corrections to suggest, please send me a pull request via the github repository github.com

Sentiment Zone OscillatorHere's a (forgotten but still useful) Sentiment Zone Oscillator. The Sentiment Zone Oscillator takes a sum of positive price candles over a user-specified window length. Normally, a triple exponential moving average of the sum is used, but we opted to just go with a double EMA for the sake of more responsiveness. When the histogram is green it is bullish and red/pink means bears.

Bilateral Stochastic Oscillator - For The Sake Of EfficiencyIntroduction
The stochastic oscillator is a feature scaling method commonly used in technical analysis, this method is the same as the running min-max normalization method except that the stochastic oscillator is in a range of (0,100) while min-max normalization is in a range of (0,1). The stochastic oscillator in itself is efficient since it tell's us when the price reached its highest/lowest or crossed this average, however there could be ways to further develop the stochastic oscillator, this is why i propose this new indicator that aim to show all the information a classical stochastic oscillator would give with some additional features.
Min-Max Derivation
The min-max normalization of the price is calculated as follow : (price - min)/(max - min) , this calculation is efficient but there is alternates forms such as :
price - (max - min) - min/(max - min)
This alternate form is the one i chosen to make the indicator except that both range (max - min) are smoothed with a simple moving average, there are also additional modifications that you can see on the code.
The Indicator
The indicator return two main lines, in blue the bull line who show the buying force and in red the bear line who show the selling force.
An orange line show the signal line who represent the moving average of the max(bull,bear), this line aim to show possible exit/reversals points for the current trend.
Length control the highest/lowest period as well as the smoothing amount, signal length control the moving average period of the signal line, the pre-filtering setting indicate which smoothing method will be used to smooth the input source before applying normalization.
The default pre-filtering method is the sma.
The ema method is slightly faster as you can see above.
The triangular moving average is the moving average of another moving average, the impulse response of this filter is a triangular function hence its name. This moving average is really smooth.
The lsma or least squares moving average is the fastest moving average used in this indicator, this filter try to best fit a linear function to the data in a certain window by using the least squares method.
No filtering will use the source price without prior smoothing for the indicator calculation.
Relationship With The Stochastic Oscillator
The crosses between the bull and bear line mean that the stochastic oscillator crossed the 50 level. When the Bull line is equal to 0 this mean that the stochastic oscillator is equal to 0 while a bear line equal to 0 mean a stochastic oscillator equal to 100.
The indicator and below a stochastic oscillator of both period 100
Using Levels
Unlike a stochastic oscillator who would clip at the 0 and 100 level the proposed indicator is not heavily constrained in a range like the stochastic oscillator, this mean that you can apply levels to trigger signals
Possible levels could be 1,2,3... even if the indicator rarely go over 3.
Its then possible to create strategies using such levels as support or resistance one.
Conclusion
I've showed a modified stochastic oscillator who aim to show additional information to the user while keeping all the information a classical stochastic oscillator would give. The proposed indicator is no longer constrained in an hard range and posses more liberty to exploit its scale which in return allow to create strategies based on levels.
For pinescript users what you can learn from this is that alternates forms of specific formulas can be extremely interesting to modify, changes can be really surprising so if you are feeling stuck, modifying alternates forms of know indicators can give great results, use tools such as sympy gamma to get alternates forms of formulas.
Thanks for reading !
If you are looking for something or just want to say thanks try to pm me :)

Combo Backtest 123 Reversal & Bull And Bear Balance This is combo strategies for get a cumulative signal.
First strategy
This System was created from the Book "How I Tripled My Money In The
Futures Market" by Ulf Jensen, Page 183. This is reverse type of strategies.
The strategy buys at market, if close price is higher than the previous close
during 2 days and the meaning of 9-days Stochastic Slow Oscillator is lower than 50.
The strategy sells at market, if close price is lower than the previous close price
during 2 days and the meaning of 9-days Stochastic Fast Oscillator is higher than 50.
Second strategy
This new indicator analyzes the balance between bullish and
bearish sentiment.
One can cay that it is an improved analogue of Elder Ray indicator.
To get more information please see "Bull And Bear Balance Indicator"
by Vadim Gimelfarb.
WARNING:
- For purpose educate only
- This script to change bars colors.

Combo Strategy 123 Reversal & Bull And Bear Balance This is combo strategies for get a cumulative signal.
First strategy
This System was created from the Book "How I Tripled My Money In The
Futures Market" by Ulf Jensen, Page 183. This is reverse type of strategies.
The strategy buys at market, if close price is higher than the previous close
during 2 days and the meaning of 9-days Stochastic Slow Oscillator is lower than 50.
The strategy sells at market, if close price is lower than the previous close price
during 2 days and the meaning of 9-days Stochastic Fast Oscillator is higher than 50.
Second strategy
This new indicator analyzes the balance between bullish and
bearish sentiment.
One can cay that it is an improved analogue of Elder Ray indicator.
To get more information please see "Bull And Bear Balance Indicator"
by Vadim Gimelfarb.
WARNING:
- For purpose educate only
- This script to change bars colors.

SMA 50 collectorHello traders
The SMA 50 is known to define a trend. If price is closing above, trend is bullish, if below, trend is bearish.
That's why I like to have all of them on my chart :)
Enjoy
David

Turbo TriggerSome Words
This indicator is a collaboration between me and Himeyuri, i encourage you to check her profile and follow her www.tradingview.com
Introduction
A lot of indicators include a "trigger" line, it can be a smoothed version of another input, in this case the trigger will generate signals from his crosses with the input. The purpose of this indicator is to provide a fast trigger line to generate earlier signals as well as avoiding some whipsaw.
The Indicator
There are two lines, a bull line (blue) and the trigger (orange) , when the trigger cross over the bull line a buy signal is generated, when the trigger cross under the bull line a sell signal is generated. The trigger is made from the smoothed difference between the bull and bear line.
smooth control the smoothness of the output. The Bull/Bear Mode is an idea proposed by Himeyuri that involve plotting the bear line instead of the trigger.
Bull/Bear Mode, the lines are somewhat asymmetrical from each others.
Conclusion
We have showcased a new indicator who use a really fast trigger line to generate earlier signals, if some are way to earlier you can still increase smooth in order to correct reactivity. I hope you find a use to it.
Thanks for reading !
A big thanks to Himeyuri who is a great student and great pinescripter.

BOSS Smooth Stochastic Bull/Bear Oscillator With Alerts THE BEST FOREX, BINARY OPTIONS, AND CRYPTO INDICATORS FOR TRADINGVIEW.COM
Short Entry
During a price downtrend and you get a sell signal (red dot) enter short when the "K" line (green line) drops below 65 (mid upper band).
Long Entry
During an uptrend, buy when you get a long signal (green dot) and "D" line (red line) rises above 35 (mid lower band) .
Bull/Bear
Green background indicates bullish price action (uptrend)
Red background indicates bearish price action (downtrend)
Available At bosscripts.com
Website bosscripts.com

Eagle-CrossingThis is Arcane Bears First Script Which charts your Golden Cross and Death Cross, You can update the settings as you see fit!
If you have any questions please join us at www.arcanebear.com

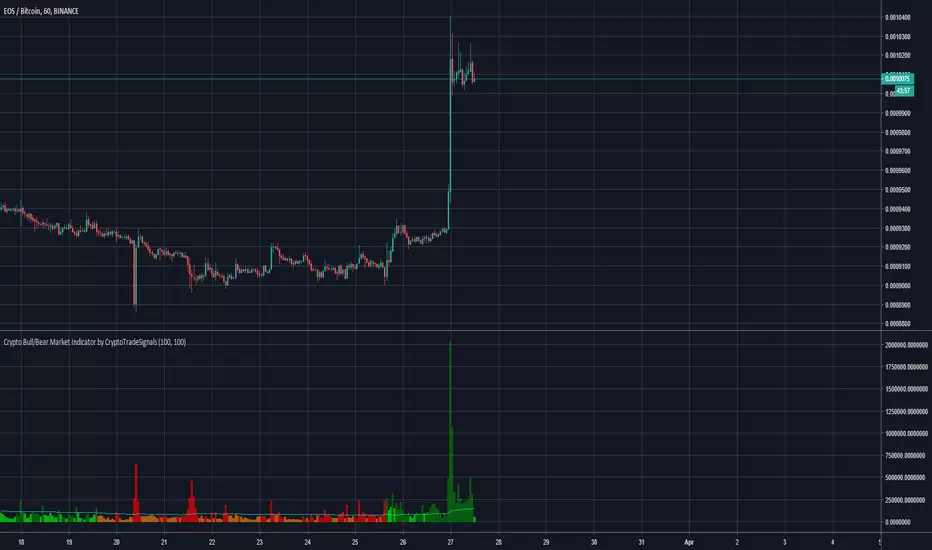
Crypto Bull/Bear Market Indicator by CryptoTradeSignalsHave you ever struggled to identify the sentiment of the crypto market?
With the "Crypto Bull/Bear Market Indicator by CryptoTradeSIgnals" you can easily determine whether markets are “bullish” or “bearish".
Features
Combines price and volume algorithms to easily identify market sell offs or strong buying activity.
Synergises with with Crypto Peak and Crypto Bottom indicators to better identify ENTRY and EXIT points for your trades.
Complete REWRITE of the pre-existing Crypto Bull/Bear Signal which provides better visual cues to understand market activity.
>>Get access to our Crypto Trading Indicators by visiting our website (please go to my main profile page or check the my signature)<<
Bitfinex Sentiment Index [Long-Short]BSI provides two attractive graphs that breakdown the long (green area) and short (red area) positions ratio for the all Bitfinex margin cryptocurrency pairs only .
It is a quantitative measure of the bullishness or bearishness that can be used as a trading rule or in a trading system entries or exits. Included slow stochastic oscillator.

LazyBear's Wave Trend Strategy by SDMFHello.
This is a strategy using the Lazy Bears Wave Trend indicator which he was so nice to release for free.
I heavily modified it and added a huge amount of options for the indicator as well as for the strategy.
Unfortunately it's locked with a passcode for now so my friends can use it
The results above are nit picked for oil 15 minute chart.
using 40% of our equity per trade on 50x leverage.
these are not 100% realistic altho shouldn't be too far from the truth.
Have not tried it on crypto.
Script is in Beta version and will get upgraded plenty in the near future.
