Supertrend ProSupertrend Pro - Multi-Trend Analysis and Trading Signal Filtering
OVERVIEW
This indicator calculates trend direction based on the Supertrend indicator and integrates dual-trend analysis, upper and lower trend bands, trading signal alerts, moving average filtering, and the EMA 200 bull-bear division line to provide traders with more precise trend identification and trading signals.
It is suitable for trend trading, short-term trading, and swing trading, effectively filtering market noise and improving trade accuracy.
IMPLEMENTATION PRINCIPLES
1. Primary Trend: Uses the Supertrend indicator to calculate major trend direction, suitable for long-term trend assessment.
2. Secondary Trend: Detects short-term trend changes, capturing finer market movements.
3. Upper and Lower Trend Bands: Utilizes ATR (Average True Range) to calculate dynamic trend channels, assisting in trend strength assessment.
4. Trading Signal Alerts: Provides buy/sell signals when trends reverse, with optional moving average filtering to reduce false signals.
5. Moving Average Filtering: Supports multiple MA types, such as EMA, SMA, HMA, McGinley, helping to filter market noise.
6. EMA 200 Bull-Bear Division Line: Combines ATR-based trend buffer zones to distinguish between long-term bull and bear markets, enhancing trend accuracy.
KEY FEATURES
1. Dual-Trend Analysis
• Primary trend is suitable for long-term trend tracking, reducing interference from short-term fluctuations.
• Secondary trend is ideal for short-term trading opportunities, allowing faster identification of market turning points.
• By combining both, traders can follow the major trend direction while using the secondary trend for optimized entry points, improving trade success rates.
2. Upper and Lower Trend Bands
• ATR-based dynamic bands adjust to market volatility, avoiding the limitations of fixed support and resistance levels.
• Trend confirmation: When the price reaches the upper or lower band, traders can determine whether the market is overheated or oversold, aiding trading decisions.
• Combining primary and secondary trend bands provides clearer trend validation, reducing false signals.
3. Trading Signal Alerts
• Automatic buy/sell signal alerts when the trend reverses, eliminating the need for manual trend assessment.
• Moving average filtering improves signal reliability, reducing false signals.
• Supports various signal markers (circles/arrows/labels) to help traders clearly visualize entry points.
4. Moving Average Filtering
• Supports multiple moving average types (SMA, EMA, HMA, WMA, McGinley, etc.), adapting to different trading styles.
• Prevents counter-trend trading:
· Long entries only when the price is above the MA filter.
· Short entries only when the price is below the MA filter.
• Customizable MA periods to suit different market conditions and prevent excessive signal noise.
5. Trading Reference Lines
• Short-term trend: HMA 25 serves as an entry reference line. Waiting for MA color changes before placing trades can improve stability.
• Long-term trend: EMA 200 as the bull-bear division line helps traders distinguish between long-term bullish and bearish trends, avoiding counter-trend trades.
• Dynamic buffer adjustment: Uses ATR-based volatility buffers to reduce false signals and enhance trend detection accuracy.
• Color-coded trend identification:
· Aqua (Bull Market): Price is above the buffer zone.
· Fuchsia (Bear Market): Price is below the buffer zone.
· White: Price is within the buffer zone, indicating an unclear market direction.
USAGE GUIDELINES
1. Applicable Markets
• Suitable for stocks, futures, cryptocurrencies, and forex
• Supports short-term trading, trend trading, and swing trading
2. Recommended Timeframes
• Short-term traders can use 5m, 15m, and 1H timeframes, leveraging secondary trend signals for quick market entries.
• Trend traders can use 4H and daily timeframes, relying on primary trend signals to assess major trends.
• Long-term investors can use the EMA 200 bull-bear division line to determine macro trend direction and avoid counter-trend trades.
3. Trading Strategy
• Long Entry:
The primary trend is bullish (Green).
The secondary trend triggers a buy signal (Long).
• Short Entry:
· The primary trend is bearish (Red).
· The secondary trend triggers a sell signal (Short).
• Enable Moving Average Filtering:
· Only enter long trades when the price is above the MA filter.
· Only enter short trades when the price is below the MA filter.
• Use EMA 200 for Market Direction:
· If the price is above EMA 200 + buffer, the market is in a bullish trend → favor long trades.
· If the price is below EMA 200 - buffer, the market is in a bearish trend → favor short trades.
• Market Volatility Considerations:
· Short timeframes (1m, 5m) may produce more noise, reducing signal reliability.
· Higher timeframes (1H, 4H, Daily) provide more stable trend signals but may miss some short-term trade opportunities.
RISK DISCLAIMER
• This indicator calculates trend direction based on historical data and cannot guarantee future market performance. When using this indicator for trading, always combine it with other technical analysis tools, fundamental analysis, and personal trading experience for comprehensive decision-making.
• Market conditions are uncertain, and trend signals may result in false positives or lag. Traders should avoid over-reliance on indicator signals and implement stop-loss strategies and risk management techniques to reduce potential losses.
• Leverage trading carries high risks and may result in rapid capital loss. If using this indicator in leveraged markets (such as futures, forex, or cryptocurrency derivatives), exercise caution, manage risks properly, and set reasonable stop-loss/take-profit levels to protect funds.
• All trading decisions are the sole responsibility of the trader. The developer is not liable for any trading losses. This indicator is for technical analysis reference only and does not constitute investment advice.
• Before live trading, it is recommended to use a demo account for testing to fully understand how to use the indicator and apply proper risk management strategies.
CHANGELOG
• v1.0: Initial release with a dual-trend system, dynamic upper and lower trend bands, trading signal alerts, moving average filtering, HMA trading reference line, and EMA 200 bull-bear division.
Search in scripts for "bear"

FVG Detector by SZEMEK>>> DESCRIPTION IN ENGLISH
An advanced indicator for the TradingView platform designed to detect and visualize Fair Value Gaps (FVG) and Inversion Fair Value Gaps (iFVG) on charts.
Main Features:
1. FVG Detection:
- The script identifies both bullish and bearish Fair Value Gaps.
- Users can choose which types of FVG to display (Bullish, Bearish, both, or none).
2. FVG Visualization:
- Gaps are represented as rectangular boxes on the chart.
- The color and transparency of the boxes are configurable separately for bullish and bearish FVG.
- The option to add a frame to FVG boxes with separate color settings.
- FVG labels are available with configurable colors and sizes.
3. Dynamic Tracking of FVG Fill:
- The script monitors the extent to which each gap has been filled by subsequent price movements.
- The fill level is visualized using gray overlay on the original FVG box.
- The percentage fill is updated on the label.
4. Automatic Removal of FVG:
- The ability to set a percentage threshold (100%, 75%, 50%, or no removal) after which FVG is removed from the chart.
5. iFVG Detection:
- The script also identifies Inversion Fair Value Gaps (iFVG), which can be displayed as separate boxes.
- iFVG are available in bullish and bearish versions.
- Users can choose which types of iFVG to display (Bullish, Bearish, both, or none).
- iFVG can also have labels and frames.
6. Limitation of Checked Candles:
- Users can specify the maximum number of candles back that the script will analyze for FVG and iFVG.
- Alerts: The indicator allows setting alerts for detected iFVG, both bullish and bearish.
Advanced Features:
- Accurate calculation of FVG fill percentage, considering both wicks and candle bodies.
- Dynamic updating of FVG boxes and their labels in real-time.
- Flexible memory management through the removal of outdated or filled FVG.
- The ability to customize the appearance of iFVG, including colors, labels, and frames.
This script serves as an advanced tool for technical analysis, enabling traders to identify potential support and resistance areas based on the concept of Fair Value Gaps and their inverted versions.
>>> DESCRIPTION IN ENGLISH
Zaawansowany wskaźnik dla platformy TradingView, który służy do wykrywania i wizualizacji luk wartości godziwej (Fair Value Gaps, FVG) oraz odwróconych luk wartości godziwej (Inversion Fair Value Gaps, iFVG) na wykresie.
Główne cechy
1. Wykrywanie FVG:
- Skrypt identyfikuje zarówno bycze (Bullish), jak i niedźwiedzie (Bearish) luki wartości godziwej.
- Użytkownik może wybrać, które typy FVG mają być wyświetlane (Bullish, Bearish, oba lub żadne).
2. Wizualizacja FVG:
- Luki są przedstawiane jako prostokątne boxy na wykresie.
- Kolor i przezroczystość boxów są konfigurowalne osobno dla FVG byczych i niedźwiedzich.
- Możliwość dodania ramki do boxów FVG z osobnymi ustawieniami kolorów.
- Etykiety FVG są dostępne z konfigurowalnymi kolorami i rozmiarami.
3. Dynamiczne śledzenie wypełnienia FVG:
- Skrypt monitoruje, w jakim stopniu każda luka została wypełniona przez późniejsze ruchy ceny.
- Stopień wypełnienia jest wizualizowany za pomocą szarego koloru nakładanego na oryginalny box FVG.
- Procent wypełnienia jest aktualizowany na etykiecie.
4. Automatyczne usuwanie FVG:
- Możliwość ustawienia progu procentowego (100%, 75%, 50% lub brak usuwania), po którego przekroczeniu FVG jest usuwany z wykresu.
5. Wykrywanie iFVG:
- Skrypt dodatkowo identyfikuje odwrócone luki wartości godziwej (iFVG), które mogą być wyświetlane jako osobne boxy.
- iFVG są dostępne w wersji byczej i niedźwiedziej.
- Użytkownik może wybrać, które typy iFVG mają być wyświetlane (Bullish, Bearish, oba lub żadne).
- iFVG również mogą mieć etykiety i ramki.
6. Ograniczenie sprawdzanych świec:
- Użytkownik może określić maksymalną liczbę świec wstecz, które skrypt będzie analizował w poszukiwaniu FVG i iFVG.
- Alerty: Wskaźnik umożliwia ustawienie alertów dla wykrytych luk iFVG, zarówno bullish, jak i bearish.
Zaawansowane funkcje
- Dokładne obliczanie procentu wypełnienia FVG, uwzględniające zarówno knoty, jak i ciała świec.
- Dynamiczne aktualizowanie boxów FVG i ich etykiet w czasie rzeczywistym.
- Elastyczne zarządzanie pamięcią poprzez usuwanie nieaktualnych lub wypełnionych FVG.
- Możliwość dostosowania wyglądu iFVG, w tym kolorów, etykiet i ramki.
Skrypt ten stanowi zaawansowane narzędzie do analizy technicznej, umożliwiające traderom identyfikację potencjalnych obszarów wsparcia i oporu bazujących na koncepcji luk wartości godziwej i ich odwróconych wersjach.

Trend Zone Moving Averages📈 Trend Zone Moving Averages
The Trend Zone Moving Averages indicator helps traders quickly identify market trends using the 50SMA, 100SMA, and 200SMA. With dynamic background colors, customizable settings, and real-time alerts, this tool provides a clear view of bullish, bearish, and extreme trend conditions.
🔹 Features:
Trend Zones with Dynamic Background Colors
Green → Bullish Trend (50SMA > 100SMA > 200SMA, price above 50SMA)
Red → Bearish Trend (50SMA < 100SMA < 200SMA, price below 50SMA)
Yellow → Neutral Trend (Mixed signals)
Dark Green → Extreme Bullish (Price above all three SMAs)
Dark Red → Extreme Bearish (Price below all three SMAs)
Customizable Moving Averages
Toggle 50SMA, 100SMA, and 200SMA on/off from the settings.
Perfect for traders who prefer a cleaner chart.
Real-Time Trend Alerts
Get instant notifications when the trend changes:
🟢 Bullish Zone Alert – When price enters a bullish trend.
🔴 Bearish Zone Alert – When price enters a bearish trend.
🟡 Neutral Zone Alert – When trend shifts to neutral.
🌟 Extreme Bullish Alert – When price moves above all SMAs.
⚠️ Extreme Bearish Alert – When price drops below all SMAs.
✅ Perfect for Any Market
Works on stocks, forex, crypto, and commodities.
Adaptable for day traders, swing traders, and investors.
⚙️ How to Use: Trend Zone Moving Averages Strategy
This strategy helps traders identify and trade with the trend using the Trend Zone Moving Averages indicator. It works across stocks, forex, crypto, and commodities.
🟢 Bullish Trend Strategy (Green Background)
Objective: Look for buying opportunities when the market is in an uptrend.
Entry Conditions:
✅ Background is Green (Bullish Zone).
✅ Price is above the 50SMA (confirming strength).
✅ Price pulls back to the 50SMA and bounces OR breaks above a key resistance level.
Stop Loss:
🔹 Place below the most recent swing low or just under the 50SMA.
Take Profit:
🔹 First target at the next resistance level or recent swing high.
🔹 Second target if price continues higher—trail stops to lock in profits.
🔴 Bearish Trend Strategy (Red Background)
Objective: Look for shorting opportunities when the market is in a downtrend.
Entry Conditions:
✅ Background is Red (Bearish Zone).
✅ Price is below the 50SMA (confirming weakness).
✅ Price pulls back to the 50SMA and rejects OR breaks below a key support level.
Stop Loss:
🔹 Place above the most recent swing high or just above the 50SMA.
Take Profit:
🔹 First target at the next support level or recent swing low.
🔹 Second target if price keeps falling—trail stops to secure profits.
🌟 Extreme Trend Strategy (Dark Green / Dark Red Background)
Objective: Trade with momentum when the market is in a strong trend.
Entry Conditions:
✅ Dark Green Background → Extreme Bullish: Price is above all three SMAs (strong uptrend).
✅ Dark Red Background → Extreme Bearish: Price is below all three SMAs (strong downtrend).
Trade Execution:
🔹 For longs (Dark Green): Look for breakout entries above resistance or pullbacks to the 50SMA.
🔹 For shorts (Dark Red): Look for breakdown entries below support or rejections at the 50SMA.
Risk Management:
🔹 Use tighter stop losses and trail profits aggressively to maximize gains.
🟡 Neutral Trend Strategy (Yellow Background)
Objective: Avoid trading or wait for a breakout.
What to Do:
🔹 Avoid trading in this zone—price is indecisive.
🔹 Wait for confirmation (background turns green/red) before taking a trade.
🔹 Use alerts to notify you when the trend resumes.
📌 Final Tips
Use this strategy with price action for extra confirmation.
Combine with support/resistance levels to improve accuracy.
Set alerts for trend changes so you never miss an opportunity.
Enjoy!

Uptrick: Portfolio Allocation DiversificationIntro
The Uptrick: Portfolio Allocation Diversification script is designed to help traders and investors manage multiple assets simultaneously. It generates signals based on various trading systems, allocates capital using different diversification methods, and displays real-time metrics and performance tables on the chart. The indicator compares active trading strategies with a separate long-term holding (HODL) simulation, allowing you to see how a systematic trading approach stacks up against a simple buy-and-hold strategy.
------------------------------------------------------------------------
Trading System Selection
1. No signals (none)
In this mode, the script does not produce bullish or bearish indicators; every asset stays in a neutral stance. This setup is useful if you prefer to observe how capital might be distributed based solely on the chosen diversification method, with no influence from directional signals.
2. rsi – neutral
This mode uses an index-based measure of whether an asset appears overbought or oversold. It generates a bearish signal if market conditions point to overbought territory, and a bullish signal if they indicate oversold territory. If neither extreme surfaces, it remains neutral. Some traders apply this in sideways or range-bound conditions, where overbought and oversold levels often hint at possible turning points. It does not specifically account for divergence patterns.
3. rsi – long only
In this setting, the system watches for instances where momentum readings strengthen even if the asset’s price is still under pressure or setting new lows. It also considers oversold levels as potential signals for a bullish setup. When such conditions emerge, the script flags a possible move to the upside, ignoring indications that might otherwise suggest a bearish trend. This approach is generally favored by those who want to concentrate exclusively on identifying price recoveries.
4. rsi – short only
Here, the script focuses on spotting signs of deteriorating momentum while an asset’s price remains relatively high or attempts further gains. It also checks whether the market is drifting into overbought territory, suggesting a potential decline. Under such conditions, it issues a bearish signal. It provides no bullish alerts, making it particularly suitable for traders who look to take advantage of overvalued scenarios or protect themselves against sudden downward moves.
5. Deviation from fair value
Under this system, the script judges how far the current price may have strayed from what is considered typical, taking into account normal fluctuations. If the asset appears to be trading at an unusually low level compared to that reference, it is flagged as bullish. If it seems abnormally high, a bearish signal is issued. This can be applied in various market environments to seek opportunities that arise from perceived mispricing.
6. Percentile channel valuation
In this mode, the script determines where an asset's price stands within a historical distribution, highlighting whether it has reached unusually high or low territory compared to its recent past. When the price reaches what is deemed an extreme reading, it may indicate that a reversal is more likely. This approach is often used by traders who watch for statistical outliers and potential reversion to a more typical trading range.
7. ATH valuation
This technique involves comparing an asset's current price with its previously recorded peak values. The script then interprets whether the price is positioned so far below the all-time high that it looks discounted, or so close to that high that it could be overextended. Such perspective is favored by market participants who want to see if an asset still has ample room to climb before matching historic extremes, or if it is nearing a possible ceiling.
8. Z-score system
Here, the script measures how far above or below a standard reference average an asset's price may be, translated into standardized units. Substantial negative readings can suggest a price that might be unusually weak, prompting a bullish indication, while large positive readings could signal overextension and lead to a bearish call. This method is useful for traders watching for abrupt deviations from a norm that often invite a reversion to more balanced levels.
RSI Divergence Period
This input is particularly relevant for the RSI - Long Only and RSI - Short Only modes. The period determines how many bars in the past you compare RSI values to detect any divergences.
------------------------------------------------------------------------
Diversification Method
Once the script has determined a bullish, bearish, or neutral stance for each asset, it then calculates how to distribute capital among all included assets. The diversification method sets the weighting logic.
1. None
Gives each asset an equal weight. For example, if you have five included assets, each might get 20 percent. This is a simple baseline.
2. Risk-Adjusted Expected Return Using Volatility Clustering
Emphasizes each asset’s average returns relative to its observed risk or volatility tendencies. Assets that exhibit good risk-adjusted returns combined with moderate or lower volatility may receive higher weights than more volatile or less appealing assets. This helps steer capital toward assets that have historically provided a better ratio of return to risk.
3. Relative Strength
Allocates more capital to assets that show stronger price strength compared to a reference (for example, price above a long-term moving average plus a higher RSI). Assets in clear uptrends may be given higher allocations.
4. Trend-Following Indicators
Examines trend-based signals, like positive momentum measurements or upward-trending strength indicators, to assign more weight to assets demonstrating strong directional moves. This suits those who prefer to latch onto trending markets.
5. Volatility-Adjusted Momentum
Looks for assets that have strong price momentum but relatively subdued volatility. The script tends to reward assets that are trending well yet are not too volatile, aiming for stable upward performance rather than massive swings.
6. Correlation-Based Risk Parity
Attempts to weight assets in such a way that the overall portfolio risk is more balanced. Although it is not an advanced correlation matrix approach in a strict sense, it conceptually scales each asset’s weight so no single outlier heavily dominates.
7. Omega Ratio Maximization
Gives preference to assets with higher omega ratios. This ratio can be interpreted as the probability-weighted gains versus losses. Assets with a favorable skew are given more capital.
8. Liquidity-Weighted Valuation
Considers each asset’s average trading liquidity, such as the combination of volume and price. More liquid assets typically receive a higher allocation because they can be entered or exited with lower slippage. If the trading system signals bullishness, that can further boost the allocation, and if it signals bearishness, the allocation might be set to zero or reduced drastically.
9. Drawdown-Controlled Allocation (DCA)
Examines each asset’s maximum drawdown over a recent window. Assets experiencing lighter drawdowns (thus indicating somewhat less downside volatility) receive higher allocations, aiming for a smoother overall equity curve.
------------------------------------------------------------------------
Portfolio and Allocation Settings
Portfolio Value
Defines how much total capital is available for the strategy-based investment portion. For example, if set to 10,000, then each asset’s monetary allocation is determined by the percentage weighting times 10,000.
Use Fixed Allocation
When enabled, the script calculates the initial allocation percentages after 50 bars of data have passed. It then locks those percentages for the remainder of the backtest or real-time session. This feature allows traders to test a static weighting scenario to see how it differs from recalculating weights at each bar.
------------------------------------------------------------------------
HODL Simulator
The script has a separate simulation that accumulates positions in an asset whenever it appears to be recovering from an undervalued state. This parallel tracking is intended to contrast a simple buy-and-hold approach with the more adaptive allocation methods used elsewhere in the script.
HODL Buy Quantity
Each time an asset transitions from an undervalued state to a recovery phase, the simulator executes a purchase of a predefined quantity. For example, if set to 0.5 units, the system will accumulate this amount whenever conditions indicate a shift away from undervaluation.
HODL Buy Threshold
This parameter determines the level at which the simulation identifies an asset as transitioning out of an undervalued state. When the asset moves above this threshold after previously being classified as undervalued, a buy order is triggered. Over time, the performance of these accumulated positions is tracked, allowing for a comparison between this passive accumulation method and the more dynamic allocation strategy.
------------------------------------------------------------------------
Asset Table and Display Settings
The script displays data in multiple tables directly on your chart. You can toggle these tables on or off and position them in various corners of your TradingView screen.
Asset Info Table Position
This table provides key details for each included asset, displaying:
Symbol – Identifies the trading pair being monitored. This helps users keep track of which assets are included in the portfolio allocation process.
Current Trading Signal – Indicates whether the asset is in a bullish, bearish, or neutral state based on the selected trading system. This assists in quickly identifying which assets are showing potential trade opportunities.
Volatility Approximation – Represents the asset’s historical price fluctuations. Higher volatility suggests greater price swings, which can impact risk management and position sizing.
Liquidity Estimate – Reflects the asset’s market liquidity, often based on trading volume and price activity. More liquid assets tend to have lower transaction costs and reduced slippage, making them more favorable for active strategies.
Risk-Adjusted Return Value – Measures the asset’s returns relative to its risk level. This helps in determining whether an asset is generating efficient returns for the level of volatility it experiences, which is useful when making allocation decisions.
2. Strategy Allocation Table Position
Displays how your selected diversification method converts each asset into an allocation percentage. It also shows how much capital is being invested per asset, the cumulative return, standard performance metrics (for example, Sharpe ratio), and the separate HODL return percentage.
Symbol – Displays the asset being analyzed, ensuring clarity in allocation distribution.
Allocation Percentage – Represents the proportion of total capital assigned to each asset. This value is determined by the selected diversification method and helps traders understand how funds are distributed within the portfolio.
Investment Amount – Converts the allocation percentage into a dollar value based on the total portfolio size. This shows the exact amount being invested in each asset.
Cumulative Return – Tracks the total return of each asset over time, reflecting how well it has performed since the strategy began.
Sharpe Ratio – Evaluates the asset’s return in relation to its risk by comparing excess returns to volatility. A higher Sharpe ratio suggests a more favorable risk-adjusted performance.
Sortino Ratio – Similar to the Sharpe ratio, but focuses only on downside risk, making it more relevant for traders who prioritize minimizing losses.
Omega Ratio – Compares the probability of achieving gains versus losses, helping to assess whether an asset provides an attractive risk-reward balance.
Maximum Drawdown – Measures the largest percentage decline from an asset’s peak value to its lowest point. This metric helps traders understand the worst-case loss scenario.
HODL Return Percentage – Displays the hypothetical return if the asset had been bought and held instead of traded actively, offering a direct comparison between passive accumulation and the active strategy.
3. Profit Table
If the Profit Table is activated, it provides a summary of the actual dollar-based gains or losses for each asset and calculates the overall profit of the system. This table includes separate columns for profit excluding HODL and the combined total when HODL gains are included. As seen in the image below, this allows users to compare the performance of the active strategy against a passive buy-and-hold approach. The HODL profit percentage is derived from the Portfolio Value input, ensuring a clear comparison of accumulated returns.
4. Best Performing Asset Table
Focuses on the single highest-returning or highest-profit asset at that moment. It highlights the symbol, the asset’s cumulative returns, risk metrics, and other relevant stats. This helps identify which asset is currently outperforming the rest.
5. Most Profitable Asset
A simpler table that underscores the asset producing the highest absolute dollar profit across the portfolio.
------------------------------------------------------------------------
Multi Asset Selection
You can include up to ten different assets (such as BTCUSDT, ETHUSDT, ADAUSDT, and so on) in this script. Each asset has two inputs: one to enable or disable its inclusion, and another to select its trading pair symbol. Once you enable an asset, the script requests the relevant market data from TradingView.
------------------------------------------------------------------------
Uniqness and Features
1. Multiple Data Fetches
Each asset is pulled from the chart’s timeframe, along with various metrics such as RSI, volatility approximations, and trend indicators.
2. Various Risk and Performance Metrics
The script internally keeps track of different measures, like Sharpe ratio (a measure of average return adjusted for risk), Sortino ratio (which focuses on downside volatility), Omega ratio, and maximum drawdown. These metrics feed into the strategy allocation table, helping you quickly assess the risk-and-return profile of each asset.
3. Real-Time Tables
Instead of having to set up complex spreadsheets or external dashboards, the script updates all tables on every new bar. The color schemes in these tables are designed to draw attention to bullish or bearish signals, positive or negative returns, and so forth.
4. HODL Comparison
You can visually compare the active strategy’s results to a separate continuous buy-on-dips accumulation strategy. This allows for insight into whether your dynamic approach truly beats a simpler, more patient method.
5. Locking Allocations
The Use Fixed Allocation input is convenient for those who want to see how holding a fixed distribution of capital performs over time. It helps in distinguishing between constant rebalancing vs a fixed, set-and-forget style.
------------------------------------------------------------------------
How to use
1. Add the Script to Your Chart
Once added, open the settings panel to configure your asset list, choose a trading system, and select the diversification approach.
2. Select Assets
Pick up to ten symbols to monitor. Disable any you do not want included. Each included asset is then handled for signals, diversification, and performance metrics.
3. Choose Trading System
Decide if you prefer RSI-based signals, a fair-value approach, or a percentile-based method, among others. The script will then flag assets as bullish, bearish, or neutral according to that selection.
4. Pick a Diversification Method
For example, you might choose Trend-Following Indicators if you believe momentum stocks or cryptocurrencies will continue their trends. Or you could use the Omega Ratio approach if you want to reward assets that have had a favorable upside probability.
5. Set Portfolio Value and HODL Parameters
Enter how much capital you want to allocate in total (for the dynamic strategy) and adjust HODL buy quantities and thresholds as desired. (HODL Profit % is calculated from the Portfolio Value)
6. Inspect the Tables
On the chart, the script can display multiple tables showing your allocations, returns, risk metrics, and which assets are leading or lagging. Monitor these to make decisions about capital distribution or see how the strategy evolves.
------------------------------------------------------------------------
Additional Remarks
This script aims to simplify multi-asset portfolio management in a single tool. It emphasizes user-friendliness by color-coding the data in tables, so you do not need extra spreadsheets. The script is also flexible in letting you lock allocations or compare dynamic updates.
Always remember that no script can guarantee profitable outcomes. Real markets involve unpredictability, and real trading includes fees, slippage, and liquidity constraints not fully accounted for here. The script uses real-time and historical data for demonstration and educational purposes, providing a testing environment for various systematic strategies.
Performance Considerations
Due to the complexity of this script, users may experience longer loading times, especially when handling multiple assets or using advanced allocation methods. In some cases, calculations may time out if too many settings are adjusted simultaneously. If this occurs, removing and reapplying the indicator to the chart can help reset the process. Additionally, it is recommended to configure inputs gradually instead of adjusting all parameters at once, as excessive changes can extend the script’s loading duration beyond TradingView’s processing limits.
------------------------------------------------------------------------
Originality
This script stands out by integrating multiple asset management techniques within a single indicator, eliminating the need for multiple scripts or external portfolio tools. Unlike traditional single-asset strategies, it simultaneously evaluates multiple assets, applies systematic allocation logic, and tracks risk-adjusted performance in real time. The script is designed to function within TradingView’s script limitations while still allowing for complex portfolio simulations, making it an efficient tool for traders managing diverse holdings. Additionally, its combination of systematic trading signals with allocation-based diversification provides a structured approach to balancing exposure across different market conditions. The dynamic interplay between adaptive trading strategies and passive accumulation further differentiates it from conventional strategy indicators that focus solely on directional signals without considering capital allocation.
Conclusion
Uptrick: Portfolio Allocation Diversification pulls multiple assets into one efficient workflow, where each asset’s signal, volatility, and performance is measured, then assigned a share of capital according to your selected diversification method. The script accommodates both dynamic rebalancing and a locked allocation style, plus an ongoing HODL simulation for passive accumulation comparison. It neatly visualizes the entire process through on-chart tables that are updated every bar.
Traders and investors looking for ways to manage multiple assets under one unified framework can explore the different modules within this script to find what suits their style. Users can quickly switch among trading systems, vary the allocation approach, or review side-by-side performance metrics to see which method aligns best with their risk tolerance and market perspective.

Waves and Harmonic Patterns by BULL┃NETThe B | N WAHA (Waves and Harmonic Patterns by BULL | NET)
indicator provides traders using CFD brokers with the most significant price and time events from the stock exchange of the underlying original index or security. For example traders are able to easily identify the price at the Daily Open and Close time of up to three additional stock exchanges. Traders can choose from a huge list of options including the values from the current and previous Day, Week, Month and Year. In addition traders can enable the display of the Expected Move by either implied or historical volatility. The indicator can show Open Gaps (gap between close and open of two trading sessions) also which traders would usually see only on the original chart of an index or security.
The B | N WAHA indicator can help traders to make better entry decisions based on the real market sessions.
█ ⚠️ DISCLAIMER – READ BEFORE YOU USE ⚠️
█ FEATURES
— PATTERN OPTIONS
● Deviation for ratio calculation
Any pattern has a unique set of ratios for different retracements. In a perfect world each ratio would be hit exactly. But the stock market is far from perfect and especially in volatile markets ratios have to be adjusted. The default is 5%. The maximum is 10%
● (Name of pattern)
The list of patters recognized will grow with new versions of the indicator. The settings for each pattern are the same.
Each available pattern will be recognized and drawn by default. If you disable the checkbox in front of the pattern name the indicator will ignore this pattern completely no matter if another checkbox for this pattern is active.
● Developing
As soon as a new possible pattern is recognized, the indicator will draw a label at the starting point (0, A or X) of the pattern. For the indicator “possible” means there is only the last point missing, which is D in case of ABCD and XABCD patterns. Once the last point has reached the completion price range, the indicator will draw the pattern. If you enable this checkbox the indicator will draw a zickzack line between the already existing points.
● Projection
If there is a new possible pattern the indicator will draw a projection box to indicate the price range where the final point has to be located for completion of the pattern. Don’t confuse this with a buy or sell signal! The appearance of the box doesn’t tell anything about the chance of a pattern to get completed. It simply tells you that the price has to reach the box and to retrace within the box to form a valid pattern. This allows you to prepare a strategy if the price hits the box. If you disable the checkbox no box will be drawn.
● History
For backtesting or learning purpose you can display all historical occurrences of a pattern. Best practice is to disable all other patterns and enable the history checkbox only together with the checkbox of the patten name.
— PIVOPOINT OPTIONS
To identify patterns you need pivot points. True high and lows in the chart. If you use B | N GABO or B | N DESC you already know about this concept. The indicator is using three different levels of pivot points in parallel for better detection of patterns.
● Level 1
This is the fast running pivot level. You can choose from 2 to 4. Default is 3.
● Level 2
This is the pivot level with medium pace. Selectable levels are 5 to 9. Default is 5.
● Level 3
This is the slow running pivot level. The minimum level is 10, the maximum is 20. The default is 15.
● Pivotpoints
By default pivot points are not displayed on the chart because this ads a lot of noise. For backtesting and learning purposes you can enable this option.
● Label
● Text
● Size
This three settings define the appearance of the pivot points.
— HARMONIC PATTERN OPTIONS
The settings in this section control how the zickzack line of a pattern gets drawn on the chart. The settings for bullish and bearish pattern are identical.
● Show bullish/bearish pattern
By default both types of patterns are drawn on the chart. For backtesting or learning purpose you can disable it.
● Line
The color of the zickzack lines.
● ABC
The line style to connect points A, B and C.
● CD
The line style to connect points C and D.
● (Line Width)
The width of lines ABC and CD.
● Label
The color of the label for a completed pattern. This label marks starting point.
● Developing
The color of the label while a pattern is developing.
● Text
The color of the text in the label.
● (Text size)
The size of the text.
— HARMONIC PATTERN LABEL OPTIONS
The label which marks the start of a pattern can contain multiple information. To reduce noise on the chart you can disable each information separately. If you disable them all, the label will display the designation of the pattern starting point, e.g. “A” for an ABCD or “X” for an XABCD.
● Title
The title identifies the type of pattern. E.g. a possibly developing ABCD pattern will display ABC at the beginning to denote the point A, B and C have been detected. If this pattern completes the title would change to ABCD in case of a standard ABCD pattern or to AB=CD if the pattern matches all criteria needed for this ‘perfect’ type of ABCD.
● Number
Each pattern carries a unique number needed to identify the projection and targets in case there are multiple patterns in parallel.
● Ratio
First this is the retracement level of point C from point B toward point A. It is the decimal value of the percentage. In a perfect world this would be 0.618 (61.8%). In volatile markets this can be as low as 0.382 and as high as 0.786. If Ratio is enabled BD ratio will get displayed as well once point D is about to complete a ABCD pattern.
● Tooltip
Enabled by default the tooltip shows all the information and more if you hover the mouse pointer over the label.
● Perfect
If the pattern is formed “perfect” it will change its color to denote a possibly strong trend reversal. E.g. a perfect AB=CD is formed if the time and price difference between A and B is equal to the time and price difference between C and D. The calculation contains a 5% deviation to reflect usual market conditions.
— PROJECTION OPTIONS
If the “Projection” checkbox of a pattern is enabled (See PATTERN OPTIONS) the indicator will display the price range where the final point must sit to form a valid pattern. You can customize the box that marks this price range or disable it at all.
● Bull / Bear
The color of the box border.
● (Style)
The line style of the box border.
● Background
The background color of the box.
● Text
The color of the text in the box.
● (Text size)
The size of the text.
— PROJECTION DESCRIPTION OPTIONS
The box which marks the possible landing zone for pattern completion can contain multiple information. To reduce noise on the chart you can disable each information separately.
● Price Range
To complete a pattern successfully point D needs to be located within the minimum and maximum price of the range. For bullish pattern the price range is increasing (e.g. 100 – 120) and for bearish pattern it is decreasing (e.g. 100 – 80).
● Title
The title identifies the type of pattern. E.g. a possibly developing ABCD pattern will display ABC at the beginning to denote the point A, B and C have been detected. If this pattern completes the title would change to ABCD in case of a standard ABCD pattern or to AB=CD if the pattern matches all criteria needed for this ‘perfect’ type of ABCD.
● Number
Each pattern carries a unique number needed to identify the projection and targets in case there are multiple patterns in parallel.
— TARGET OPTIONS
● Display ABCD Targets
Once a pattern is completed the indicator will display multiple price lines for targets or other important price levels. This is enabled by default.
The cosmetic setting are separated for bullish and bearish pattern targets. However they are identical.
● Bull / Bear Line
The color of the target lines.
● (Line style)
The style of the target lines.
● Label
The color of the label which contains information about the target.
● Text
The color of the text in the label.
● (Text size)
The size of the text.
— TARGET LABEL OPTIONS
The target label can contain multiple information. To reduce noise on the chart you can disable each information separately. If you disable all information a blank label will be displayed necessary to hold the tooltip.
● Price
The target price.
● Number
The unique number of the pattern.
● Title
The target identifier.
● Direction
New traders often get confused with bullish and bearish pattern. A small arrow facing down or up will tell them the expected price move to reach the targets.
● Tooltip
If enabled the tooltip shows all the information and more if you hover the mouse pointer over the label.
● Remove if hit
By default target lines and labels will get removed one bar after the price has hit the target. If you disable this option target lines will stay together with the pattern until it gets invalidated.
— DISPLAY OPTIONS
● 2 Decimals
To streamline the appearance of prices they are set to display two decimals only. Numbers get rounded! However, trading currency pairs or crypto assets might need to display the full amount of decimals. In this case simply disable the setting “2 Decimals”.
— ALERT OPTIONS
Bevor you can use alerts in TradingView you have to activate them.
1. Click on the alert button
2. From the first drop down in conditions select B | N WAHA
3. From the third drop down (the one below the first one) select Any alert() function call
4. Skip the expiration if you want the alerts to be active for ever
5. Give The Alert a name or keep the default
6. Click on create
You have to repeat this procedure in every timeframe you use. This is not a limitation of the indicator. This is how TradingView alerts work.
Now you can select the events in the alert options of B | N WAHA you want to get noticed about. Alerts get fired when a bar gets confirmed which is the last close of a bar.
-------------------------------------------------------
Disclaimer BullNet: The information provided in this document is for educational and informational purposes only and does not constitute financial, investment, or trading advice. Any use of the content is at your own risk. No liability is assumed for any losses or damages resulting from reliance on this information. Trading financial instruments involves significant risks, including the potential loss of all invested capital. There is no guarantee of profits or specific outcomes. Please conduct your own research and consult a professional financial advisor if needed.
Disclaimer TradingView: According to the www.tradingview.com
Copyright: 2025-BULLNET - All rights reserved.
Roadmap:
Version 1.0 03.03.2025

Marubozu and Strong Candle DetectorMarubozu and Strong Candle Detector - Indicator Description
This TradingView Pine Script indicator identifies powerful price action signals by detecting two key candle types that can signal strong market momentum:
What It Detects
1. Marubozu Candles: These are candles with little to no wicks, where the body makes up almost the entire candle. Marubozu means "bald head" or "shaved head" in Japanese, referring to the absence of shadows (wicks).
o Bullish Marubozu: A green/up candle with minimal wicks, showing buyers controlled the entire session
o Bearish Marubozu: A red/down candle with minimal wicks, showing sellers dominated the session
2. Strong Candles: These are candles that are significantly larger than the recent average, suggesting exceptional momentum.
o Strong Bullish: Large green/up candles showing powerful buying pressure
o Strong Bearish: Large red/down candles showing powerful selling pressure
Trading Significance
• Bullish Marubozu/Strong Bullish Candles: Often signal the beginning of bullish trends or strong continuation of existing uptrends. These can be excellent entry points for long positions.
• Bearish Marubozu/Strong Bearish Candles: Often indicate the start of bearish trends or powerful continuation of existing downtrends. These can be good entry points for short positions or exit points for long positions.
Key Features
• Customizable Parameters: Adjust sensitivity for body ratio threshold and size comparison
• Visual Indicators: Easy-to-spot markers appear on your charts
• Information Display: Shows key metrics about the current candle
• Alert System: Set notifications for when significant candles form
How To Use This Indicator
1. For Entry Signals:
o Look for bullish Marubozu/strong bullish candles at support levels or after pullbacks
o Look for bearish Marubozu/strong bearish candles at resistance levels or after rallies
2. For Exit Signals:
o Consider taking profits on long positions when bearish Marubozu/strong bearish candles appear
o Consider taking profits on short positions when bullish Marubozu/strong bullish candles appear
3. For Trend Confirmation:
o Multiple signals in the same direction strengthen the case for a trend
This indicator works best on larger timeframes (1H, 4H, Daily) where candle formations have more significance, but can be applied to any timeframe based on your trading style.

beanBean's Multi-Instrument Pattern Scanner.
This indicator scans H1 timeframe for specific technical patterns. Here's how each pattern is detected:
PATTERN DETECTION CRITERIA:
1. Hammer
- Body Size: ≤ 30% of total candle length
- Lower Wick: > 50% of total candle length
- Upper Wick: < 20% of total candle length
- Formula:
* bodySize = |close - open|
* upperWick = high - max(open, close)
* lowerWick = min(open, close) - low
* totalLength = high - low
2. Shooting Star
- Body Size: ≤ 30% of total candle length
- Upper Wick: > 50% of total candle length
- Lower Wick: < 20% of total candle length
- Uses same measurements as Hammer but inverted
3. Outside/Inside (OI)
Checks three consecutive bars:
- Outside Bar: Bar2 high ≥ Bar3 high AND Bar2 low ≤ Bar3 low
- Inside Bar: Bar1 high ≤ Bar2 high AND Bar1 low ≥ Bar2 low
Pattern confirms when both conditions are met
4. Bullish/Bearish Umbrella
Checks two consecutive bars:
Bullish:
- Current bar's high ≤ previous bar's high
- Current body high ≤ previous bar's high
- Current body low ≥ previous body high
Bearish:
- Current bar's low ≥ previous bar's low
- Current body low ≥ previous bar's low
- Current body high ≤ previous body low
5. Three Bar Triangle (3BT)
Checks three consecutive bars:
- Current bar's high ≤ max(previous two highs)
- Current bar's low ≥ min(previous two lows)
- Indicates price compression
DISPLAY AND ALERTS:
- Patterns are displayed in real-time in the table
- Multiple patterns can be detected simultaneously
- Pattern detection resets each new H1 candle
CONFIGURATION:
- Each row can be independently configured
- Patterns are checked on H1 timeframe close
- Alert frequency: Once per H1 bar close
Note: All measurements use standard OHLC values from only completed H1 candles.
Enhanced Interval Candle with Breakout Detection and Detailed InThis indicator visualizes the last candle of a user-defined time interval (e.g., 1 hour, 4 hours, 1 day) on the current chart, providing enhanced details and breakout detection. It fetches the open, high, low, and close prices of the interval candle and draws a stylized representation of it, offset to the right of the current bar. The candle body and wicks are colored according to whether the interval candle closed bullishly (green) or bearishly (red). In addition to the candle itself, the indicator displays horizontal dotted lines representing the high, low, and midpoint of the interval candle, along with labels showing their exact values. These labels are dynamically updated as the interval candle changes. Furthermore, the script detects and visualizes breakouts of the interval candle's high or low. When the current price closes above the interval high, a green dashed line and a "Bullish Breakout" label are displayed. Conversely, when the current price closes below the interval low, a red dashed line and a "Bearish Breakout" label are shown. The breakout lines and labels are also dynamically updated. This indicator helps traders easily track the price action of a higher timeframe candle and spot potential breakouts based on that candle's range. The user can configure the time interval to suit their trading needs.

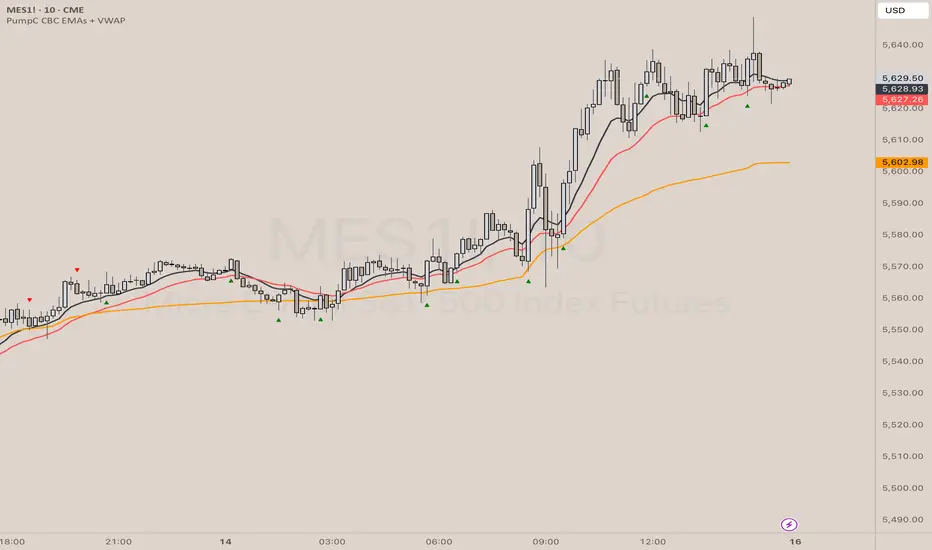
PumpC CBC EMAs + VWAPPumpC CBC EMAs + VWAP Indicator for Tradingview
Introduction
This is an indicator for the Candle By Candle (CBC) Flip strategy , based on the CBC Flip concept taught by MapleStax and inspired by the original CBC Flip indicator by AsiaRoo . The CBC Flip strategy is a simple yet effective approach to gauge if bulls or bears are in control for any given candle.
The logic behind the CBC Flip is as follows:
Bullish Flip : If the most recent candle’s close is above the previous candle’s high, bulls have taken control.
Bearish Flip : If the most recent candle’s close is below the previous candle’s low, bears are now in control.
No Flip : If neither condition is met, the previously dominant side (bulls or bears) remains in control until one of these conditions is satisfied, flipping the market sentiment—hence the name CBC Flip .
The PumpC CBC EMAs + VWAP Indicator enhances this simple strategy by adding trend confirmation filters using EMAs and VWAP , along with time-restricted signal generation and fully customizable alerts.
What Does This Indicator Do?
The PumpC CBC EMAs + VWAP Indicator helps traders identify CBC Flips to spot potential trend continuations or reversals. It combines candlestick logic , trend filters , and time-based restrictions to provide high-probability trade signals.
CBC Flip Detection
Bullish Flip : Current close is above the previous candle’s high.
Bearish Flip : Current close is below the previous candle’s low.
Strict Flips : Require a liquidity sweep for higher accuracy.
All Flips : Looser conditions that generate more frequent signals.
EMA and VWAP Trend Confirmation (Optional)
This filter ensures that long signals only trigger when the Slow EMA is above the VWAP , confirming an upward trend. For short signals, the Slow EMA must be below the VWAP.
Time-Based Filtering
The indicator allows you to set a specific trading window (e.g., 9:00 AM to 3:00 PM), helping you avoid low-volume or high-risk periods.
Visual Labels and Alerts
Labels : Arrows (▲ for long and ▼ for short) mark CBC Flip points on the chart.
Alerts : Fully customizable notifications for each signal type, based on your chosen filters.
Key Features
CBC Flip Detection : Identify potential reversals and trend continuations.
Strict vs. All Flips : Choose between higher-accuracy strict flips or more frequent all flips.
EMA-to-VWAP Filter : Optional trend confirmation filter to reduce false signals.
Customizable EMAs and VWAP : Configure lengths and colors for visual clarity.
Time-Restricted Signals : Focus on your preferred trading session.
Custom Alerts : Notifications for long and short signals based on filter settings.
Credits and Inspiration
The CBC Flip strategy was created by MapleStax .
This indicator is inspired by the original CBC Flip indicator by AsiaRoo .
Additional enhancements include EMA-to-VWAP filtering , custom alerts , and time-restricted signal generation for a more comprehensive trading experience.
Risks and Disclaimer
This indicator is for educational purposes only and does not constitute financial advice.
Trading involves significant risk, and past performance does not guarantee future results. Always test this indicator in a simulated environment before live trading.
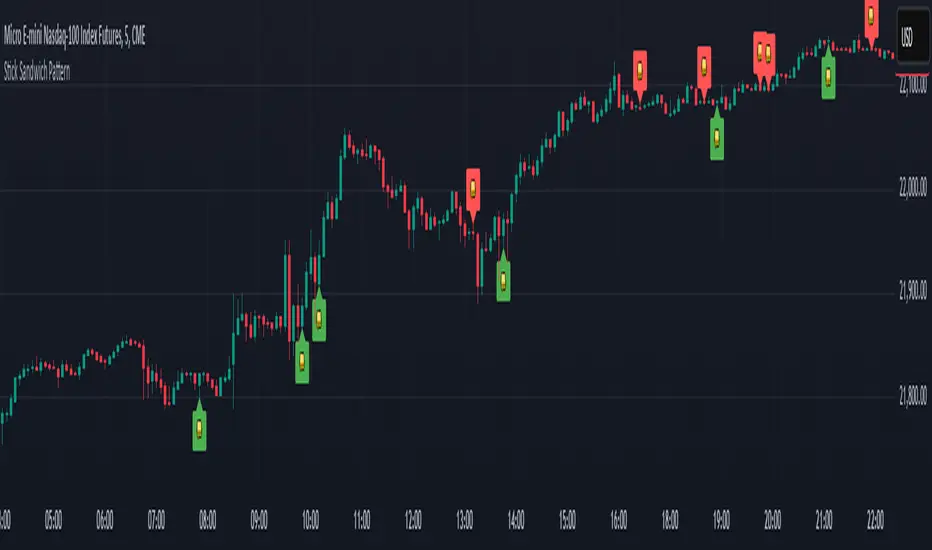
Stick Sandwich Pattern# Stick Sandwich Pattern Indicator
## Description
The Stick Sandwich Pattern Indicator is a custom TradingView script that identifies specific three-candle patterns in financial markets. The indicator uses a sandwich emoji (🥪) to mark pattern occurrences directly on the chart, making it visually intuitive and easy to spot potential trading opportunities.
## Pattern Types
### Bullish Stick Sandwich
A bullish stick sandwich pattern is identified when:
- First candle: Bullish (close > open)
- Second candle: Bearish (close < open)
- Third candle: Bullish (close > open)
- The closing price of the third candle is within 10% of the first candle's range from its closing price
### Bearish Stick Sandwich
A bearish stick sandwich pattern is identified when:
- First candle: Bearish (close < open)
- Second candle: Bullish (close > open)
- Third candle: Bearish (close < open)
- The closing price of the third candle is within 10% of the first candle's range from its closing price
## Technical Implementation
- Written in Pine Script v5
- Runs as an overlay indicator
- Uses a 10% tolerance range for closing price comparison
- Implements rolling pattern detection over the last 3 candles
- Break statement ensures only the most recent pattern is marked
## Visual Features
- Bullish patterns: Green sandwich emoji above the pattern
- Bearish patterns: Red sandwich emoji below the pattern
- Label size: Small
- Label styles:
- Bullish: Label points upward
- Bearish: Label points downward
## Usage
1. Add the indicator to your TradingView chart
2. Look for sandwich emojis that appear above or below price bars
3. Green emojis indicate potential bullish reversals
4. Red emojis indicate potential bearish reversals
## Code Structure
- Main indicator function with overlay setting
- Two separate functions for pattern detection:
- `bullishStickSandwich()`
- `bearishStickSandwich()`
- Pattern scanning loop that checks the last 3 candles
- Built-in label plotting for visual identification
## Formula Details
The closing price comparison uses the following tolerance calculation:
```
Tolerance = (High - Low of first candle) * 0.1
Valid if: |Close of third candle - Close of first candle| <= Tolerance
```
## Notes
- The indicator marks patterns in real-time as they form
- Only the most recent pattern within the last 3 candles is marked
- Pattern validation includes both candle direction and closing price proximity
- The 10% tolerance helps filter out weak patterns while catching meaningful ones
## Disclaimer
This indicator is for informational purposes only. Always use proper risk management and consider multiple factors when making trading decisions.
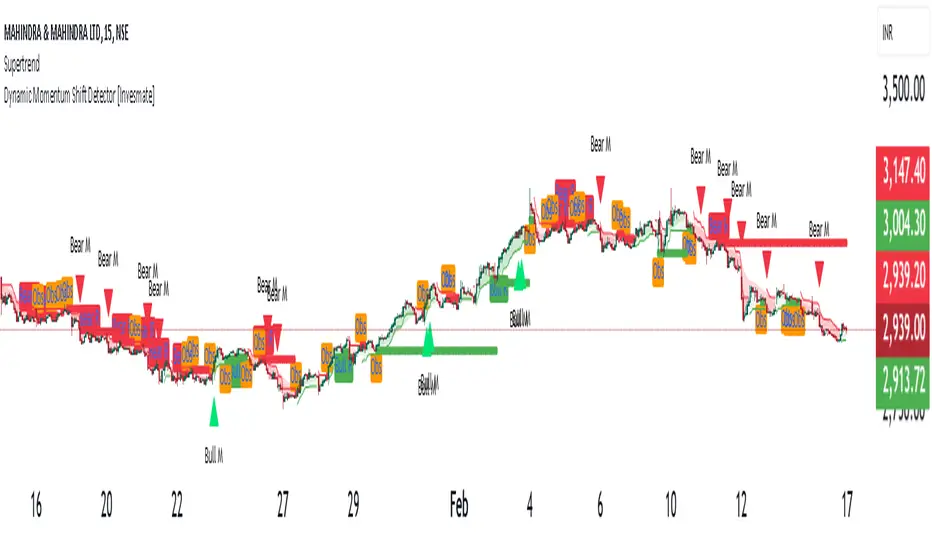
Dynamic Momentum Shift Detector [Invesmate]Dynamic Momentum Shift Detector
Overview
The Dynamic Momentum Shift Detector is an advanced trend-following and momentum-based indicator designed to help traders identify high-probability trading opportunities. It combines RSI-based momentum detection, Supertrend confirmation, and EMA sentiment tracking to provide reliable buy and sell signals.
This indicator is useful for traders who rely on price action and momentum shifts to make informed trading decisions. The goal is to capture early trend reversals while filtering false signals using multiple confirmations.
Key Features & Unique Aspects
RSI (2-Period) for Momentum Detection
Uses an extremely short 2-period RSI to detect overbought (75) and oversold (25) conditions.
Buy Signal: RSI crosses above 25 and price is above the Supertrend line.
Sell Signal: RSI crosses below 75 and price is below the Supertrend line.
Supertrend for Trend Confirmation
A Supertrend (ATR 20, Factor 2) is used to validate the overall market trend.
Prevents false breakouts by ensuring buy signals occur above the Supertrend line and sell signals occur below it.
21-EMA Sentiment Filter
A 21-period Exponential Moving Average (EMA) acts as a market sentiment indicator.
Background color changes for quick visual cues:
Green Fill: Price is above EMA (bullish sentiment).
Red Fill: Price is below EMA (bearish sentiment).
Refined Buy/Sell Confirmation Criteria
To eliminate weak signals, additional price action conditions are applied:
Buy Confirmation: Higher high, bullish close, and strong candle body (>40% of range).
Sell Confirmation: Lower low, bearish close, and strong candle body (>40% of range).
Persistent Buy/Sell Levels
Displays persistent buy and sell levels (green/red dots) on the chart.
These remain active until invalidated by price action.
Bull & Bear Momentum (RSI-8 for Strong Reversals)
Bull M (Green Triangle): RSI (8) crosses above 72 with a strong bullish candle (>60% body).
Bear M (Red Triangle): RSI (8) crosses below 27 with a strong bearish candle (>60% body).
How to Use the Indicator
Buy Setup:
✅ Look for a green "Bull R" signal when:
RSI crosses above 25.
Price is above Supertrend & EMA 21.
Additional confirmation from bullish candle structure.
Sell Setup:
✅ Look for a red "Bear R" signal when:
RSI crosses below 75.
Price is below Supertrend & EMA 21.
Additional confirmation from bearish candle structure.
Observation Signals:
⚠️ "Obs Buy" (Orange Label) → Possible buy setup, but missing confirmation.
⚠️ "Obs Sell" (Orange Label) → Possible sell setup, but missing confirmation.
Momentum Reversal Markers (Strong Buy/Sell Signals)
🔺 "Bull M" (Green Triangle) → Strong bullish momentum shift detected.
🔻 "Bear M" (Red Triangle) → Strong bearish momentum shift detected.
Why This Indicator is Unique & Valuable
✔ Combines multiple indicators (RSI, Supertrend, EMA) with a structured approach.
✔ Avoids false signals by requiring confirmation from price action.
✔ Provides persistent support/resistance levels to track active trades.
✔ Visually clean and easy to use with minimal chart clutter.
This indicator is suitable for swing traders, intraday traders, and positional traders who want high-probability setups with clear trend direction.
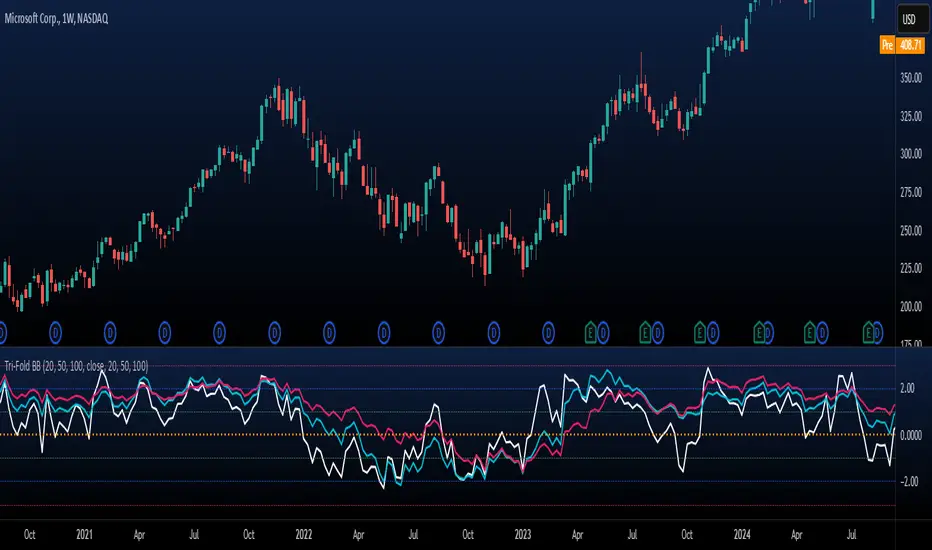
Tri-Fold BB(Trend-Strength)*indicator isn't preset to look as displayed, do so accordingly*
"Tri-Fold BB" is an indicator that utilizes three Bollinger Bands, each of different length as a way to represent trend strength. This allows one to see the trend strength relative to multiple timeframes: short, mid, and long term trend strength. This is helpful because it provides the user with a holistic view of the asset.
How it Works
The indicator is preset to utilizing three different Bollinger Bands with length: 20, 50, and 100. This indicator simply plots the price of an asset relative to its specified Bollinger Band. For an example, if the price of the asset were to surpass its 20BB standard deviations, it would display so accordingly, though from the perspective of lets say... the 100, it may have looked like it barely moved up a standard deviation relative to 100BB because the standard deviations of a 100BB are more spread out.
Its important to view the trend strength from multiple lengths because it allows one to gauge whether the short term trend strength is likely to hold or not. A better way to speculate on asset behavior.
Another way to view this indicator is similar to that of the BB% indicator, except this indicator allows us to view price relative to standard deviations, across multiple timeframes. More holistic, more utility provided.
Basic Understanding:
Each line = Standard Deviation (3 upper, 3 lower)
Mid-Line = Basis relative to BB(20sma, 50sma, 100sma)
If price goes under Basis, that means it crossed below their specified sma(significant bull or bear signal)
I've also added HMA's relative to each BB incase one were to decide in creating some sort of trading strategy with it. I personally don't use them but I understand that it could be helpful to some so I left it in there. If you don't like them then simply deselect them and then save your desired setup as default.
In regard to regular indications of bullish or bearishness, i'd like to add that I use this indicator for the sole purpose of providing an idea of trend strength. I personally am unsure to state that cross overs directly indicate that there is a bull or bear move because I've seen instances where the price of an asset went in a direction contrary to what it 'should' have if we were to use that cross over strategy. Though of course, feel free to use this indicator as desired.
Trend Strength & Direction📌 Assumptions of the "Trend Strength & Direction" Model
This model is designed to measure both trend strength and trend direction, using a modified version of the ADX (Average Directional Index) while also identifying ranging markets. Below is a detailed breakdown of all key assumptions.
1️⃣ Using ADX as the Basis for Trend Strength
Why ADX?
The ADX (Average Directional Index) is one of the most commonly used indicators for measuring trend strength, regardless of direction.
How is it calculated?
ATR (Average True Range) is used to normalize volatility.
Directional movement (+DM and -DM) is smoothed with an Exponential Moving Average (EMA) to obtain the +DI (Positive Directional Indicator) and -DI (Negative Directional Indicator).
Trend strength is derived by normalizing the absolute difference between +DI and -DI, divided by the sum of both.
🔹 Assumption: A high ADX means the trend is strong (whether bullish or bearish).
2️⃣ 50-Period Moving Average for Trend Strength
Why add a moving average?
ADX can be very volatile in the short term.
A 50-period SMA (Simple Moving Average) is used to smooth out trend strength and identify sustained trends.
🔹 Assumption: The SMA reduces false signals caused by short-term ADX spikes.
3️⃣ Identifying a Ranging Market (ADX Below 35)
How is a ranging market defined?
If the trend strength (ADX) is below 35, the market is considered "ranging".
The 35-level threshold is chosen empirically since ADX values below this level often indicate a lack of strong price direction.
When the market is ranging, the background color turns yellow.
🔹 Assumption: ADX < 35 indicates a sideways market, so the indicator colors the background yellow.
4️⃣ Determining Trend Direction Using +DI and -DI
How is direction determined?
If +DI > -DI, the trend is bullish (green).
If -DI > +DI, the trend is bearish (red).
If ADX is below 35, the market is ranging and turns yellow.
🔹 Assumption: Trend direction is determined by the relationship between +DI and -DI, not ADX values.
5️⃣ Background Color to Highlight Market Conditions
Yellow background if ADX < 35 → Ranging market.
Green background if ADX ≥ 35 and bullish.
Red background if ADX ≥ 35 and bearish.
🔹 Assumption: The background color visually differentiates trending vs. ranging phases.
6️⃣ Reference Levels for ADX
Lateral Threshold (35) → Below this, the trend is weak or ranging.
Neutral Threshold (50) → Intermediate level indicating moderate trend strength.
Strong Trend Threshold (75) → Above this, the trend is very strong and possibly overextended.
🔹 Assumption: ADX above 75 indicates a very strong trend, potentially near exhaustion.
🔹 Summary of Key Assumptions
1️⃣ ADX is the core strength metric → Strong trends when ADX > 35, weak below 35.
2️⃣ The 50-period SMA smooths out volatility → Prevents false signals.
3️⃣ Ranging markets are defined as ADX < 35 → Yellow background color.
4️⃣ Trend direction is based on +DI vs. -DI → Green = bullish, Red = bearish.
5️⃣ Background colors enhance readability → Helps distinguish different market phases.
6️⃣ ADX reference levels (35, 50, 75) indicate increasing trend strength.
Conclusion
This model combines ADX with a moving average and color-based logic to highlight trend strength, trend direction, and sideways markets. It helps traders quickly identify the best conditions for entering or exiting trades. 🚀

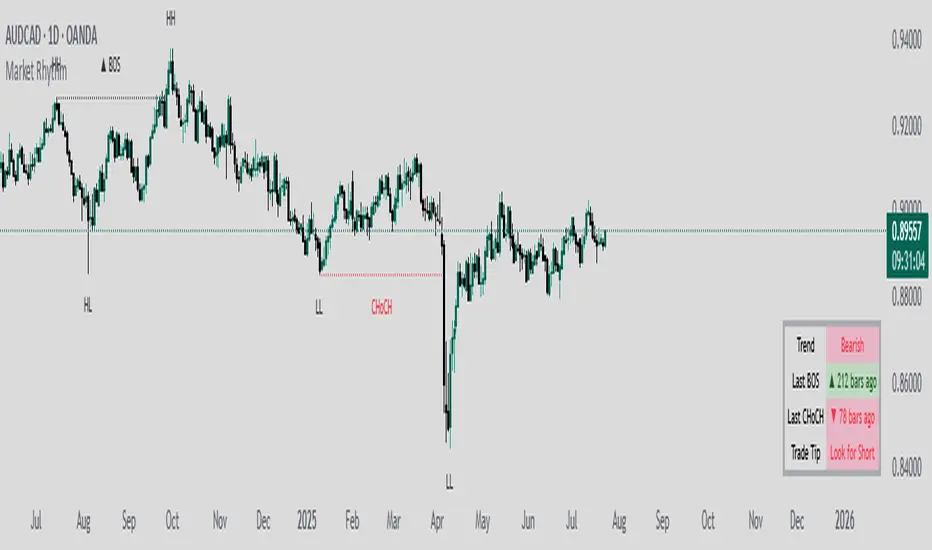
Market RhythmMarket Rhythm
Overview
If you’re a price-action enthusiast who loves to stay on top of structural shifts in the market, Market Rhythm is here to supercharge your charting experience! This script automatically identifies swing points (HH, LH, HL, LL), detects breaks of structure (BOS), flags changes of character (CHoCH), and offers an optional Trade Tip to guide your next move. It also provides a sleek table summarizing the latest signals so you can confirm momentum or pivot-based ideas at a glance.
What It Does
Swing Detection
Spots the last few pivot highs and lows on your chart.
Labels them as HH (Higher High), LH (Lower High), HL (Higher Low), or LL (Lower Low).
You can display all identified swings or only the most recent ones.
Adaptive Swing Logic
Optionally invert your swing lengths when the script detects a bearish trend, allowing it to adapt pivot detection automatically.
This means if the market flips to a downtrend, pivot detection reconfigures itself in real time.
Break of Structure (BOS)
If price breaks above the previous swing high or below the previous swing low, the script prints a BOS line on the chart.
You can choose whether to confirm breakouts via candle closes or wicks.
CHoCH (Change of Character)
When a BOS flips from bullish to bearish (or vice versa) against the prior direction, it’s renamed CHoCH for added clarity.
Color-coded lines and labels let you instantly see if the market’s “character” is reversing.
Optional Trade Tip
The script can suggest “Look for Long” or “Look for Short” based on your last pivot type and overall trend direction.
This “Trade Tip” is completely optional: enable or disable it in the settings, and the table reconfigures itself automatically.
Information Table
A compact on-chart table gives you an at-a-glance summary of:
Trend – Are we bullish, bearish, or uncertain?
Last BOS – If there’s a recent break of structure, how many bars ago did it happen?
Last CHoCH – If the market made a sudden reversal, how many bars back?
Trade Tip (Optional) – Summarizes whether conditions favor a long or short setup, or if it’s best to wait.
Alerts
Built-in alert conditions let you know when a BOS or CHoCH happens (bullish or bearish).
Turn them on to receive notifications without staring at the screen all day.
Chart Elements
Swing Labels: “HH,” “LH,” “HL,” “LL” near the pivot bars.
BOS & CHoCH Lines: Solid/dashed/dotted lines drawn across your chart, marking the level of structure that got broken.
Color Codes: Bullish signals are tinted in blue-ish tones, bearish signals in pink/purple-ish tones, making it easy to parse your chart visually.
Trade Tip Row: If enabled, instantly highlights “Look for Long” or “Look for Short” in a color-coded cell (blue for long, purple for short, gray if none).
Key Settings
Swing Points
Swing Points Display: Show all pivots, only the last set, or no pivots at all.
Invert Right Swing in Bearish Trend: Automatically swap your “Right Swing Length (High)” and “Right Swing Length (Low)” once the script detects a bearish trend (signaled by the most recent CHoCH).
Left Swing Length / Right Swing Length High/Low: Control how sensitive pivot detection is for highs vs. lows.
Pivot Source: Decide if your pivots are based on candle closes or wicks.
BOS Settings
Show BOS: Hide or reveal the Break of Structure lines entirely.
BOS Confirmation: Candle closes or wicks needed for a “true” breakout.
Line Style / Width / Color: Customize the BOS lines to your liking.
Show Only Last BOS: Show only the freshest BOS or keep historical ones on the chart.
CHoCH Settings
Show CHoCH: Rename the first opposite BOS to CHoCH if desired.
Bullish/Bearish Colors: Pick your favorite color theme for CHoCH lines.
Line Style / Width / Show Only Last CHoCH: Similar customizing options as BOS lines.
Table Settings
Show Table: Toggle the entire summary table on/off.
Position & Text Size: Choose table location (top-left, bottom-right, etc.) and text size (small to huge).
Show 'Trade Tip' row: Decide whether to add a fourth row that suggests potential trade direction. If disabled, the table has only three rows (Trend, Last BOS, and Last CHoCH).
Alerts
Several alert conditions are built in (e.g., “Bullish BOS Alert,” “Bearish BOS Alert,” “CHoCH Alert,” etc.), so you can set notifications for real-time structural shifts.
Why You’ll Love It
Visual Clarity: No more guesswork on which pivot was broken or whether a CHoCH just took place—color-coded lines and labels handle it.
Flexible Pivot Logic: Candle closes vs. wicks, separate right swing lengths for highs and lows, and an adaptive approach if the market goes bearish.
Quick Glance Table: Summaries of the latest signals keep you in the loop without cluttering your chart.
Trade Tip Option: Let the script gently nudge you toward potential bullish or bearish setups—only if you want it to!
Alerts for Everything: BOS and CHoCH can trigger alerts so you never miss a key structural change.
Give Market Rhythm a go, and watch your chart transform into a dynamic story of structure breaks, pivot swings, and potential trade cues. Whether you’re a short-term scalper or a higher-timeframe swing trader, this tool aims to simplify your analysis and keep you laser-focused on what matters.
Adaptive Sharp Momentum█ Introduction
The Adaptive Sharp Momentum Study has the following all-in-one features:
• A noise-free, trend-following indicator.
• Automatically detects implied tops and bottoms within fast price cycles.
• It identifies price consolidations and periods of indecision; often challenging to spot.
• Includes a unique feature for detecting directional price squeezes.
• An integrated volatility measure helps avoid false signals and clarifies trend direction.
• Lastly, it alerts traders when a volume climax is likely reached during a move.
This study primarily focuses on capturing momentum while concurrently alerting traders to shifting market dynamics, thereby aiding in the decision to either extend a position’s duration or optimize exit timing. The set of analytical tools, deployed alongside the trend-following indicator, are integrated to reflect the concepts outlined above. Furthermore, this framework utilizes distinctive methods for trend identification, consolidation recognition, directional squeeze assessment, and volume climax analysis—approaches that are not currently documented in publicly available resources.
█ Explanation of Core Components
1. Trend Following Consolidated Adaptive Moving Average:
At the core of the study is the Jurik Adaptive Average Curve, a fast-response adaptive moving average refined with an adaptive Relative Strength Index (RSX) function, known as Jurik RSX. This curve displays three trend modes—bullish, bearish, and indecisive—each customizable in color.
Users can adjust parameters such as the Phase and Consolidation Period:
• Phase: Influences the timing of trend signals, accommodating various trading styles. A lower phase value can produce leading signals, while a higher value may result in lagging signals.
• Consolidation Period: Helps filter out false signals. Optimize this period based on the time frame and instrument.
• Momentum Slope Threshold: As mentioned earlier, the Jurik moving average values are consolidated against the Dynamic Jurik RSX. Crossing the slope threshold of the Jurik RSX will trigger consolidation.
The main curve in the middle represents the overall trend. The issue with moving averages is that they work well in trends but when market is in consolidation, many false signals can be generated. The consolidation period acts as a second fast signal curve that helps eliminate the false signals generated through the standard adaptive moving average. This is basically done by measuring the momentum of the move itself through the Jurik RSX. There are other tools in this study that should also help the trader avoid false signals which will be fully described below.
2. Implied Tops and Bottoms
The study also detects Implied Tops and Bottoms during market cycles using the Composite Momentum and Projections. It offers three detection modes:
• Strong Signals: Indicate significant potential reversal points.
• Medium Signals: Typically displayed near the end of a trend, suggesting traders should prepare to exit.
• Rolling Signals: Alert traders to set tight stop losses to secure profits, as the market may be approaching a turning point.
By default, the colors of Rolling Signals and Medium Signals are the same for simplicity.
Note the following:
• The fast and slow period have the most effect on implied tops and bottoms detection.
• Adjusting the main period will also have an overall effect.
The above chart shows rolling tops, rolling bottoms, strong tops, and strong bottoms. A rolling top of bottom indicate an increase in momentum in that direction and thus a tight stoploss would be recommended, while a strong top/bottom indicates that an exit is warranted.
3. Consolidation and Volatility
If enabled, '+' will appear above the ceiling and floor plots if consolidation is detected. Consolidation is detected by using lookback function that determine if price is below a threshold or not. If below, then consolidation would be confirmed. This is accomplished by adjusting the ' Price Consolidation Threshold ' period
The above chart demonstrates detection of consolidation on a 1-minute chart. Also, note the ceiling and floor plot, it expands when volatility is high.
Consolidation detection helps weed out long and short signals indicated by the main curve.
4. Directional Squeeze
Another unique feature of this indicator is the detection of directional price squeeze. Directional squeeze is defined as a price push in the direction indicated by momentum whether upward or downward. This is different from the common squeeze indicators found on the web since this one is detecting a directional push.
The Directional Squeeze feature, indicated by up and down triangles above the main curve, highlights strong trends in the market's current direction:
• Trend Continuation: Allows traders to stay in profitable trades longer during strong trending markets.
• Multiple Modes: Offers single-bar (short-term) and longer-term squeezes. Single-bar squeezes can signal potential market reversals, while longer-term squeezes are useful in sustained trends.
Be mindful that under certain conditions, the directional squeeze could be directionless(sideways) if consolidation is outlined by the indicator. This is another useful feature the trader could utilize. The chart above mostly demonstrates directional squeeze but directionless can also be observed.
5. Volume Volatility and Volume Climax Detection
An essential feature of the Adaptive Sharp Momentum Study is its ability to measure Volume Volatility and detect Volume Climax moments:
• Volume Volatility Measure: Integrated into the study to help avoid false signals by assessing the strength of market moves. It provides better clarity on trend direction by indicating when the market is experiencing significant volume changes.
• Volume Climax Alerts: The study alerts traders when a volume climax is likely reached during a move, which is helpful for identifying potential reversal points or the culmination of a trend. Brighter confirmation signal dots indicate these climaxes, helping traders make timely entry/exit decisions.
• Adjustable Parameters: Traders can set the Volume Volatility Threshold and adjust the Volume Lookback Period to tailor the sensitivity of volume climax detection according to their trading strategy.
5. The indicator contains other useful features:
• Cycles: Helps determine when to enter long or short trades based on upward or downward market cycles. It also aids in recognizing retracement levels during a trend, allowing traders to capitalize on brief counter-trend movements. Those cycles can be observed as the up and down gray lines on the chart.
• Real-Time Table: The table is another visual aid that summarizes the status of each feature in real-time.
█ How to Use this Study Effectively
The main curve in the middle is your final decision point. Prior to entering a trade look for the following:
• Is the market in consolidation? If yes, then you'd be advised not to enter the trade until the study clearly shows no consolidation
• Is the ceil or floor plots showing a strong top or bottom, or even a volume climax in the direction to intend to enter? If yes, then either ensure you enter at a tight stop or don't enter
• Is there an indication of a directional squeeze with no consolidation or volume climax? Then this would be an ideal place to enter. Be mindful though that entering directional squeeze too late is not recommended.
• Once you are in the trade, look at consolidation, implied tops and bottoms, and volume climax to determine exit point. You will quickly realize if you entered a trade prematurely.
• Utilize the directional squeeze and the prevalent trend to help you stay in the trade longer.
• Adjust your stop losses depending on whether you are seeing a rolling implied top/bottom or a strong top/bottom.
• Also, at volume climaxes, be ready to exit. The approach with volume climax detection should be the same as the implied tops/bottoms.
Below is a chart demonstrating trading on a 1-minute chart. The study could be used for any time frame:
** Important Note **
This study relies on volume readings. Incorrect evaluation will be concluded without proper volume data.
█ How the Adaptive Sharp Momentum Works?
---Main Curve - Jurik Moving Average and RSX---
The Jurik Moving Average (JMA) and the Jurik RSX with Fisher transform (Relative Strength Index Extended) are technical tools designed to enhance data processing efficiency. The JMA uses an adaptive smoothing algorithm to dynamically adjust to market conditions, reducing lag while maintaining high responsiveness to price changes. the JMA incorporates a mechanism that determines smoothness based on input volatility. The RSX, on the other hand, tracks relative strength without introducing the overshoots and noise commonly seen in other momentum indicators. It achieves this by applying a yet another JMA smoothing function that ensures stability and consistency, making it a better candidate for identifying shifts.
This is a unique approach, but can simply be equated to two moving averages crossing over, except in this case, the RSX is crossing over with the JMA.
The process of determining market trends and consolidation for the main curve revolves around evaluating multiple conditions and rankings of indicators such as Jurik RSX, Fisher Transform, and Volume-based metrics (Adaptive On Balance Volume and Price Volatility). Here's how consolidation and trends are identified:
1. Trend Override Logic: The core logic evaluates whether specific conditions override the default trend determined by the JMA.
• Bearish Overrides: A trend is classified as bearish if specific conditions involving negative slopes of the RSX, bearish Fisher Transform readings, and other auxiliary rankings (AOBV trend rank or volatility ranks) are met.
• Bullish Overrides: Similarly, bullish trends are determined by the presence of positive RSX slopes, bullish Fisher readings, and supporting AOBV and volatility ranks.
• Neutral Overrides: If neither bullish nor bearish overrides dominate, and conflicting conditions are detected (e.g., a bearish Fisher with a bullish OBV), the trend can be overridden to neutral.
2. Dynamic Slope and Rank Analysis: RSX and Jurik Slopes: The slopes of the RSX and Jurik indicators play an important role. Increasing slopes suggest bullish momentum, while decreasing slopes imply bearish momentum.
3. Narrow Spread Analysis: Consolidation zones are identified by examining conditions like narrow spreads in price action and mixed indicator signals (e.g., a positive RSX slope alongside a neutral or bearish AOBV).
• When consolidation is detected, the system looks for confirming signals (AOBV or Fisher alignment) to determine whether the next move is likely to be bullish or bearish.
4.Fallback Logic:
If no explicit conditions are met for bullish, bearish, or neutral trends, the system defaults to comparing the current and previous values of the Jurik Moving Average. If the JMA is rising, the trend is set to bullish; otherwise, it defaults to bearish.
The process of consolidating The RSX with JMA, attempts to confirm the trend suggested by the Jurik moving average. As shown above, several factors play into this, but it is mostly motivated by the RSX and its slope
-- Detecting Tops and Bottoms --
• Composite Momentum
The Composite Momentum indicator analyzes the market's directional strength to identify implied tops and bottoms, especially at extreme values. It evaluates momentum by categorizing it into ranges that reflect moderate or strong trends for both bullish and bearish conditions. When momentum exceeds a positive threshold, it indicates a strong top, whereas values below a negative threshold then it's a strong bottom.
• Laguerre Dynamic Projection Bands
The Laguerre Dynamic Projection Bands focuses on price positioning within calculated dynamic boundaries. By applying linear regression, it projects upper and lower price bands, which serve as potential resistance and support levels. The oscillator value ranges from 0 to 100, representing the relative position of the current price. A value above 70 indicates the price is near a projected top, while a value below 30 suggests proximity to a projected bottom. Through custom Laguerre smoothing, the setup ensures that its signals remain stable and actionable.
• How They Work Together
The Composite Momentum and Projection Oscillator complement each other in detecting market tops and bottoms. The Projection Oscillator provides an early indication when price nears a critical level, while the Composite Momentum confirms whether the momentum supports the formation of a significant top or bottom.
-- Consolidation Detection, Volatility, and Volume Climax Detection --
• Summary of Consolidation Detection:
Consolidation is identified through a combination of statistical and smoothing applied to price data. The approach calculates deviations around the main plot using squared price inputs, smoothed averages, and adaptive multipliers. These deviations form dynamic upper and lower boundaries that adapt to changing market conditions. The system further evaluates these boundaries against historical bars to calculate a volume percentage, which indicates how often recent price action remains within these bands. A low percentage suggests consolidation, characterized by reduced volatility and price movement confined within a tighter range.
The bands around the main plot are derived from the calculated maximum deviations, creating adaptive ceilings and floors that expand or contract based on market dynamics. The Ceiling and Floor plots represent the outermost boundaries, while additional retracement plots are drawn based on the Composite Momentum wave rank. For example, during an uptrend, the retrace levels adjust upward in fractional steps relative to the deviation, signaling possible resistance levels. In downtrends, similar logic applies in reverse to determine support levels. These bands visually represent the volatility envelope and help contextualize price movements relative to expected ranges. Whenever, low volatility is detected, a visual "+" indicator is added to the plot to highlight that the market is likely in consolidation mode.
• How the Adaptive OBV Applies the Same Logic:
The Adaptive On-Balance Volume (OBV) uses a similar mechanism to detect volume climaxes by analyzing deviations in volume data. Instead of price, the OBV logic applies the squared input and smoothing methods to volume flows. By comparing these deviations to historical norms, the system identifies periods of high or low volatility in volume, which often coincide with potential breakouts or consolidation zones.
• How They Work Together
The consolidation detection process and the adaptive bands work in tandem to provide traders with a clear visualization of market conditions. When consolidation is detected, the dynamic bands narrow and a "+" sign is visualized, signaling reduced volatility and potential breakout opportunities. Similarly, volume-based analysis through the adaptive OBV helps confirm whether a breakout is accompanied by significant volume, adding confidence to trade decisions. Together, they enable anticipation of market shifts.
-- Directional Squeeze --
A directional price squeeze refers to a market condition where price compresses in a particular direction. This provides traders with an opportunity to stay in trades longer by aligning with the prevailing directional bias. This unique concept generates dynamic limits based on lookback period. Their convergence upward or downward is typically a strong indication of a price push toward the respective direction.
In this approach, the system looks at the highest and lowest values of a smoothed momentum reading over a recent period and measures the distance between them. Instead of relying on a static “overbought” or “oversold” line, it calculates new boundaries as a fraction of that distance, scaling the thresholds to match the price behavior. When these dynamically adjusted limits converge, it suggests a “directional squeeze”—meaning price is moving within a more compressed or focused range. Because these boundaries adapt to the market’s own highs and lows, they provide a more responsive indication of when price may be shifting into or out of a strong directional move.
• Determining the Directional Squeeze
Directional squeeze is identified using dynamic limits derived from two key factors:
Schaff Trend Cycle (STC) for single-bar squeezes. and the Slow RSI (SRSI) for multi-bar or longer-term squeezes. Both are utilizing a custom alpha factor for adaptability and conformance with the JMA and Dynamic RSX studies.
• Directional Trend Confirmation:
If the SRSI or STC approaches the limits, additional conditions such as Fisher RSX (momentum signals) and AOBV (volume signals) and the trend already established by the JMA are aligned. If so, then a squeezed in that trend directional is established.
█ Why These Components All Work Together?
The Adaptive Sharp Momentum Study integrates multiple components to provide a framework for analyzing market dynamics. Each feature addresses specific challenges in trading:
• Core Trend Identification:
The Jurik Adaptive Moving Average (JMA) and Jurik RSX ensure better trend detection by reducing noise and dynamically confirming momentum, thus minimizing lag and false signals.
• Implied Tops and Bottoms:
The combination of Composite Momentum and Laguerre Dynamic Projection Bands highlights critical turning points. This dual-layered approach identifies potential reversals and key support/resistance levels with improved clarity.
• Consolidation and Volatility:
Adaptive ceilings, floors, and consolidation detection filter out indecisive market phases. This helps avoid unreliable signals and provides a better perspective on potential breakouts or continuations.
• Directional Squeeze:
The Directional Squeeze feature identifies directional bias in price compression. Its dynamic thresholds adapt to market conditions, aiding in the assessment of strong directional moves.
• Volume Climax:
Volume volatility and climax detection highlight key moments of market activity, aiding in the evaluation of trend strength and potential turning points.
• Integrated Framework:
The integration of these components creates a system where each element complements the others.
This study offers a methodical approach to analyzing trends, momentum, and volatility while filtering noise. It is a tool designed to assist traders in navigating complex market conditions.
█ Disclaimer
This script is provided for educational and informational purposes only and should not be considered financial advice. Trading financial instruments carries a high level of risk and may not be suitable for all investors. Before using this script, please consult with a qualified financial advisor to ensure it aligns with your individual circumstances. The author does not guarantee the accuracy or completeness of the script and is not responsible for any losses or damages that may occur from its use. Use this script at your own risk.
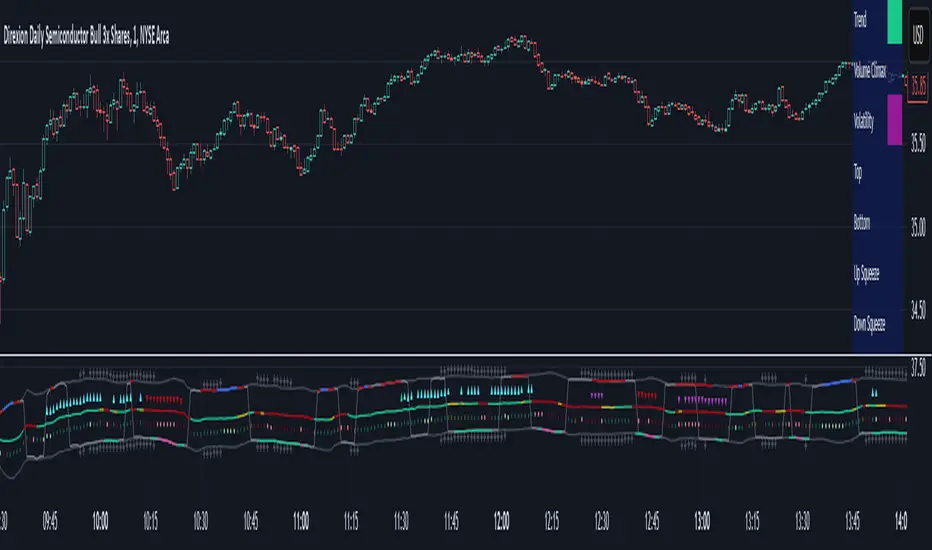
Adaptive On Balance Volume with Trend█ Introduction
The Adaptive On Balance Volume (AOBV) indicator enhances the traditional On Balance Volume (OBV) by introducing adaptability, volatility detection, and trend analysis. It helps traders identify the direction of volume flow, assess volume momentum, and spot potential reversals in the market.
Detecting market tops and bottoms is crucial for making informed trading decisions. The AOBV indicator offers a method for identifying these points by using an adaptive volatility detection function that highlights potential volume peaks or climaxes, suggesting when a price top or bottom may be forming.
█ Understanding the AOBV
Note: Details on how calculations are conducted can be found at the end of this script description.
1. The Basics of the AOBV Function:
• Adaptive Momentum Calculation: Instead of using a fixed momentum formula, the AOBV uses the original formula for basic momentum and enhances it based on relative strength and applies an adaptive smoothing function.
• Dynamic Smoothing:
• Strong Momentum: When the AOBV detects significant changes (strong momentum), it reduces smoothing. This makes the indicator more responsive to major market movements.
• Weak Momentum: When momentum is weak (small changes), it increases smoothing to filter out market noise.
This adaptability allows the AOBV to more accurately reflect volume momentum, responding promptly during significant market moves and remaining stable during quieter periods.
To determine the trend direction (bullish or bearish), the indicator calculates a signal curve and displays the difference as bars:
• Bar Above the Middle Line: Indicates a bullish trend.
• Bar Below the Middle Line: Indicates a bearish trend.
2. Volatility Function:
The volatility function measures how much the AOBV deviates from its average by comparing it to its smoothed version. It calculates the exponential standard deviation to estimate volatility.
• Purpose: Identifies when volume momentum is near a climax or when a trend is nearing exhaustion.
• How It Works:
• Compares current volatility to previous bars.
• Computes a percentage indicating how often the current volatility is higher than past values.
• If this percentage exceeds a defined threshold, it signals a significant volatility event by plotting a dot above or below the bar.
This pattern typically manifests itself during strong runs on price followed by a period of consolidation. Thus, estimating volatility would be an acceptable measure of when a market is reaching or nearing an implied top or bottom.
3. The Trend Function:
The trend function combines several common indicators to gauge buildup toward a reversal or a continuation of a trend when the AOBV changes direction.
• Components:
• AOBV Strength Percentage: Calculates the percentage change in the AOBV to gauge its strength and direction.
• Supertrend Indicator: Acts as the main driver for trend buildup.
• Vertical Horizontal Filter (VHF): Measures market consolidation, adjusting the trend strength accordingly.
• Adaptive RSI: Further refines the trend strength based on volume momentum.
• Trend Ranking:
• Assigns a trend rank to the AOBV that reflects both market direction and momentum.
• Colors are used to represent different trend strengths: Strong Bullish, Bullish, Strong Bearish, and Bearish.
█ How to Use the AOBV
• Above the Middle Line: Suggests a bullish trend.
• Below the Middle Line: Suggests a bearish trend
• The Volatility dots:
• Indicate strong momentum relative to previous bars.
• Signal that the trend may be nearing a climax or exhaustion.
• Can imply a potential market top or bottom.
• Consolidation can be detected by visually comparing current bars to previous ones. This should be obvious since, and as described, the AOBV bars represent volume momentum.
• The trend function is used to gauge the likelihood of a reversal or a continuation of a trend; trend is represented with several colors: strong bullish trend, bullish trend, strong bearish trend, and finally simply a bearish trend.
It is important to understand that this trend function is not the typical trend function found on other technical indicators. It must be viewed within the context of the AOBV momentum. For example, if AOBV is exerting a bullish trend (bars above middle line), then a bearish trend with no major change in momentum and no volatility indication could mean a false reversal. Conversely, a large charge in AOBV could be a strong indication of a market reversal.
█ Key Features
• Two Display Modes: Curve and Bars:
The Adaptive OBV can be viewed in two different display modes: Curve and Bars Mode. "Curve Mode" offers the classic OBV representation (but as AOBV) with trend, while "Bars Mode" incorporates volatility detection and trend, making it the recommended mode.
• Volatility Function:
• Dots appear above or below the volume bars when significant volatility events are detected.
• The sensitivity can be adjusted by changing the percentage threshold.
• Trend Analysis:
• Helps gauge the likelihood of a trend continuation or reversal.
• Uses color-coded trend ranks for easy interpretation.
• Flexible Lookback Period:
Lookback periods for the main AOBV, its signal line, trend function, and volatility function can be customized.
• Recommendations:
• Match the main lookback period with the volatility period: Ensures consistency in momentum and volatility measurements.
• Match the trend lookback period with the signal AOBV lookback period: Aligns trend analysis with the underlying momentum signals.
Below is a sample demonstrating the utility on a 1- minute chart.
█ Calculation Details:
• AOBV Calculations
The AOBV differs the traditional OBV by focusing on the differences in OBV values rather than absolute price movements. Initially, it calculates the standard OBV by accumulating volume based on whether the closing price is higher or lower than the previous close. Next, it computes the difference between the current OBV and the previous OBV to measure changes in volume momentum. It calculates the average net change and average total change of these OBV differences over a specified period using a selected averaging method (e.g., EMA, SMA). By dividing the average net change by the average total change, it obtains a change ratio that reflects the strength and direction of volume momentum.
This change ratio is then scaled to an RSI-like value between 0 and 100, which is used to derive an adaptive smoothing factor (alpha). The alpha adjusts dynamically—when the change ratio indicates strong momentum, alpha increases, making the indicator more responsive to recent changes; when momentum is weak, alpha decreases, increasing smoothing to filter out noise.
The adaptive OBV is calculated by applying this alpha to combine the current OBV and the previous adaptive OBV value. This adaptive smoothing allows the indicator to adjust its sensitivity based on market conditions, becoming more responsive during strong momentum and more stable during weak momentum.
A smoothed OBV signal line is also computed using weighted moving averages for comparison. By analyzing the difference between the adaptive OBV and this smoothed signal line, the indicator identifies bullish or bearish trends. Positive differences suggest bullish momentum (bars above the middle line), while negative differences indicate bearish momentum (bars below the middle line).
• Volatility Calculations
The volatility function in the AOBV indicator identifies significant changes in volume momentum by estimating the variability of recent momentum shifts. It begins by calculating the difference between the AOBV and its smoothed signal line, capturing the current change in volume momentum. To assess volatility, the function employs exponential smoothing to compute adaptive averages of both the volume and the squared volume over a specified lookback period. By combining these averages, it estimates the current standard deviation of the volume momentum changes, effectively measuring how much the momentum deviates from its average level.
This estimated volatility is then compared to historical volatility values over the lookback period to determine how frequently the current volatility exceeds past levels. If the proportion of times the current volatility is higher than previous values and it surpasses a user-defined threshold, it signals a significant volatility event, indicating a potential volume climax
• Trend Calculations
As outlined earlier in description, the trend function is composed of several components:
The Supertrend indicator calculates dynamic support and resistance levels based on price movements and volatility using the Average True Range. It assesses whether the closing price is above or below these levels to determine the primary trend direction. If the price is above the Supertrend line: The market is considered to be in an uptrend. If the price is below the Supertrend line: The market is considered to be in a downtrend.
The Vertical Horizontal Filter measures the strength of the trend by comparing the price range over a period to the sum of absolute price changes. It does this by comparing the difference between the highest and lowest prices over a given period (the "vertical" movement) to the sum of the absolute differences between consecutive prices (the "horizontal" movement). A higher VHF value indicates a stronger, more directional trend, while a lower value suggests that the market is moving sideways without a clear trend.. If the VHF detects consolidation, it downgrades the trend strength indicated by the Supertrend. This prevents the trend function from overemphasizing the Supertrend's signals when the market lacks clear direction.
The Adaptive RSI Analyzes recent changes in the AOBV to identify whether volume momentum is strengthening or weakening (based on the volume percent change) correlating price movement with volume momentum. It only upgrades or downgrades on a bar by bar basis if price movement is correlating with percent change. This acts as a corrective measure against the VHF since quiet periods (consolidation) can occur between strong moves. The alpha generated from the adaptive function is the same as the one generated with the AOBV calculations.
█ Disclaimer
This script is provided for educational and informational purposes only and should not be considered financial advice. Trading financial instruments carries a high level of risk and may not be suitable for all investors. Before using this script, please consult with a qualified financial advisor to ensure it aligns with your individual circumstances. The author does not guarantee the accuracy or completeness of the script and is not responsible for any losses or damages that may occur from its use. Use this script at your own risk.
