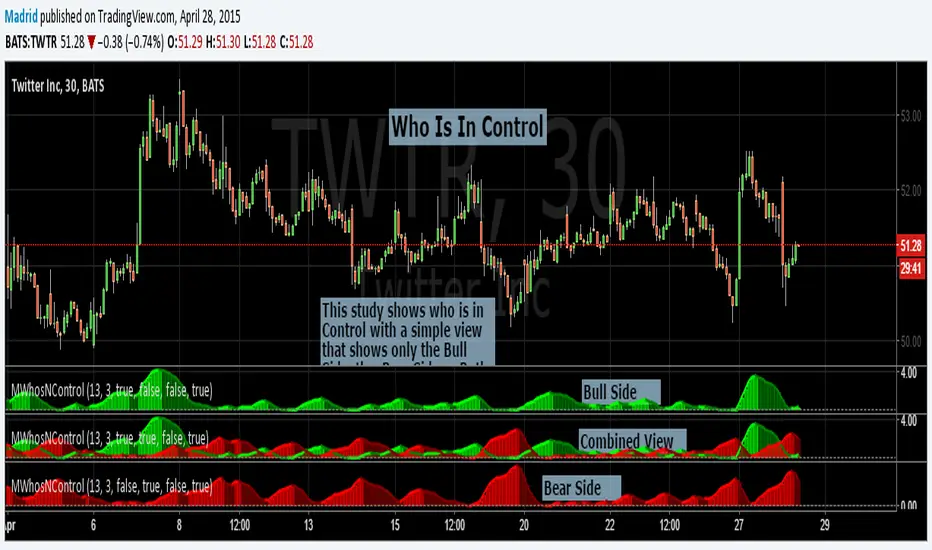
MWho is in ControlWho is in Control.
This study shows who is in control by showing just the Bull side, the Bear side or a combined view. This study follows the same philosophy of simplicity I try to use as much as possible in my studies. The least number of parameters and as understandable as possible.
Len : length of the period
Signal : Signal to show change of trend
Disp Bull : Display/Hide Bull Side
Disp Bear : Display/Hide Bear Side
Disp Differential : Display/Hide the differential between Bulls and Bears.
Search in scripts for "bear"
: Volume Zone Oscillator & Price Zone Oscillator LB Update JRMThis is a simple update of Lazy Bear's " Indicators: Volume Zone Indicator & Price Zone Indicator" Script. PZO plots on the same indicator. The horizontal plot lines are taken primarily from two articles by Wahalil and Steckler "In The Volume Zone" May 2011, Stocks and Commodities and "Entering The Price Zone"June 2011, Stocks and Commodities. With both indicators on the same plot it is easier to see divergences between the indicators. I did add a plot line at 80 and -80 as well because that is getting into truly extreme price/volume territory where one might contemplate a close your eyes and sell or cover particularly if confirmed at a higher time frame with the expectation of some type of corrective move..
The inputs and plot lines can be edited as per Lazy Bear's original script and follows the original format. Many thanks to Lazy Bear.

ATO - Adaptive trend OscillatorATO/MCL Color Coding — Deep Dive User Guide (Confidential Components Obfuscated)
Purpose: A practical, scenario‑driven manual that teaches users exactly what each color, line, and crossing signifies, and how to act on them—without revealing underlying indicator components. This expands on the basics in Color‑Code‑Guide.md and mirrors the behavior spec in Color‑Code.md.
Audience: Traders of all experience levels. Keep this open beside your charts.
---
Quick Settings Reference (names and how to use them)
Signal Candle Settings
- Signal Core Sensitivity
- Purpose: Controls how reactive the internal signal candle is.
- Increase/Decrease: Higher = smoother/slower; lower = faster/more responsive.
- Trading: Higher reduces noise but can lag; lower catches early shifts but may whipsaw.
- Open Blend Smoothing
- Purpose: Blends the candle’s open values to reduce jitter.
- Increase/Decrease: Higher = fewer false flips; lower = sharper turns/more detail.
- Trading: Higher favors stability; lower highlights micro‑structure.
Multi‑Core Blending
- Enable Multi‑Core Blending
- Purpose: Combines multiple signal horizons for robustness.
- Increase/Decrease: Toggle On for smoother behavior across regimes; Off for single‑core speed.
- Trading: On favors consistency; Off emphasizes reactivity.
- Core A/B/C Horizon
- Purpose: Control fast/balanced/deep horizons in the blend.
- Increase/Decrease: Higher = smoother; lower = quicker reactions.
- Trading: Tune per timeframe; mix for balance of timeliness vs stability.
Adaptive Action Bands
- Enable Adaptive Action Bands
- Purpose: Dynamic upper/lower decision bands that adapt to environment.
- Trading: On = bands scale to volatility; Off = fixed levels.
- Upper Band Base / Lower Band Base
- Purpose: Baselines for upper/lower bands.
- Increase/Decrease: Higher demands stronger moves to tag; lower increases sensitivity.
- Trading: Higher filters shallow extremes; lower surfaces more signals.
- Regime Reactivity
- Purpose: How strongly bands react to volatility changes.
- Increase/Decrease: Higher = faster expansion/contraction; lower = steadier bands.
- Trading: Higher tracks fast markets; lower avoids overreacting.
- Distribution Window
- Purpose: Anchor bands to recent behavior.
- Increase/Decrease: Larger = slower, stable anchors; smaller = faster, adaptive anchors.
- Trading: Larger for swing; smaller for scalps.
- Upper/Lower Anchor Level
- Purpose: Position of the upper/lower anchor within recent behavior.
- Increase/Decrease: Higher pushes bands farther; lower tightens thresholds.
- Trading: Higher reduces frequent signals; lower increases sensitivity.
- Trend Bias Strength / Bias Memory Window
- Purpose: Asymmetric tilt and how quickly tilt adapts.
- Increase/Decrease: Strength higher tilts more; memory longer adapts slower.
- Trading: Higher favors continuation; longer stabilizes bias; shorter captures quick rotations.
- Confidence Tightening / Compression Reactivity
- Purpose: Narrow bands when signals are confident or during compression.
- Increase/Decrease: Higher tightens more; lower stays neutral.
- Trading: Higher highlights strong trends or pre‑breakout states; lower reduces false narrowing.
Stability Engine
- Show Confidence Layers
- Purpose: Displays layered stability envelopes around the core signal.
- Trading: Visualizes reliability and risk zones.
- Enable Stability Smoothing
- Purpose: Adaptive smoothing to reduce noise while preserving structure.
- Increase/Decrease: On = cleaner lines; Off = raw movement.
- Trading: On clarifies context; Off emphasizes immediacy.
- Model Flexibility
- Purpose: How freely the model adjusts to new information.
- Increase/Decrease: Higher = faster adaptation; lower = steadier behavior.
- Trading: Higher tracks regime shifts; lower avoids overfitting.
- Signal Trust Level
- Purpose: How much the engine trusts the raw signal.
- Increase/Decrease: Higher = rely less on noisy ticks; lower = follow raw moves more closely.
- Trading: Higher smooths choppiness; lower emphasizes immediacy.
- Base Layer Width
- Purpose: Baseline width of stability layers around the core.
- Increase/Decrease: Higher = broader cushions; lower = tighter envelopes.
- Trading: Broader layers indicate wider risk tolerance.
Trend Memory
- Enable Trend Memory
- Purpose: Activates a persistence layer that rewards continuous directional flow.
- Trading: Helps distinguish noise from sustained motion.
- Memory Fade Speed
- Purpose: How quickly prior movement influence fades.
- Increase/Decrease: Higher = faster forgetting; lower = retain past momentum longer.
- Trading: Tune to market tempo.
- Consistency Requirement
- Purpose: Bars in the same direction needed to reach full consistency.
- Increase/Decrease: Higher = demand stronger sequences; lower = recognize shorter bursts.
Core Line & Envelope
- Core Line Source
- Purpose: Base price source the core line derives from.
- Increase/Decrease: Use blended sources (OHLC4) for stability; Close for immediacy.
- Trading: Stability vs responsiveness trade‑off.
- Smooth Core Line / Core Line Smoothing Window
- Purpose: Reduce jitter while preserving structure.
- Increase/Decrease: Longer window = smoother but slower; shorter = sharper detail.
- Trading: Longer lags reactive moves; shorter captures micro‑shifts.
- Envelope Base Window
- Purpose: Base window to build the dynamic envelope around the core line.
- Increase/Decrease: Higher = broader, slower envelopes; lower = tighter, faster envelopes.
- Trading: Wider envelopes reduce frequent touches; tighter envelopes surface more interactions.
- Envelope Expansion Factor
- Purpose: Controls how wide the envelope expands from its midline.
- Increase/Decrease: Higher = wider bands/fewer touches; lower = tighter/more interactions.
- Trading: Wider for trend; tighter for precision reversion.
- Envelope Midline Type
- Purpose: Midline calculation style for the envelope.
- Trading: Choose smoother types for stability or faster types for responsiveness.
Visual & Display Settings
- Show Core Line / Show Envelope Fill / Show Adaptive Zones / Visual Theme
- Purpose: Control visibility and theme.
- Trading: Adjust to environment; keep colors consistent for fast reading.
---
Foundations: Components and their color meanings
- Signal Candles (internal)
- bull_strong (green family): Bullish body above zero ⇒ trend‑friendly context
- bull_weak (tinted green): Bullish body below zero ⇒ bullish impulse but weaker context
- bear_strong (red family): Bearish body below zero ⇒ trend‑friendly bearish context
- bear_weak (tinted red): Bearish body above zero ⇒ bearish impulse but weaker context
- Opacity = confidence tier:
- <40 → 70% transp (faint), 40–64 → 40%, 65–84 → 20%, ≥85 → 10% (bold)
- Core Line
- core_bull when rising this bar; core_bear when falling this bar
- Opacity tightens as confidence rises; soft shadow adds depth
- Dynamic Envelope (around Core Line)
- Basis color: primary (rising) vs secondary (falling)
- Fills: yellow (compression), green (diverging/expanding), red (converging/contracting), subtle primary otherwise
- Adaptive Action Bands (upper/lower)
- Dynamic guardrails based on distribution anchors, trend bias, confidence, and compression
- Stability Layers
- Gradient from low→high confidence around the line; width reflects uncertainty
---
Guided reading: A step‑by‑step method
1) Identify regime via envelope fill:
- Yellow compression ⇒ energy build; prepare for breakout
- Green diverging ⇒ expansion/trend continuation risk
- Red converging ⇒ consolidation/mean‑reversion bias
2) Check line vs basis:
- Cross up (basis rising) = early bullish impulse; cross down (basis falling) = early bearish impulse
3) Read candle state and opacity:
- Prefer signals where hue (bull/bear) and context (above/below zero) agree with basis slope + higher opacity (confidence)
4) Use Adaptive Action Band interactions to decide trend vs mean‑reversion tactics
---
Pattern library — high‑probability scenarios
A) Compression Breakout (Trend Birth)
- Visuals: Yellow fill, line crosses above basis; candles shift bull_weak → bull_strong; opacity improves
- Interpretation: Pressure release; early trend formation
- Playbook: Breakout entries; trail using basis or prior swing; avoid fading extremes initially
B) Trend Continuation (Expansion)
- Visuals: Green fill (diverging), basis colored primary (rising), line holds above basis; candles persist bull_strong with low transp
- Interpretation: Momentum alignment across components
- Playbook: Buy pullbacks to basis/inner stability layer; scale out near Adaptive Action Band re‑tests
C) Mean‑Reversion Window (Re‑entry)
- Visuals: Line breaches upper/lower band then re‑enters while fill turns red (converging); candle opacity loosens
- Interpretation: Expansion cooling; revert‑to‑mean opportunity
- Playbook: Fade back toward basis/center; tighten risk if green fill returns
D) Failed Breakout (Fade Trap)
- Visuals: Line wicks beyond bands without support from basis slope (basis stays secondary), candles flip color quickly with low confidence
- Interpretation: Breakout lacked breadth
- Playbook: Fade the failure back toward basis; confirm with red fill or weak opacity
E) Zero‑Line Upgrade/Downgrade
- Visuals: Candle crosses zero (weak→strong or strong→weak of opposite side)
- Interpretation: Context upgrade/downgrade of the same direction
- Playbook: Join only when basis slope agrees; skip if basis contradicts and fill is red
F) Chop Filter (Avoid Zone)
- Visuals: Frequent line‑basis crossovers, alternating candle hues, red fill dominance, low confidence (high transparency)
- Interpretation: No edge; whipsaw risk
- Playbook: Stand aside or reduce size; wait for compression or alignment
---
Crossings — what they mean and how to analyze them
- Line × Basis
- Cross up with rising basis (primary) ⇒ constructive momentum shift
- Cross down with falling basis (secondary) ⇒ deteriorating momentum
- Repeated crosses with red fill ⇒ chop
- Line × Upper/Lower Action Bands
- Touch/near upper during green fill ⇒ healthy expansion; continuation bias
- Touch/near lower during green fill ⇒ downside expansion; continuation bias
- Touch during yellow ⇒ breakout watch
- Line × Adaptive Action Bands
- Breach outside with green fill ⇒ trend regime; don’t fade blindly
- Re‑enter with red fill ⇒ mean‑reversion opportunity
- Candle × Zero Line
- Upgrade to bull_strong above zero or bear_strong below zero strengthens signal context
Reading tips:
- Always cross‑check: crossing → basis slope → fill color → candle hue/opacity
- More components in agreement = higher conviction
---
Behavior correlations (what moves cause what visuals)
- Confidence ↑ ⇒ Candle/body opacity ↓ (more visible), core line opacity ↓; often coincides with alignment (line above a rising basis or below a falling basis)
- Basis slope change ⇒ Basis color flips (primary/secondary) and often precedes candle context upgrades/downgrades
- Fill transitions:
- Yellow → Green ⇒ breakout → expansion
- Green → Red ⇒ expansion cooling → consolidation
- Action Band interactions:
- Persistent stay outside with green fill ⇒ trend maturity; use pullback entries
- Quick pop‑and‑back with red fill ⇒ mean reversion favored
---
Tuning and customization
- Confidence tiers (40/65/85): Keep structure; you may shift thresholds slightly but preserve four‑step progression
- Line visibility: Raise/lower minimum opacity cautiously (default 10%) for background contrast
- Envelope fills: If visually heavy, increase transparency but keep event→color mapping (yellow compression, green diverge, red converge)
- Themes: Choose by environment (Light/Dark/Dusk/Night). For accessibility, convert bull/bear to blue/orange while keeping the same logic
- Action Bands: Adjust colors to match your theme but keep the adaptive engine intact
---
Troubleshooting interpretation
- “Two panes don’t match” → Ensure identical theme struct, opacity tiers, wick/border rules, and basis slope logic
- “Too many false signals” → Demand confluence: rising basis + line above + bull_strong candles + green fill
- “I can’t see the details” → Lower transparencies (more opaque) or switch theme; verify display toggles
- “Bands cross” → Rare in extremes; prioritize fill regime + basis slope + candle opacity for decisions
- “Whipsaw hell” → If red fill dominates and crosses pile up, stand aside until compression or clear alignment appears
---
Practical playbooks (ready‑to‑use)
- Breakout Playbook
- Preconditions: Yellow compression → cross up; basis turns/stays primary; candles upgrade toward bull_strong; confidence rising
- Entry: Break of recent line swing high
- Risk: Stop below basis/last swing; trail with basis or inner layer
- Exit: Partial into Action Band retests; exit on red fill return + basis roll‑over
- Pullback Continuation
- Preconditions: Green fill; line above rising basis; bull_strong candles
- Entry: Pullback to basis/inner layer
- Risk/Exit: Stop under basis; scale out into prior high or band re‑touch; exit on basis slope flip
- Mean‑Reversion Fade
- Preconditions: Line re‑enters from bands while fill turns red and candles lose opacity
- Entry: Toward basis/center; conservative size in strong trends
- Exit: At basis or when green fill resumes
---
Implementation parity across panes
- Port the same Theme struct and theme selector
- Reuse candle hue matrix (bull/bear × above/below zero) and confidence tiers
- Implement basis slope → primary/secondary mapping and fill regime logic
- Keep wick = body color; border = same hue, 0% transparency
- Validate with side‑by‑side charts for identical inputs and market
Keep this deep dive as your operational manual; it explains what you see and how to act. Once internalized, it will accelerate confluence recognition and decision‑making under live conditions.
Adaptive Action Bands — Calculation, Behavior, and Crossings
This section explains exactly how the Adaptive Action Bands are computed and how to interpret their movements and rare crossings.
A) What they represent
- Dynamic guardrails around the core line, adapting to recent distribution anchors, current trend bias, confidence, and compression state.
- Purpose: separate trend vs mean‑reversion regimes and scale thresholds to volatility and context.
B) The calculation (plain‑English and formulas)
1) Distribution anchors
- upper_baseline = Percentile(core_line, lookback = Distribution Window, p = Upper Anchor Level)
- lower_baseline = Percentile(core_line, lookback = Distribution Window, p = Lower Anchor Level)
- center = (upper_baseline + lower_baseline) / 2
- range = |upper_baseline − lower_baseline|; halfband = range / 2
2) Confidence tightening (narrow when signals are confident)
- stdev_core = StdDev(core_line, 50)
- tighten_adjust = stdev_core × Confidence Tightening × (signal_confidence / 100)
3) Compression adjustment (narrow more during quiet states)
- envelope_width_avg = SMA(envelope_width, 50); compression = max(0, 1 − envelope_width / max(envelope_width_avg, 0.0001))
- compression_adjust = stdev_core × Compression Reactivity × compression × Regime Reactivity
4) Trend bias (asymmetric push by prevailing trend)
- bias_ema = EMA(core_line, Bias Memory Window)
- bias = tanh(bias_ema / 100); bias_shift = bias × Trend Bias Strength
5) Effective distance and candidate levels
- distance = max(5.0, halfband − tighten_adjust − compression_adjust) // minimum gap guard
- upper_candidate = center + distance + bias_shift × halfband
- lower_candidate = center − distance − bias_shift × halfband
6) Final clamp and enable
- upper_action = clamp(upper_candidate, −100, 100)
- lower_action = clamp(lower_candidate, −100, 100)
- If adaptive disabled, use fixed base levels instead.
C) Why the bands sometimes CROSS (and what it means)
- Effective spread between bands = (upper − lower) = 2 × distance + 2 × bias_shift × halfband.
- If strong negative bias (bias_shift ≪ 0) and large halfband combine with tightening (small distance), the spread can compress and flip sign (rare), causing temporary inversion.
- Interpretation: “Dominant trend override.” The engine signals an extreme asymmetric regime where trend force overwhelms symmetric mean‑reversion guardrails.
- Practical takeaway: Treat it as a trend regime warning. Do not fade blindly; prefer continuation tactics or wait for re‑normalization.
D) Reading the patterns around Action Bands
- Approach without breach: Build‑up toward a boundary; look for fill color (green diverging supports continuation, red converging favors mean‑revert).
- Breach outside + green fill: Strong trend state; continuation entries on pullbacks are favored; mean‑reversion is lower probability.
- Re‑entry from outside + red fill: Expansion cooling; mean‑reversion window opens; look for moves back toward center/basis.
- Temporary inversion (crossing): Extreme bias; treat as trend override; either wait for bands to normalize or align trades with trend only.
E) Tuning knobs and how they affect behavior
- Trend Bias Strength (default 1.5):
- Higher = more asymmetric push; increases inversion risk in extremes
- Lower = more symmetric bands; reduces inversion likelihood
- Confidence Tightening (default 0.8):
- Higher = narrows thresholds with confidence; can reduce distance and contribute to inversions in strong bias
- Lower = more stable distances; fewer near‑collapses
- Compression Reactivity (default 0.8) and Regime Reactivity (default 2.0):
- Higher = stronger compression during quiet states; can make distance small
- Lower = gentler compression; more robust separation
- Distribution Window (default 15), Upper Anchor Level (85), Lower Anchor Level (15):
- Longer window = slower moving baselines; can soften extreme bias effects
- Wider anchor spread (e.g., 90/10) increases halfband; may widen bands but also amplifies bias term; balance with Trend Bias Strength
F) Optional guards to prevent inversions
- Cap bias impact: bias_shift = clamp(bias × Trend Bias Strength, −S, S) with S ∈
- Enforce non‑cross gap: if (upper_candidate ≤ lower_candidate) then set
- gap = max(min_gap, lower_candidate − upper_candidate)
- distance := distance + (min_gap − gap/2)
- Or simply recompute upper/lower using distance := max(distance, min_gap)
- Minimum gap suggestion: min_gap ∈ depending on timeframe/noise.
G) Scenario examples (what to do)
1) Expansion trend day: green fill, basis rising, line above basis; bands widen and tilt upward; candles mostly bull_strong with low transparency
- Action: Buy pullbacks toward basis/inner layer; avoid countertrend fades; scale out into band re‑touches
2) Post‑compression breakout: yellow → green, line clears basis, bands tilt and widen; a brief inversion may appear during explosive move
- Action: Align with trend; wait for normalization before adding mean‑reversion plays
3) Range reversion afternoon: red fill, line oscillates about center; bands normalize and narrow
- Action: Fade edges back to center; reduce size if green fill returns
H) Troubleshooting band behavior
- “Bands cross often” → Reduce Trend Bias Strength; lower Confidence Tightening and/or Compression Reactivity; add a min_gap
- “Bands too tight” → Lower Confidence Tightening; reduce Regime Reactivity; lengthen Distribution Window
- “Bands too wide” → Increase Confidence Tightening slightly; narrow anchor spread (e.g., 80/20)
- “Bands feel laggy” → Shorten Distribution Window moderately; beware of over‑reactivity
Use these principles to keep Action Bands informative without visual confusion.

AekFreedom PriceActionKillerAekFreedom PriceActionKiller is an indicator designed to highlight and recolor candlesticks that form key Price Action patterns such as Engulfing and Outside Bars. It also includes a built-in alert system so you never miss important signals.
🔍 Detected Candlestick Patterns
Bullish Engulfing
Current candle closes bullish (green) and engulfs the previous bearish candle.
Highlighted in Blue.
Bearish Engulfing
Current candle closes bearish (red) and engulfs the previous bullish candle.
Highlighted in Purple.
Bullish Outside Bar
Previous candle is bullish, current candle is also bullish.
Current candle’s High > previous High and Low < previous Low.
Highlighted in Blue.
Bearish Outside Bar
Previous candle is bearish, current candle is also bearish.
Current candle’s High > previous High and Low < previous Low.
Highlighted in Orange.
🎨 Candle Coloring Logic
If a candle matches one of the above patterns, it will be recolored accordingly.
If no special pattern is detected, candles are displayed with default colors:
Bullish candle = Teal
Bearish candle = Red
⏰ Alerts System
The script supports Alert Conditions for the following:
🔵 Bullish Engulfing
🟣 Bearish Engulfing
🔷 Bullish Outside Bar
🟠 Bearish Outside Bar
⚡ Alerts are triggered once per bar close when conditions are met.
✅ How to Use
Add this indicator to your chart (Overlay = True).
Create alerts based on the patterns you want to track.
Use in combination with other tools (support/resistance, trendlines, or other indicators) for better confirmation.
📌 Note: This indicator highlights Price Action signals only. It is not a standalone Buy/Sell system. Always combine with proper market analysis and risk management.

Multiple Moving Averages [JopAlgo]Multiple Moving Averages — read trend, timing, and strength at a glance
What it does:
Mark up to 5 moving averages (you pick type + length + color). Watch how they stack, slope, braid, and fan out to judge trend direction, pullback timing, and breakout quality on any timeframe.
Read it in 5 seconds
Stack order:
Bullish: fast MAs on top of slow MAs.
Bearish: fast MAs below slow MAs.
Slope: up = trend has a tailwind; down = headwind.
Spacing: wide = strong trend; tight/braided = balance/chop.
If you remember only one rule: trade with the stack and slope, enter at levels.
High-probability plays (simple and repeatable)
Trend pullback (with level)
Stack is bullish, slopes up.
Price pulls back to the MA cluster (or AVWAP/VAL), holds, fast MAs curl back up.
Long. Stop: below structure/slowest MA. Target: POC/HVNs or next swing.
(Mirror for shorts in a bearish stack.)
Reclaim + recurl
After a down phase, price closes above fast MAs (MA1–MA2), they turn up, and you’re at a real level (AVWAP/VA edge).
Take the first higher-low with the stack starting to flip.
Squeeze → expansion
MAs braid tight = energy building.
Break at a level, then the lines fan out in your direction.
Enter on the first retest that holds.
Skip trades when the lines are braided mid-range and you’re not at a level.
Timeframe guide (what usually works)
1–5m (scalps): EMA heavy (e.g., 5/9/21/34/55). Expect more signals; filter with levels + CVD.
15m–1H (intraday): 9/21/34/50/200 (mix EMA for fast, SMA for slow).
2H–4H (swing): 10/20/50/100/200 or 8/21/34/55/89 (smoother read).
1D+ (position): 20/50/100/200 (bias) and enter on lower TF.
Tip: Don’t set all five to the same length—stagger them so the stack tells a story.
Settings that matter (and what they mean)
MA types (pick the feel you like):
EMA – fastest response (great for timing).
SMA – smoother backbone (great for bias).
WMA / LWMA – responsive but less twitchy than EMA.
VWMA – weights price by volume (good on assets with uneven volume).
SMMA – very smooth (reduces whips).
DEMA – extra fast (can be noisy).
HEMA – in this script behaves like a double-EMA style response (fast).
RVIMA – not implemented here (will plot nothing if chosen).
Length:
Shorter = earlier turns, more noise.
Longer = slower, cleaner bias.
Keep a sensible spread (e.g., 1:2:3… or Fib-style 9/21/34/55/89).
Colors:
Use consistent colors (e.g., warm = fast, cool = slow) so you can read the stack instantly.
Best combos with other tools
Volume Profile v3.2: take signals at VAH/VAL/LVNs; use POC/HVNs for targets.
Anchored VWAP: reclaims/rejections + MA recurl = clean timing.
CVDv1: execute with flow (Alignment OK, strong Imbalance, no Absorption against you).
Common mistakes this prevents
Shorting into a bullish stack (or buying into a bearish one).
Chasing far from the fast MAs; better to wait for a pullback.
Trading every wiggle in chop—braids tell you to do less.
Quick FAQs
Cluttered chart? Hide 1–2 lines (keep fast, middle, slow) or thin the linewidth.
Which one is “right”? None. Pick a set that fits your tempo and stick to it.
RVIMA option? Not implemented in this version—choose another type.
Starter presets (copy these, then adjust)
Intraday: MA1 EMA9, MA2 EMA21, MA3 SMA34, MA4 SMA50, MA5 SMA200
Swing: MA1 EMA10, MA2 SMA20, MA3 SMA50, MA4 SMA100, MA5 SMA200
Scalp: MA1 EMA5, MA2 EMA9, MA3 EMA21, MA4 EMA34, MA5 EMA55
Mini-disclaimer
Educational tool, not financial advice. Always anchor trades to levels, flow, and risk—this indicator keeps your bias and timing honest; the plan is still yours.

Market Bias (CEREBR)Market Bias (CEREBR) — quick read of who’s in control
What it does, in one line:
It builds a clean, smoothed Heikin-Ashi view (optionally from a higher timeframe) and an oscillator that says: bullish, bearish, or cooling off. You use it to decide directional bias and to avoid trading against that bias.
What you see on the chart
Smoothed HA candles (optional): green = bullish bias, red = bearish bias.
A soft fill band around the HA body:
Brighter = bias is strengthening.
Faded = bias is weakening.
(In Data Window) “Bias High / Low / Average” = the smoothed HA range and midline.
If you only look at one thing: green means look for longs, red means look for shorts. Faded color = be picky or trim.
How to use it (simple playbook)
Pick your higher timeframe (HTF) for the bias.
On a 4H chart, try HTF = 12H or 1D.
Rule: HTF must be equal to or higher than your chart TF.
Trade with the bias at real levels.
Longs only when the bias is green.
Shorts only when the bias is red.
Take entries at location: Volume Profile v3.2 levels (VAH/VAL/POC/LVNs) or Anchored VWAP.
Quality check (optional but strong):
Before clicking, glance at CVDv1.
Green bias + CVD Alignment OK and no Absorption = better odds.
If CVD shows Absorption against you, skip or wait for a retest.
When to pass:
Color flips every other bar (chop) → do less.
Color is fading (weakening) into your entry → size down or wait.
Timeframe guidance
Scalps (1–5m): HTF = 15m/30m. Use bias to filter direction; enter on pullbacks at AVWAP/VA edges.
Intraday (15m–1H): HTF = 4H. Buy dips in green / sell pops in red at VP levels.
Swing (2H–4H): HTF = 12H/1D. First pullback after a fresh flip is usually the best.
Position (1D–1W): HTF = 1W. Hold while color stays consistent; reduce on weakening near HVNs.
Entries, exits, and stops
Entry with trend:
Bias green, price pulls back to AVWAP / VAL / prior HA mid, then holds.
Click the long. Reverse for shorts in red.
Exit / reduce:
When “Trend Weakens” alert fires, or color fades while hitting your POC/HVN target.
Hard exit on opposite flip (green→red or red→green) if your idea was pure trend-follow.
Stops:
Behind structure/level (not just on color).
If the next bar flips bias against you and CVD also disagrees, cut it early.
Inputs that matter (keep these simple)
Timeframe (HA Market Bias): your HTF. Must be ≥ chart TF.
Period (default 100): smoothing for the base OHLC. Higher = steadier.
Smoothing (default 100): extra smoothing for the HA feed. Higher = fewer flips.
Oscillator Period (default 7): affects how fast strengthening/weakening shows in the fill color. Lower = quicker.
Tip: If you see too many flips, raise Period/Smoothing or pick a higher HTF. If it feels slow, lower them one notch.
Alerts (plain meaning)
Bullish Trend Switch: bias turned bearish → bullish.
Bullish Trend Strengthens / Weakens: same direction, momentum building / cooling.
Bearish Trend Switch: bullish → bearish.
Bearish Trend Strengthens / Weakens: same idea for shorts.
Use “Switch” to prepare for new setups; use “Strengthens/Weakens” to add/trim or tighten risk.
How it works (one paragraph, no math)
The script smooths price, builds Heikin-Ashi values on your chosen HTF, smooths those again, and doesn’t repaint on closed bars. From the HA open/close difference it creates a simple bias oscillator: above zero = bullish, below zero = bearish. The fill brightness tells you if that bias is getting stronger or weaker right now.
Good combos (optional, but recommended)
Volume Profile v3.2 : use VAH/VAL/POC/LVNs as your battleground.
Anchored VWAP : use reclaims/rejections for timing.
CVDv1 : sanity-check flow quality before entry.
FAQ (quick)
Does it repaint?
No on closed bars. HTF values are requested with a safe offset.
Best starting setup?
4H chart, HTF = 1D, Period/Smoothing 100/100, Oscillator 7.
Can I hide the HA candles?
Yes—toggle “Show HA Candles.” Keep only the bias fill if you want a cleaner price chart.
Short disclaimer
Educational tool, not advice. Markets carry risk. Test first, size small, and trade with your plan.

Elliott Wave Oscillator [JopAlgo]Elliott Wave Oscillator — a simple impulse meter that tells you when the move has “real push”
If price is the story, impulse is the emotion behind each chapter. The Elliott Wave Oscillator (EWO) is a clean way to see that emotion: it’s just the difference between a fast and a slow moving average. When the fast MA pulls away from the slow MA, the histogram grows; when they come back together, it shrinks. Above zero = bullish impulse; below zero = bearish impulse.
EWO keeps the math honest and the read effortless:
Choose SMA, EMA, or a volume-weighted average for each side (the “VWAP” option here uses a rolling VWMA over the chosen length).
A zero line anchors the read (bull vs bear).
Bars color by slope: rising = building momentum, falling = momentum fading.
(For screenshots: image #1 label the zero line, rising/falling bars, and a zero cross. Image #2 show a strong impulse leg hugging one side of zero, then fading into a pullback.)
What you’re seeing (and how it’s built)
Short MA (default 5) and Long MA (default 35) are computed using your selected MA Type (SMA, EMA, or rolling volume-weighted).
EWO = Short MA − Long MA.
EWO > 0: fast MA above slow → bullish impulse.
EWO < 0: fast MA below slow → bearish impulse.
Histogram colors:
Green bar: EWO increasing vs previous bar (momentum building).
Red bar: EWO decreasing (momentum waning).
Alerts: fire when EWO crosses the zero line (bullish or bearish “trend shift” heads-up).
New to this? Think of EWO as a throttle: above zero the engine is pushing forward; below zero it’s pushing backward. The height shows how hard it’s pushing; the color shows if that push is growing or fading right now.
How to use EWO on any timeframe
Same framework everywhere—what changes is your location and targets (from your other tools).
Scalping (1–5m)
Breakout confirmation: Only chase a micro-break if EWO flips above zero and grows green as price leaves a level (VAL/LVN/AVWAP). If it flips then immediately shrinks red, that’s your “don’t chase” warning.
Pullback timing: In a quick trend, wait for EWO to dip but stay above zero, then turn green again. That flip is often your pullback end.
Intraday (15m–1H)
Continuation filter: After a level break, ride as long as EWO stays on your side of zero. The first red bar while still above zero is a cue to partial or tighten stops.
Failed break tell: A poke through VAH/VAL with EWO still near zero (no expansion) is often a trap. Prefer retest/reclaim trades.
Swing (2H–4H)
Impulse leg ID: Strong trends show an EWO “bulge” (wide, mostly green bars above zero for longs). When that bulge shrinks back toward zero, look for mean-reversion to AVWAP/POC before the next leg.
Divergence (lightweight): Price makes a higher high, but EWO tops at a lower peak → impulse is weaker; plan for retrace to value.
Position (1D–1W)
Regime bias: Weeks where EWO lives above zero are net constructive; below zero are net distributive. Use that as a backdrop for adds/reductions at your higher-TF levels (Weekly AVWAP, composite VAL/VAH).
Entries, exits, and risk (simple rules)
Entry: At your level (from VP/AVWAP), take the side where EWO is on the correct side of zero and turning green (for longs) or red→green below zero for shorts? Careful—below zero, red means waning bear impulse. For shorts, you want EWO < 0 and increasing in magnitude (i.e., more negative) which still paints red in this script? Here’s the practical translation:
Longs: EWO > 0 and rising (green bar).
Shorts: EWO < 0 and falling (more negative vs prior bar). In this script, that also paints red—which is correct for building bearish impulse.
Manage: If your long was driven by EWO above zero, consider reducing when bars turn red repeatedly or EWO rolls back toward zero at your target node.
Invalidation: A zero cross against you after entry is a hard warning—tighten or exit unless higher-TF context strongly favors holding.
Stops: Place beyond the price level/structure you used, not on an EWO flip alone.
Settings that actually matter (and how to tune them)
MA Type (SMA / EMA / VWAP):
EMA: most responsive; great for scalping/fast intraday.
SMA: smoother; better for swings where you want fewer false wiggles.
VWAP (rolling VWMA): weights price by volume over your length—nice on pairs where volume behavior matters. (Note: this is a rolling VWMA, not an anchored session VWAP.)
Short/Long Lengths (default 5/35):
Shorter/faster (e.g., 4/20) → earlier flips, more noise.
Longer/slower (e.g., 8/50) → fewer but stronger signals.
Keep the ratio—something like 1:4 to 1:6—so the “bulge” is meaningful.
Zero-cross alerts: leave them on but treat as heads-up, not entries in isolation. You still want location + flow.
What to look for (pattern cheatsheet)
Impulse bulge: Wide, consecutive bars above zero (mostly green) → trend leg in progress. Expect shallow pullbacks only.
Pullback reset: After a leg, EWO shrinks but stays above zero, then flips green again → pullback likely done.
No-juice breakout: Price pokes the level but EWO stays near zero / flips red quickly → skip the chase; look for reclaim setups.
Divergence at extremes: New price high with lower EWO peak → risk of fade to value (POC/AVWAP).
Combining EWO with other tools
Cumulative Volume Delta v1 (CVDv1):
Use EWO for impulse, CVDv1 for quality. Best trades line up as:
EWO > 0 and increasing + CVDv1 ALIGN = OK + Imbalance strong + Absorption ≠ red → take the breakout/retest.
If EWO says “go” but CVDv1 flags Absorption, don’t chase.
Volume Profile v3.2:
Use VAH/VAL/LVNs/POC as where. EWO tells you if the push has fuel to leave/enter value.
Example: VAL retest with EWO turning up → rotate to POC/HVN.
Anchored VWAP:
Reclaims are higher quality when EWO flips above zero on the reclaim bar and holds green on the first pullback.
(Optional mention in screenshots: show a VAH break where EWO bulges and CVDv1 shows Alignment OK—clean continuation.)
Common pitfalls EWO helps you avoid
Buying a break with no impulse: Zero-line hugs and shrinking bars tell you the fast MA isn’t pulling away—skip.
Fading a real leg: Wide, persistent bars on one side of zero = don’t fight; use pullbacks to value instead.
Confusing volume-weighted vs anchored VWAP: The “VWAP” choice here is a rolling VWMA over the lookback, not a session/event AVWAP. Use Anchored VWAP when you need the true event-anchored line.
Practical defaults to start with
MA Type: EMA
Short/Long: 5 / 35
Timeframes: works out of the box on 15m–4H; for 1–5m try 4/20; for daily swings try 8/50.
Keep zero-cross alerts on as an attention ping; still require location + flow.
Alerts (what they mean)
Bullish EWO Signal: EWO crossed above zero → bullish impulse engaged. Look for a retest at your level with CVDv1 quality before entry.
Bearish EWO Signal: EWO crossed below zero → bearish impulse.
Open source & disclaimer
This indicator is published open source so traders can study it, tweak it, and build rules they trust. Tools inform decisions, but risk management decides outcomes.
Disclaimer — Not Financial Advice.
The “Elliott Wave Oscillator ” indicator and this description are provided for educational purposes only and do not constitute financial or investment advice. Trading involves risk, including possible loss of capital. makes no warranties and assumes no responsibility for any trading decisions or outcomes resulting from the use of this script. Past performance is not indicative of future results.
Use EWO to judge when there’s real push, Volume Profile v3.2 and Anchored VWAP for where to act, and CVDv1 to verify who’s actually pushing. That trio keeps you selective on any timeframe.

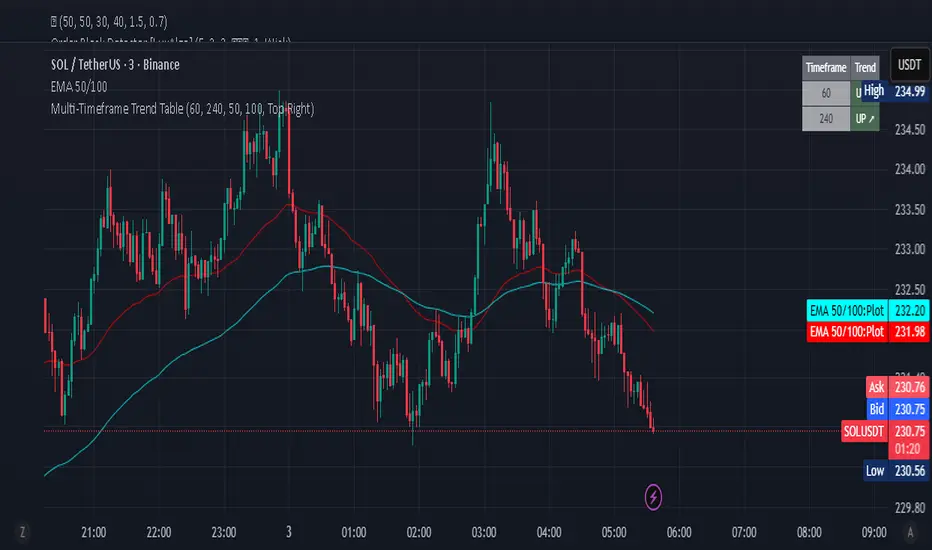
Multi-Timeframe Trend Table - Fully Customizable EMA Analysis📊 Complete Control Over Your Multi-Timeframe Analysis
This advanced indicator displays real-time trend direction for ANY two timeframes of your choice in a clean, professional table format. Perfect for traders who want complete flexibility in monitoring higher timeframe trends while executing trades on lower timeframes.
🎯 Key Features
Fully Customizable Timeframes: Choose ANY two timeframes from dropdown menus (1m to 1M)
Adjustable EMA Periods: Customize both short and long EMA lengths to match your strategy
Smart Timeframe Display: Automatic formatting (60→1H, 240→4H) or show custom labels
EMA-Based Logic: Uses proven EMA crossover methodology for trend determination
Visual Clarity: Color-coded table with green (uptrend) and red (downtrend) indicators
Optional EMA Values: Toggle to display actual EMA values in the table
Flexible Positioning: Place table in any corner of your chart
Built-in Alerts: Get notified when trends align or diverge
Real-Time Updates: Automatically refreshes with each bar close
Pine Script v6: Latest version with enhanced performance
📈 How It Works
The indicator determines trend direction using a simple but effective rule:
UPTREND: Price is above both Short EMA AND Long EMA
DOWNTREND: Price is below either Short EMA OR Long EMA
🔧 Comprehensive Settings
Timeframe Settings:
First Timeframe: Select any timeframe (default: 1H)
Second Timeframe: Select any timeframe (default: 4H)
EMA Settings:
Short EMA Length: Customizable (default: 50)
Long EMA Length: Customizable (default: 100)
Display Options:
Show EMA Values: Display actual EMA numbers in table
Table Position: 4 corner positions available
Custom Timeframe Labels: Toggle between formatted (1H) or raw (60) labels
Plot Current EMAs: Optional EMA lines on your current chart
💡 Trading Applications
✅ Complete Flexibility: Monitor any timeframe combination (5m/15m, 1H/1D, etc.)
✅ Strategy Alignment: Adapt EMA periods to match your trading system
✅ Trend Confirmation: Ensure trades align with higher timeframe direction
✅ Risk Management: Avoid counter-trend trades in strong directional markets
✅ Entry Timing: Use lower timeframe for entries while respecting higher timeframe bias
✅ Scalping Enhancement: Perfect for any scalping timeframe with higher timeframe context
✅ Swing Trading: Monitor daily/weekly trends while trading on hourly charts
🚨 Smart Alerts
Both Timeframes Bullish: Get notified when both timeframes turn bullish
Both Timeframes Bearish: Alert when both timeframes turn bearish
Timeframes Diverging: Know when your timeframes disagree on direction
🎨 Professional Design
Clean, modern table layout
Intuitive color coding (Green = Up, Red = Down)
Compact size that doesn't obstruct chart analysis
Clear typography for instant trend recognition
Customizable positioning for optimal workflow
📋 Perfect For
Day traders and scalpers of all timeframes
Swing traders seeking trend confirmation
Multi-timeframe analysis enthusiasts
Traders using custom EMA strategies
Anyone wanting flexible trend monitoring
Algorithmic traders needing trend filters
🚀 Easy Setup
Add to any chart (works on all timeframes)
Select your preferred timeframes from dropdowns
Adjust EMA periods to match your strategy
Customize display options and table position
Set up alerts for trend changes
Start trading with complete timeframe awareness
No complex configurations needed - just customize and trade!
🔄 Use Cases
Scalpers: Monitor 15m/1H while trading on 1m/3m
Day Traders: Watch 1H/4H while trading on 5m/15m
Swing Traders: Track 4H/1D while trading on 1H
Position Traders: Monitor 1D/1W while trading on 4H
Custom Strategies: Any timeframe combination you prefer
This indicator is designed for educational and informational purposes. Always combine with proper risk management and your own analysis.
RSI Trendlines and Divergences█OVERVIEW
The "RSI Trendlines and Divergences" indicator is an advanced technical analysis tool that leverages the Relative Strength Index (RSI) to draw trendlines and detect divergences. Designed for traders seeking precise market signals, the indicator identifies key pivot points on the RSI chart, draws trendlines between pivots, and detects bullish and bearish divergences. It offers flexible settings, background coloring for breakout signals, and divergence labels, supported by alerts for key events. The indicator is universal and works across all markets (stocks, forex, cryptocurrencies) and timeframes.
█CONCEPTS
The indicator was developed to provide an alternative signal source for the RSI oscillator. Trendline breakouts and bounces off trendlines offer a broader perspective on potential price behavior. Combining these with traditional RSI signal interpretation can serve as a foundation for creating various trading strategies.
█FEATURES
- RSI and Pivot Calculation: Calculates RSI based on the selected source price (default: close) with a customizable period (default: 14). Identifies pivot points on RSI and price for trendlines and divergences.
- RSI Trendlines: Draws trendlines connecting RSI pivots (upper for downtrends, lower for uptrends) with optional extension (default: 30 bars). The trendline appears and generates a signal only after the first RSI crossover. Lines are colored (red for upper, green for lower).
- Trendline Fill: Widens the trendline with a tolerance margin expressed in RSI points, reducing signal noise and visually highlighting trend zones. Breaking this zone is a condition for generating signals, minimizing false signals. The tolerance margin can be increased or decreased.
- Divergence Detection: Identifies bullish and bearish divergences based on RSI and price pivots, displaying labels (“Bull” for bullish, “Bear” for bearish) with adjustable transparency. Divergence labels appear with a delay equal to the specified pivot length (default: 5). Higher values yield stronger signals but with greater delay.
- Breakout Signals: Generates signals when RSI crosses the trendline (bullish for upper lines, bearish for lower lines), with background coloring for signal confirmation.
- Alerts: Built-in alerts for:
Detection of bullish and bearish divergences.
Upper trendline crossover (bullish signal).
Lower trendline crossover (bearish signal).
- Customization: Allows adjustment of RSI length, pivot settings, line colors, fills, labels, and transparency of signals and background.
█HOW TO USE
Add the indicator to your TradingView chart via the Pine Editor or Indicators menu.
Configuring Settings.
RSI Settings
- RSI Length: Period for RSI calculation (default: 14).
- SMA Length: Period for RSI moving average (default: 9).
- Source: Source price for RSI (default: close).
Pivot Settings for Trend
- Left Bars for Pivot: Number of bars back for detecting pivots (default: 10).
- Right Bars for Pivot: Number of bars forward for confirming pivots (default: 10).
- Extension after Second Pivot: Number of bars to extend the trendline (default: 30, 0 = none). Extension increases the number of signals, while shortening reduces them.
- Tolerance: Deviation in RSI points to widen the breakout margin, reducing signal noise (default: 3.0).
Divergence Settings
- Enable Divergence Detection: Enables/disables divergence detection (default: enabled).
- Pivot Length for Divergence: Pivot period for divergences (default: 5).
Style Settings
- Upper Trendline Color: Color for downtrend lines (default: red).
- Upper Fill Color: Fill color for upper lines (default: red, transparency 70).
- Lower Trendline Color: Color for uptrend lines (default: green).
- Lower Fill Color: Fill color for lower lines (default: green, transparency 70).
- SMA Color: Color for RSI moving average (default: yellow).
- Bullish Divergence Color: Color for bullish labels (default: green).
- Bearish Divergence Color: Color for bearish labels (default: red).
- Text Color: Color for label text (default: white).
- Divergence Label Transparency: Transparency of labels (0-100, default: 40).
- Signal Background Transparency: Transparency of breakout signal background (0-100, default: 80).
Interpreting Signals
- Trendlines: Upper lines (red) indicate RSI downtrends, lower lines (green) indicate uptrends. The trendline appears and generates a signal only after the first RSI crossover. Trendline breakouts suggest potential trend reversals.
- Divergences: “Bull” labels indicate bullish divergence (potential rise), “Bear” labels indicate bearish divergence (potential decline), with a delay based on pivot length (default: 5). Divergences serve as confirmation or warning of trend reversal, not as standalone signals.
- Signal Background: Green background signals bullish breakouts, red background signals bearish breakouts.
- RSI Levels: Horizontal lines at 70 (overbought), 50 (midline), and 30 (oversold) help assess market zones.
- Alerts: Set up alerts in TradingView for divergences or trendline breakouts.
Combining with Other Tools: Use with support/resistance levels, Fibonacci levels, or other indicators for signal confirmation.
█APPLICATIONS
The "RSI Trendlines and Divergence" indicator is designed to identify trends and potential reversal points, supporting both trend-following and reversal strategies:
- Trend Confirmation: Trendlines indicate the RSI trend direction, with breakouts signaling potential reversals. The indicator is functional in traditional RSI usage, allowing classic RSI interpretation (e.g., returning from overbought/oversold zones). Combining trendline breakouts with RSI signal levels, such as a return from overbought or oversold zones paired with a trendline breakout, strengthens the signal.
- Divergence Detection: Divergences serve as confirmation or warning of trend reversal, not as standalone signals.
█NOTES
- Adjust settings (e.g., RSI length, pivots, tolerance) to suit your trading style and timeframe.
- Combine with other technical analysis tools to enhance signal accuracy.

ADVANCED Stock Screener - Indian FNO + All MarketDisclaimer:
The following description is based on the functionality of a Pine Script indicator, and while the settings and inputs described can be adjusted to fit specific trading preferences, it is important to note that no indicator or trading strategy guarantees success in the markets. The use of this indicator should be done with caution, considering the inherent risks in trading. Users should test and evaluate the indicator thoroughly on demo accounts before applying it to live trades.📊 Stock Screener -
Symbol: The stock ticker symbol (e.g., AAPL, TSLA). Represents the company being analyzed.
Gap %: The percentage difference between the current open and the previous close. Used to identify gap-ups or gap-downs for potential breakouts or reversals.
VWAP: The average price weighted by volume. Used to assess institutional price levels. Price above VWAP indicates bullishness; below indicates bearishness.
RSI: A momentum oscillator measuring the speed and change of price movements. Values above 70 = overbought, below 30 = oversold.
ADX: Measures the strength of a trend (not direction). ADX > 25 = strong trend; ADX < 20 = weak or sideways. Often used with +DI and -DI.
Pullback: Indicates whether the stock is currently in a pullback (temporary retracement) within a larger trend. Useful for identifying entries in trending stocks.
Trend: Direction of the overall price movement: Bullish, Bearish, or Sideways. Calculated from multiple indicators like EMA, ADX, and price action.
Signal: A generated trading signal based on your strategy (e.g., Buy, Sell, Watch). Could combine multiple conditions like RSI oversold + price near support. ⚠️ Disclaimer:
This script is a technical analysis tool and is not financial advice. Trading involves risk, and past performance does not guarantee future results. Please test the indicator on demo accounts or historical charts before using it in live markets.
Always use proper risk management and make your own trading decisions.

Synthetic Implied APROverview
The Synthetic Implied APR is an artificial implied APR, designed to imitate the implied APR seen when trading cryptocurrency funding rates. It combines real-time funding rates with premium data to calculate an artificial market expectation of the annualized funding rate.
The (actual) implied APR is the market's expectation of the annualized funding rate. This is dependent on bid/ask impacts of the implied APR, something which is currently unavailable to fetch with TradingView. In essence, an implied APR of X% means traders believe that asset's funding fees to average X% when annualized.
What's important to understand, is that the actual value of the synthetic implied APR is not relevant. We only simply use its relative changes when we trade (i.e if it crosses above/below its MA for a given weight). Even for the same asset, the implied APRs will change depending on days to maturity.
How it calculates
The synthetic implied APR is calculated with these steps:
Collects premium data from perpetual futures markets using optimized lower timeframe requests (check my 'Predicted Funding Rates' indicator)
Calculates the funding rate by adding the premium to an interest rate component (clamped within exchange limits)
Derives the underlying APR from the 8-hour funding rate (funding rate × 3 × 365)
Apply a weighed formula that imitates both the direction (underlying APR) with the volatility of prices (from the premium index and funding)
premium_component = (prem_avg / 50 ) * 365
weighedprem = (weight * fr) + ((1 - weight) * apr) + (premium_component * 0.3)
impliedAPR = math.avg(weighedprem, ta.sma(apr, maLength))
How to use it: Generally
Preface: Funding rates are an indication of market sentiment
If funding is positive, generally the market is bullish as longs are willing to pay shorts funding
If funding is negative, generally the market is bearish as shorts are willing to pay longs funding
So, this script can be used like a typical oscillator:
Bullish: If implied APR > MA OR if implied APR MA is green
Bearish: If implied APR < MA OR if implied APR MA is red
The components:
Synthetic Implied APR: The main metric. At current setting of 0.7, it imitates volatility
Weight: The higher the value, the smoother the synthetic implied APR is (and MA too). This value is very important to the imitation. At 0.7, it imitates the actual volatility of the implied APR. At weight = 1, it becomes very smooth. Perfect for trading
Synthetic Implied APR Moving Average: A moving average of the Synthetic implied APR. Can choose from multiple selections, (SMA, EMA, WMA, HMA, VWMA, RMA)
How to use it: Trading Funding
When trading funding there're multiple ways to use it with different settings
Trade funding rates with trend changes
Settings: Weight = 1
Method 1: When the implied APR MA turns green, long funding rates (or short if red)
Method 2: When the implied APR crosses above the MA, long funding rates (or short when crosses below)
Trade funding rates with MA pullbacks
Settings: Weight = 0.7, timeframe 15m
In an uptrend: When implied APR crosses below then above the script, long funding opportunity
In an downtrend: When implied APR crosses above then below the script, shortfunding opportunity
You can determine the trend with the method before, using a weight of 1
To trade funding rates, it's best to have these 3 scripts at these settings:
Predicted Funding Rates: This allows you to see the predicted funding rates and see if they've maxxed out for added confluence too (+/-0.01% usually for Binance BTC futures)
Synthetic implied APR: At weight 1, the MA provides a good trend (whether close above/below or colour change)
Synthetic implied APR: At weight 0.7, it provides a good imitation of volatility
How to use it: Trading Futures
When trading futures:
You can determine roughly what the trend is, if the assumption is made that funding rates can help identify trends if used as a sentiment indicator. It should be supplemented with traditional trend trading methods
To prevent whipsaws, weight should remain high
Long trend: When the implied APR MA turns green OR when it crosses above its MA
Short trend: When the implied APR MA turns red OR when it below above its MA
Why it's original
This indicator introduces a unique synthetic weighting system that combines funding rates, underlying APR, and premium components in a way not found in existing TradingView scripts. Trading funding rates is a niche area, there aren't that many scripts currently available. And to my knowledge, there's no synthetic implied APR scripts available on TradingView either. So I believe this script to be original in that sense.
Notes
Because it depends on my triangular weighting algos, optimal accuracy is found on timeframes that are 4H or less. On higher timeframes, the accuracy drops off. Best timeframes for intraday trading using this are 15m or 1 hour
The higher the timeframe, the lower the MA one should use. At 1 hour, 200 or higher is best. At say, 4h, length of 50 is best
Only works for coins that have a Binance premium index
Inputs
Funding Period - Select between "1 Hour" or "8 Hour" funding cycles. 8 hours is standard for Binance
Table - Toggle the information dashboard on/off to show or hide real-time metrics including funding rate, premium, and APR value
Weight - Controls the balance between funding rate (higher values = smoother) and APR (lower values = more responsive) in the calculation, ranging from 0.0 to 1.0. Default is 0.7, this imitates the volatility
Auto Timeframe Implied Length - Automatically calculates optimal smoothing length based on your chart timeframe for consistent behavior across different time periods
Manual Implied Length - Sets a fixed smoothing length (in bars) when auto mode is disabled, with lower values being more responsive and higher values being smoother
Show Implied APR MA - Displays an additional moving average line of the Synthetic Implied APR to help identify trend direction and crossover signals
MA Type for Implied APR - Selects the calculation method (SMA, EMA, WMA, HMA, VWMA, or RMA) for the moving average, each offering different responsiveness and lag characteristics
MA Length for Implied APR - Sets the lookback period (1-500 bars) for the moving average, with shorter lengths providing more signals and longer lengths filtering noise
Show Underlying APR - Displays the raw APR calculation (without synthetic weighting) as a reference line to compare against the main indicator
Bullish Color - Sets the color for positive values in the table and rising MA line
Bearish Color - Sets the color for negative values in the table and falling MA line
Table Background - Customizes the background color and transparency of the information dashboard
Table Text Color - Sets the color for label text in the left column of the information table
Table Text Size - Controls the font size of table text with options from Tiny to Huge

Volume Profile 3D (Zeiierman)█ Overview
Volume Profile 3D (Zeiierman) is a next-generation volume profile that renders market participation as a 3D-style profile directly on your chart. Instead of flat histograms, you get a depth-aware profile with parallax, gradient transparency, and bull/bear separation, so you can see where liquidity stacked up and how it shifted during the move.
Highlights:
3D visual effect with perspective and depth shading for clarity.
Bull/Bear separation to see whether up bars or down bars created the volume.
Flexible colors and gradients that highlight where the most significant trading activity took place.
This is a state-of-the-art volume profile — visually powerful, highly flexible, and unlike anything else available.
█ How It Works
⚪ Profile Construction
The price range (from highest to lowest) is divided into a number of levels (buckets). Each bar’s volume is added to the correct level, based on its average price. This builds a map of where trading volume was concentrated.
You can choose to:
Aggregate all volume at each level, or
Split bullish vs. bearish volume , slightly offset for clarity.
This creates a clear view of which price zones matter most to the market.
⚪ 3D Effect Creation
The unique part of this indicator is how the 3D projection is built. Each volume block’s width is scaled to its relative size, then tilted with a slope factor to create a depth effect.
maxVol = bins.bu.max() + bins.be.max()
width = math.max(1, math.floor(bucketVol / maxVol * ((bar_index - start) * mult)))
slope = -(step * dev) / ((bar_index - start) * (mult/2))
factor = math.pow(math.min(1.0, math.abs(slope) / step), .5)
width → determines how far the volume extends, based on relative strength.
slope → creates the angled projection for the 3D look.
factor → adjusts perspective to make deeper areas shrink naturally.
The result is a 3D-style volume profile where large areas pop forward and smaller areas fade back, giving you immediate visual context.
█ How to Use
⚪ Support & Resistance Zones (HVNs and Value Area)
Regions where a lot of volume traded tend to act like walls:
If price approaches a high-volume area from above, it may act as support.
From below, it may act as resistance.
Traders often enter or exit near these zones because they represent strong agreement among market participants.
⚪ POC Rejections & Mean Reversions
The Point of Control (POC) is the single price level with the highest volume in the profile.
When price returns to the POC and rejects it, that’s often a signal for reversal trades.
In ranging markets, price may bounce between edges of the Value Area and revert to POC.
⚪ Breakouts via Low-Volume Zones (LVNs)
Low volume areas (gaps in the profile) offer path of least resistance:
Price often moves quickly through these thin zones when momentum builds.
Use them to spot breakouts or continuation trades.
⚪ Directional Insight
Use the bull/bear separation to see whether buyers or sellers dominated at key levels.
█ Settings
Use Active Chart – Profile updates with visible candles.
Custom Period – Fixed number of bars.
Up/Down – Adjust tilt for the 3D angle.
Left/Right – Scale width of the profile.
Aggregated – Merge bull/bear volume.
Bull/Bear Shift – Separate bullish and bearish volume.
Buckets – Number of price levels.
Choose from templates or set custom colors.
POC Gradient option makes high volume bolder, low volume lighter.
-----------------
Disclaimer
The content provided in my scripts, indicators, ideas, algorithms, and systems is for educational and informational purposes only. It does not constitute financial advice, investment recommendations, or a solicitation to buy or sell any financial instruments. I will not accept liability for any loss or damage, including without limitation any loss of profit, which may arise directly or indirectly from the use of or reliance on such information.
All investments involve risk, and the past performance of a security, industry, sector, market, financial product, trading strategy, backtest, or individual's trading does not guarantee future results or returns. Investors are fully responsible for any investment decisions they make. Such decisions should be based solely on an evaluation of their financial circumstances, investment objectives, risk tolerance, and liquidity needs.

HTF Candle Highs and Lows with Labels + High Probability Signals█ OVERVIEW
This indicator overlays Weekly, Daily, and H4 High/Low levels directly onto your chart, allowing traders to visualize key support and resistance zones from higher timeframes. It also includes high probability breakout signals that appear one candle after a confirmed breakout above or below these levels, filtered by volume and candle strength.
Use this tool to identify breakout opportunities with greater confidence and clarity.
█ FEATURES
• Plots Weekly, Daily, and H4 High and Low levels using request.security. • Customizable line colors, widths, and label sizes. • Toggle visibility for each timeframe independently. • Signals appear one candle after a confirmed breakout: • Bullish: Close above HTF High, strong candle, high volume. • Bearish: Close below HTF Low, strong candle, high volume. • Signal shapes match the color of the broken level for visual clarity.
█ HOW TO USE
1 — Enable the timeframes you want to track using the input toggles. 2 — Watch for triangle-shaped signals: • Upward triangle = Bullish breakout. • Downward triangle = Bearish breakout. 3 — Confirm the breakout: • Candle closes beyond the HTF level by at least 0.1%. • Candle body shows momentum (close > open for bullish, close < open for bearish). • Volume exceeds 20-period average. 4 — Enter trade on the candle after the signal. 5 — Use the HTF level as a reference for stop-loss placement. 6 — Combine with other indicators (e.g., RSI, EMA) for confluence.
█ LIMITATIONS
• Signals may lag by one candle due to confirmation logic. • Not optimized for low-volume assets or illiquid markets. • Best used in trending environments; avoid during consolidation. • Does not include automatic alerts (can be added manually).
█ BEST PRACTICES
• Use on H1 or higher timeframes for cleaner signals. • Avoid trading during news events or low volatility. • Backtest thoroughly before live trading. • Adjust breakout percentage and volume filter based on asset volatility. • Maintain a trading journal to track performance.

SuperScript Filtered (Stable)🔎 What This Indicator Does
The indicator is a trend and momentum filter.
It looks at multiple well-known technical tools (T3 moving averages, RSI, TSI, and EMA trend) and assigns a score to the current market condition.
• If most tools are bullish → score goes up.
• If most tools are bearish → score goes down.
• Only when the score is very strong (above +75 or below -75), it prints a Buy or Sell signal.
This helps traders focus only on high-probability setups instead of reacting to every small wiggle in price.
________________________________________
⚙️ How It Works
1. T3 Trend Check
o Compares a fast and slow T3 moving average.
o If the fast T3 is above the slow T3 → bullish signal.
o If it’s below → bearish signal.
2. RSI Check
o Uses the Relative Strength Index.
o If RSI is above 50 → bullish momentum.
o If RSI is below 50 → bearish momentum.
3. TSI Check
o Uses the True Strength Index.
o If TSI is above its signal line → bullish momentum.
o If TSI is below → bearish momentum.
4. EMA Trend Check
o Looks at two exponential moving averages (fast and slow).
o If price is above both → bullish.
o If price is below both → bearish.
5. Score System
o Each condition contributes +25 (bullish) or -25 (bearish).
o The total score can range from -100 to +100.
o Score ≥ +75 → Strong Buy
o Score ≤ -75 → Strong Sell
6. Signal Filtering
o Only one buy is allowed until a sell appears (and vice versa).
o A minimum bar gap is enforced between signals to avoid clutter.
________________________________________
📊 How It Appears on the Chart
• Green “BUY” label below candles → when multiple signals agree and the market is strongly bullish.
• Red “SELL” label above candles → when multiple signals agree and the market is strongly bearish.
• Background softly shaded green or red → highlights bullish or bearish conditions.
No messy tables, no clutter — just clear trend-based entries.
________________________________________
🎯 How Traders Can Use It
This indicator is designed to help traders by:
1. Filtering Noise
o Instead of reacting to every small crossover or RSI blip, it waits until at least 3–4 conditions agree.
o This avoids entering weak trades.
2. Identifying Strong Trend Shifts
o When a Buy or Sell arrow appears, it usually signals a shift in momentum that can lead to a larger move.
3. Reducing Overtrading
o By limiting signals, traders won’t be tempted to jump in and out unnecessarily.
4. Trade Confirmation
o Traders can use the signals as confirmation for their own setups.
o Example: If your strategy says “go long” and the indicator also shows a strong Buy, that trade has more conviction.
5. Alert Automation
o Built-in alerts mean you don’t have to watch the chart all day.
o You’ll be notified only when a strong signal appears.
________________________________________
⚡ When It Helps the Most
• Works best in trending markets (bullish or bearish).
• Very useful on higher timeframes (1h, 4h, daily) for swing trading.
• Can also work on lower timeframes (5m, 15m) if combined with higher timeframe trend filtering.
________________________________________
👉 In short
This indicator is a signal filter + trend detector. It combines four powerful tools into one scoring system, and only tells you to act when the odds are stacked in your favor.
________________________________________
SMC Volatility Liquidity Prothis one’s a confluence signaler. it fires “BUY CALL” / “BUY PUT” labels only when four things line up at once: trend, volatility squeeze, a liquidity sweep, and MACD momentum. quick breakdown:
what each block does
Trend filter (context)
ema50 > ema200 ⇒ trendUp
ema50 < ema200 ⇒ trendDn
Plots both EMAs for visual context.
Volatility compression (setup)
20-period Bollinger Bands (stdev 2).
bb_squeeze is true when current band width < its 20-SMA ⇒ price is compressed (potential energy building).
Liquidity sweep (trigger)
Tracks 20-bar swing high/low.
Long sweep: high > swingHigh ⇒ price just poked above the prior 20-bar high (took buy-side liquidity).
Short sweep: low < swingLow ⇒ price just poked below the prior 20-bar low (took sell-side liquidity).
MACD momentum (confirmation)
Standard MACD(12,26,9) histogram.
Bullish: hist > 0 and rising versus previous bar.
Bearish: hist < 0 and falling.
the actual entry signals
LongEntry = trendUp AND bb_squeeze AND liquiditySweepLong AND macdBullish
→ prints a green “BUY CALL” label below the bar.
ShortEntry = trendDn AND bb_squeeze AND liquiditySweepShort AND macdBearish
→ prints a red “BUY PUT” label above the bar.
alerts & dashboard
Alerts: fires when those long/short conditions hit so you can set TradingView alerts on them.
On-chart dashboard (bottom-right):
Trend (Bullish/Bearish/Neutral)
Squeeze (Yes/No)
Liquidity (Long/Short/None)
Momentum (Bullish/Bearish/Neutral)
Current Signal (BUY CALL / BUY PUT / WAIT)
(btw the comment says “2 columns × 5 rows” but the table is actually 5 columns × 2 rows—values under each label across the row.)
what it’s trying to capture (in plain english)
Trade with the higher-timeframe bias (EMA 50 over 200).
Enter as volatility compresses (bands tight) and a sweep grabs stops beyond a 20-bar extreme.
Only pull the trigger when momentum agrees (MACD hist direction & side of zero).
caveats / tips
It’s an indicator, not a strategy—no entries/exits/backtests baked in.
Signals are strict (4 filters), so you’ll get fewer but “cleaner” prints; still not magical.
The liquidity-sweep check uses the prior bar’s 20-bar high/low ( ), so on bar close it won’t repaint; intrabar alerts may feel jumpy if you alert “on every tick.”
Consider adding:
Exit logic (e.g., ATR stop + take-profit, or opposite signal).
Minimum squeeze duration (e.g., bb_squeeze true for N bars) to avoid one-bar dips in width.
Cool-down after a signal to prevent clustering.
Session/time or volume filter if you only want liquid hours.
if you want, I can convert this into a backtestable strategy() version with ATR-based stops/targets and a few toggles, so you can see stats right away.

Altcoins Exit Executor: 3Commas-Integrated [SwissAlgo]Title: Altcoins Exit Executor: 3Commas-Integrated
Plan and Execute your Altcoins Exits via 3Commas Integration
------------------------------------------------------------------
1. Facing These Struggles?
You're holding a portfolio of altcoins, and the question keeps nagging you: when should you exit? how?
If you're like many crypto traders, you might recognize these familiar struggles:
The Planning Problem : You know you should have an exit strategy, but every time you sit down to plan it, you get overwhelmed. Should you sell at 2x? 5x? What about that resistance level you spotted last month? You end up postponing the decision again and again.
The Execution Headache : You use 3Commas (or an Exchange directly) for your trades, but setting up Smart Trades for multiple coins means endless manual data entry. Price levels, percentages, quantities - by the time you finish entering everything, the market may have already moved.
The Portfolio Scale Problem : Managing 5 altcoins is challenging enough, but what about 15? Or 30? The complexity grows exponentially with each additional position. What started as a manageable analysis for a few coins becomes an overwhelming juggling act that may lead to rushed decisions or complete paralysis.
The Consistency Challenge : You approach each coin differently. Maybe you're conservative with one position and aggressive with another, without any systematic reasoning. Your portfolio becomes a patchwork of random decisions rather than a coherent strategy. With dozens of positions, maintaining any consistent approach becomes nearly impossible.
The "What If" Anxiety : What happens if the market crashes while you're sleeping? You know you should have stop-losses, but setting them up properly across multiple positions feels overwhelming. The more coins you hold, the more potential failure points you need to monitor.
The Information Overload : You collect multiple data points, but how do you synthesize all this information into actionable exit points? Multiply this analysis across 20+ different altcoins, and the task becomes nearly impossible to execute consistently.
This indicator may help address these challenges by providing you with:
A systematic approach to analyzing potential resistance levels across multiple technical frameworks. All potential resistances (including Fibonacci levels) are calculated automatically
Tools to structure your exit plan with clear take-profit levels and position sizing
Automated generation of 3Commas 'Smart Trades' that match your exit strategy exactly, without manual entry
Optional emergency exit protection that could potentially guard against sudden market reversals (exit managed within the 3Commas 'Smart Trade' itself)
A consistent methodology you can apply across your entire altcoin portfolio, regardless of size
The goal is to transform exit planning from a source of stress and procrastination into a structured, repeatable process that may help you execute your trading plan in a consistent fashion, whether you're managing 3 coins or 30.
------------------------------------------------------------------
2. Is this for You?
This indicator is designed for cryptocurrency traders who:
Hold a portfolio of multiple altcoins (typically 5+ positions)
Are actively seeking a systematic solution to plan and execute exit strategies
Have an active 3Commas account connected to their exchange
Understand 3Commas basics: Smart Trades, API connections, and account management
Have an account tier that supports their portfolio size (3Commas Free Plan: up to 3 trades/alts, Pro Plan: up to 50+ trades/alts)
Important: This tool provides analysis and automation assistance, not trading advice. All exit decisions require your individual judgment and proper risk management.
If you don't use 3Commas, you may still find value in the resistance analysis components, though the automated execution features require a 3Commas account and basic platform knowledge.
------------------------------------------------------------------
3. How does it work?
This indicator streamlines your exit planning process into four steps:
Step 1: Analyze Your Coin & Define Exit Plan
The indicator automatically calculates multiple types of resistance levels that may act as potential exit points:
Fibonacci Extensions (projected resistance from recent price swings)
Fibonacci Retracements (resistance from previous cycle highs)
Major Pivot Highs (historical price rejection points)
Volume Imbalances (PVSRA analysis showing institutional activity zones)
Price Multipliers (2x, 3x, 4x, 5x psychological levels)
Market Trend Analysis (bull/bear market strength assessment)
You can view all resistance types together or focus on specific categories to identify potential exit zones.
Step 2: Enter Your Exit Plan.
Define your sequential take-profit strategy:
Set up to 5 take-profit levels with specific prices
Assign percentage of coins to sell at each level
Add your total coin quantity and average entry price
Optionally enable emergency exit (stop-loss) protection. The indicator validates your plan in real-time, ensuring percentages sum to 100% and prices follow logical sequences.
Step 3: Connect with 3Commas
Relay Secret
3Commas API keys (Public and Private)
Account ID (your exchange account on 3Commas)
Step 4: Generate Smart Trade on 3Commas
Create a TradingView alert that automatically:
Sends your complete exit plan to 3Commas
Creates a Smart Trade with all your take-profit levels
Includes stop-loss protection if enabled
Requires no manual data entry on the 3Commas platform
The entire process is designed to streamline the time required to move from analysis to execution, providing a standardized methodology across your altcoin positions.
User Experience Features:
Step-by-step guided workflow
Interactive submission helper with status tracking
Exit plan table with detailed projections
Comprehensive legend and educational tooltips
Dark/light theme compatibility
Organized visual presentation of all resistance levels
------------------------------------------------------------------
4. Using the Indicator
Complete the 4-step guided workflow within the indicator to set up an Exit Plan and submit it to 3Commas.
At the end of the process, you will see a Smart Trade created on 3Commas reflecting your custom Exit Plan (inclusive of Stop Loss, if enabled).
Recommended Settings
Analyze your Exit Plan on the 1-Day timeframe
Use the Tradingview's Dark-Theme for high visual contrast
Set candles to 'Bar-Type' to view volumr-based candle colors (PVSRA analysis)
Use desktop for full content visibility
Analyzing Resistance Levels
Enable "Show all Resistance Levels" to view comprehensive analysis across your chart
Focus on resistance clusters where multiple resistance seem to converge - these may indicate stronger potential exit zones
Note the color-coded system: gray lines indicate closer levels, red lines suggest stronger resistance or potentially "out-of-reach" targets
Pay attention to the Golden Zone (Fibonacci 0.618-0.786 area) highlighted in green, it might act as a significant price magnet for average altcoins
Decide how many Take Profit Steps to use (min. 1 - max- 5)
Setting up your Plan
Enter the total number of coins you want to sell with the script
Enter your average entry price, if known (otherwise the script will use the current price as backup)
Enter the TP levels you decided to activate (price, qty to sell at each TP level)
Decide about the Emergency Exit (the price that, when broken, will trigger the sale of 100% of your coins with a close limit order)
Setting Up Your 3Commas Connection
Generate API keys in your 3Commas account with (User Profile→3Commas API→New API Access Token→System Generated→Permission: "Smart Trades Only" (leave all other permissions unchecked) + Whitelisted IP→Create→Save API public/private key securely)
Find your Account ID in the 3Commas exchange URL (My Portfolio→View Exchange→Look at the last number in the url of the webpage - should be a 8-digit number)
Enter all credentials in the indicator's connection section
Verify the green checkmarks appear on the Exit Table, confirming that plan and connection are validated
Deploying Your Plan
Check box "Step 1: Check and confirm Exit Plan" in section 4 of User Settings
Create a TradingView alert (Alert→Select Altcoins Exit Planner PRO→Any alert() function call→Interval Same as Chart→Open Ended→Message: coin name→Notifications: enable Webhook→save and exit
Your Smart Trade appears automatically in 3Commas within minutes
IMPORTANT: Delete the alert after successful deployment to prevent duplicated Smart Trades
To modify the Exit Plan: Delete the Smart Trade on 3Commas and repeat the process above
Monitor your Smart Trade execution through your 3Commas dashboard
Important Notes
Always verify your plan in the Exit Table before deployment
Test with smaller positions initially to familiarize yourself with the process
The indicator provides analysis - final trading decisions remain yours
Manage your API keys and Relay secret with caution: do not share with third parties, store them securely, use malware protection on your PC
Your API keys, trading data, and credentials are transmitted securely through direct API connections and are never stored, logged, or accessible to the indicator author - all communication occurs directly between your browser and the target platforms that support the service.
------------------------------------------------------------------
5. Understanding the Resistance Analysis
Fibonacci Extensions: Calculated from three key points: 2022 bear market bottom → early 2024 bull market high → 2025 retracement low. These project where price might encounter resistance during future rallies based on mathematical ratios (0.618, 1.0, 1.618, 2.0, etc.).
Fibonacci Retracements: For established altcoins: calculated from 2021 cycle peak to 2022 bottom. For newer altcoins: from all-time high to subsequent major low. These show potential resistance zones where price may struggle to reclaim previous highs.
Major Pivot Highs: Historical price levels where significant reversals occurred. These act as potential resistance because traders may remember these levels and place sell orders near them.
Volume Imbalances (PVSRA) : Areas where price moved rapidly on abnormal volume, creating gaps that may attract future price action or orders. The indicator uses volume-to-price-range analysis (PVSRA candles or "Vector Candles") to identify these zones.
Price Multipliers: Reference lines showing 2x, 3x, 4x, 5x current price to help you assess the feasibility of your exit targets. These serve as a "reality check" - if you're setting a take-profit at 4x current price, you can quickly evaluate whether that level seems reasonable given current market conditions and your risk tolerance.
Market Trend Analysis: Uses EMA combined with ADX/DMI indicators to assess current market phase (bull/strong bull, bear/strong/bear, weakening trend)
This technical foundation helps explain why certain price levels appear as potential exit zones, though market conditions ultimately determine actual price behavior.
------------------------------------------------------------------
6. FAQs
GENERAL FAQS
Can I use one indicator for multiple altcoins?
Answer: No, each altcoin needs its own chart layout with a separate indicator installation. Resistance levels are calculated from each coin's unique price history, and your exit plan will be different for each position. When you deploy an alert, it creates one Smart Trade on 3Commas for that specific coin only.
To manage multiple coins, create separate TradingView layouts for each altcoin, configure the indicator individually on each chart, then deploy one alert per coin when ready to execute. This ensures each position gets personalized analysis and allows different exit strategies across your portfolio.
EXIT PLAN ANALYSIS/RESISTANCE LEVELS
Are resistance lines calculated automatically by the script?
Answer: Yes, all resistance lines are calculated automatically based on your coin's price history and market data. You don't need to manually identify or draw any levels. The script analyzes historical pivots, calculates Fibonacci ratios from key price swings, identifies volume imbalance zones, and plots everything on your chart.
Simply enable "Show all Resistance Levels" in the settings and the indicator will display all potential resistance zones with color-coded lines and labels showing the exact price levels and their significance.
What's the difference between Fibonacci Extensions and Fibonacci Retracements?
Answer: Fibonacci Retracements look at completed moves from the past and show where price might struggle to reclaim previous highs. For established coins, they're calculated from 2021 peaks down to 2022 bottoms.
Fibonacci Extensions project forward from recent price swings to estimate where ongoing rallies might encounter resistance. They use three points: 2022 bottom, 2024 high, and 2025 retracement low.
Retracements ask "where might recovery stall based on old highs" while Extensions ask "where might this current rally run into trouble." Both use the same mathematical ratios but different reference points to give you complementary resistance perspectives.
Why are some resistance lines gray and others red?
Answer: The color coding helps you assess the potential difficulty of reaching different resistance levels. Gray lines represent closer resistance levels, while red lines indicate stronger resistance or potentially "out-of-reach" targets that may require exceptional market conditions to break through.
This visual system helps you prioritize your exit planning by distinguishing between near-term targets and more ambitious longer-term objectives when setting your take-profit levels.
What is the resistance from major pivot highs?
Answer: Major pivot highs are historical price levels where significant reversals occurred in the past. These levels often act as resistance because traders remember these previous "ceiling" points where price failed to break higher and may place sell orders near them again.
The indicator automatically identifies these pivot points from your coin's price history and draws horizontal lines at those levels. When price approaches these areas again, it may struggle to break through due to psychological resistance and clustered sell orders from traders who expect similar rejection patterns.
What is the resistance from abnormal volumes?
Answer: Volume imbalances occur when price moves rapidly on abnormally high volume, creating gaps or zones where institutions moved large amounts quickly. These areas often act as resistance when price returns to them because institutional traders may want to "fill" these gaps or add to their positions at those levels.
The indicator uses PVSRA analysis to identify candles with abnormal volume-to-price ratios and marks these zones on your chart. When price approaches these imbalance areas again, it may encounter resistance from institutional activity or algorithmic trading systems programmed to react at these levels.
What are price multipliers?
Answer: Price multipliers are reference lines showing 2x, 3x, 4x, and 5x the current price. They serve as a reality check when setting your take-profit targets. If you're considering a take-profit at $10 and current price is $2, you can quickly see that's a 5x target and evaluate whether that seems realistic given current market conditions.
These lines help you assess the feasibility of your exit goals and avoid setting unrealistic expectations. They're not resistance levels themselves, but visual aids to help you gauge whether your planned targets are conservative, aggressive, or somewhere in between
How is the EMA calculated and why does it represent bull/bear market intensity?
Answer: The indicator uses a 147-period EMA (1D tf) combined with ADX and DMI indicators to assess market phases. The EMA provides the basic trend direction - when price is above the EMA, it suggests bullish conditions, and when below, bearish conditions.
The intensity comes from the ADX/DMI analysis. Strong bull markets occur when price is above the EMA, ADX is above 25 (indicating strong trend), and the positive directional indicator dominates. Strong bear markets show the opposite pattern with negative directional movement dominating.
The system also uses weekly ADX slope to confirm trend strength is increasing rather than fading. This combination helps distinguish between weak sideways markets and genuine strong trending phases, giving you context at the time of exit planning.
EXIT PLAN
Why does my exit plan show errors?
Answer: The indicator validates your plan in real-time and shows specific error messages to help you fix issues. Common problems include take-profit percentages that don't sum to exactly 100%, price levels set in wrong order (TP2 must be higher than TP1), or gaps in your sequence (you can't use TP3 without filling TP1 and TP2 first).
Check the Exit Plan Validation section in the table - it will show exactly what needs fixing with messages like "TP percentages must sum to exactly 100%" or "Fill TPs consecutively starting from TP1." Fix the highlighted issue and the error will clear automatically, turning your validation checkmark green when everything is correct.
Why do I need to provide my coin quantity and average entry price?
Answer: The coin quantity is essential because the indicator calculates exact amounts to sell at each take-profit level based on your percentages. If you set TP1 to sell 25% of your position, the script needs to know your total quantity to calculate that 25% means exactly X coins in your 3Commas Smart Trade.
The average entry price helps calculate your projected gains and portfolio performance in the Exit Table. If you don't know your exact entry price, leave it at zero and the indicator will use current price as a fallback for calculations. Both pieces of information ensure your Smart Trade matches your actual position size and gives you accurate profit projections.
What is the emergency exit price?
Answer: The emergency exit price is an optional stop-loss feature that automatically sells 100% of your coin position if price falls to your specified level. This is critical to understand because once triggered, 3Commas will execute the sale immediately without further confirmation.
When price hits your emergency exit level, 3Commas places a limit sell order at 3% below that price to avoid poor market execution. However, execution is not guaranteed because limit orders may not fill during extreme volatility or if price gaps below your limit level. Use this feature cautiously and set the emergency price well below normal support levels to account for typical market fluctuations.
This sells your entire position regardless of your take-profit plan, so only enable it if you want automated crash protection and understand the risks of potential false breakdowns triggering unnecessary exits.
3COMMAS CONNECTION
How do I get my 3Commas API keys and Account ID?
Answer:
For API Keys: Log into 3Commas, go to User Profile → 3Commas API → New API Access Token → System Generated. Set permissions to "Smart Trades Only" (leave all other permissions unchecked) and add your IP to the whitelist for security. Save both the public and private keys securely after creation.
For Account ID: Go to My Portfolio → View Exchange in 3Commas. Look at the URL in your browser - the Account ID is the 8-digit number at the end of the webpage address (example: if the URL shows "/accounts/12345678" then your Account ID is 12345678).
Important: Never share these credentials with anyone. The indicator transmits them directly to 3Commas through secure API connections without storing or logging them. If you suspect your keys are compromised, revoke them immediately in your 3Commas account and generate new ones.
ALERTS
I have set up my exit plan, what's next?
Answer: Once your exit plan is configured and shows green checkmarks in the validation section, follow the 4-step workflow in the indicator. Check "Step 1: Check and confirm Exit Plan" to enable alert firing, then create a TradingView alert using the Altcoins Exit Planner PRO condition with "Any alert() function call" trigger.
The alert fires immediately and sends your plan to 3Commas. Within minutes, you should see a new Smart Trade appear in your 3Commas dashboard matching your exact exit strategy. After confirming the Smart Trade was created successfully, delete the TradingView alert to prevent duplicate submissions.
From that point, 3Commas manages your exit automatically according to your plan. Monitor execution through your 3Commas dashboard and let the platform handle the sequential take-profit levels as price moves.
How do I create the TradingView alert?
Answer: Click the "Alert" button in TradingView (bell icon in the top toolbar). In the alert setup window, set Condition to "Altcoins Exit Planner PRO" and Trigger to "Any alert() function call." Keep Interval as "Same as Chart" and Expiration as "Open Ended."
In the Message section, you can name your alert anything you want. In the Notifications section, enable the webhook option (leave the URL field as you'll handle that separately). You can also enable email or sound notifications if desired.
Click "Create" to activate the alert. If Step 1 is already checked in your indicator, the alert will fire immediately and send your exit plan to 3Commas. Remember to delete this alert after your Smart Trade appears to prevent duplicates.
I got the Smart Trade on 3Commas, what's next?
Answer: Congratulations! Your exit plan is now active and automated. Delete the TradingView alert immediately to prevent duplicate Smart Trades from being created. You can now monitor your Smart Trade's progress through your 3Commas dashboard.
3Commas will automatically execute your take-profit levels as price reaches each target, selling the specified percentages of your position according to your plan. If you enabled emergency exit protection, that stop-loss is also active and monitoring for downside protection.
Your job is essentially done - let 3Commas handle the execution while you monitor overall market conditions. You can view trade progress, modify the Smart Trade if needed, or manually close it early through your 3Commas interface. The platform will manage all the sequential selling according to your original exit strategy.
Can I cancel my exit plan and resubmit to 3Commas?
Answer: Yes, you can modify your exit strategy by first deleting the existing Smart Trade in your 3Commas dashboard, then resubmitting a new plan through the indicator.
To cancel and resubmit: Go to your 3Commas Smart Trades section and delete the current trade. Return to the TradingView indicator, modify your exit plan settings (prices, percentages, emergency exit, etc.), then repeat the deployment process by checking Step 1 and creating a new alert.
This creates a fresh Smart Trade with your updated parameters. Always ensure you delete the old Smart Trade first to avoid having multiple conflicting exit plans running simultaneously. The new deployment will overwrite nothing automatically - you must manually clean up the old trade before submitting the revised plan.
Why did I get a second Smart Trade after the first one?
Answer: This happens when you forget to delete the TradingView alert after your first Smart Trade was created successfully. The alert remains active and continues firing, creating duplicate Smart Trades each time it triggers.
Always delete your TradingView alert immediately after confirming your Smart Trade appears in 3Commas. Go to your TradingView alerts list, find the alert you created for this exit plan, and delete it completely. Also delete any duplicate Smart Trades in your 3Commas dashboard to avoid confusion.
To prevent this in future deployments, remember the workflow: create alert → Smart Trade appears → delete alert immediately. Each exit plan should only generate one Smart Trade, and keeping alerts active will cause unwanted duplicates.
------------------------------------------------------------------
7. Limitations and Disclaimer
Limitations:
Doesn't provide trading signals or entry points
Doesn't guarantee resistance levels will hold
Requires manual monitoring of 3Commas execution
Works for exit planning only, not position building
Disclaimer
This indicator is for educational and informational purposes only. It does not constitute financial, investment, or trading advice.
The indicator:
Makes no guarantees about future market performance
Cannot predict market movements with certainty
May generate false indications
Relies on historical patterns that may not repeat
Should not be used as the sole basis for trading decisions
Users are responsible for:
Conducting independent research and analysis
Understanding the risks of cryptocurrency trading
Making their own investment/divestment decisions
Managing position sizes and risk exposure appropriately
Managing API keys and secret codes diligently (do not share with third parties, store them securely, use malware protection on your PC)
Cryptocurrency trading involves substantial risk and may not be suitable for all investors. Past performance does not guarantee future results. Users should only invest what they can afford to lose and consult qualified professionals before making financial decisions.
The indicator’s assumptions may be invalidated by changing market conditions.
By using this tool, users acknowledge these limitations and accept full responsibility for their trading decisions.

AI Trading Alerts v6 — SL/TP + Confidence + Panel (Fixed)Overview
This Pine Script is designed to identify high-probability trading opportunities in Forex, commodities, and crypto markets. It combines EMA trend filters, RSI, and Stochastic RSI, with automatic stop-loss (SL) & take-profit (TP) suggestions, and provides a confidence panel to quickly assess the trade setup strength.
It also includes TradingView alert conditions so you can set up notifications for Long/Short setups and EMA crosses.
⚙️ Features
EMA Trend Filter
Uses EMA 50, 100, 200 for trend confirmation.
Bull trend = EMA50 > EMA100 > EMA200
Bear trend = EMA50 < EMA100 < EMA200
RSI Filter
Bullish trades require RSI > 50
Bearish trades require RSI < 50
Stochastic RSI Filter
Prevents entries during overbought/oversold extremes.
Bullish entry only if %K and %D < 80
Bearish entry only if %K and %D > 20
EMA Proximity Check
Price must be near EMA50 (within ATR × adjustable multiplier).
Signals
Continuation Signals:
Long if all bullish conditions align.
Short if all bearish conditions align.
Cross Events:
Long Cross when price crosses above EMA50 in bull trend.
Short Cross when price crosses below EMA50 in bear trend.
Automatic SL/TP Suggestions
SL size adjusts depending on asset:
Gold/Silver (XAU/XAG): 5 pts
Bitcoin/Ethereum: 100 pts
FX pairs (default): 20 pts
TP = SL × Risk:Reward ratio (default 1:2).
Confidence Score (0–4)
Based on conditions met (trend, RSI, Stoch, EMA proximity).
Labels:
Strongest (4/4)
Strong (3/4)
Medium (2/4)
Low (1/4)
Visual Panel on Chart
Shows ✅/❌ for each condition (trend, RSI, Stoch, EMA proximity, signal now).
Confidence row with color-coded strength.
Alerts
Long Setup
Short Setup
Long Cross
Short Cross
🖥️ How to Use
1. Add the Script
Open TradingView → Pine Editor.
Paste the full script.
Click Add to chart.
Save as "AI Trading Alerts v6 — SL/TP + Confidence + Panel".
2. Configure Inputs
EMA Lengths: Default 50/100/200 (works well for swing trading).
RSI Length: 14 (standard).
Stochastic Length/K/D: Default 14/3/3.
Risk:Reward Ratio: Default 2.0 (can change to 1.5, 3.0, etc.).
EMA Proximity Threshold: Default 0.20 × ATR (adjust to be stricter/looser).
3. Read the Panel
Top-right of chart, you’ll see ✅ or ❌ for:
Trend → Are EMAs aligned?
RSI → Above 50 (bull) or below 50 (bear)?
Stoch OK → Not extreme?
Near EMA50 → Close enough to EMA50?
Above/Below OK → Price position vs. EMA50 matches trend?
Signal Now → Entry triggered?
Confidence row:
🟢 Green = Strongest
🟩 Light green = Strong
🟧 Orange = Medium
🟨 Yellow = Low
⬜ Gray = None
4. Alerts Setup
Go to TradingView Alerts (⏰ icon).
Choose the script under “Condition”.
Select alert type:
Long Setup
Short Setup
Long Cross
Short Cross
Set notification method (popup, sound, email, mobile).
Click Create.
Now TradingView will notify you automatically when signals appear.
5. Example Workflow
Wait for Confidence = Strong/Strongest.
Check if market session supports volatility (e.g., XAU in London/NY).
Review SL/TP suggestions:
Long → Entry: current price, SL: close - risk_pts, TP: close + risk_pts × RR.
Short → Entry: current price, SL: close + risk_pts, TP: close - risk_pts × RR.
Adjust based on your own price action analysis.
📊 Best Practices
Use on H1 + D1 combo → align higher timeframe bias with intraday entries.
Risk only 1–2% of account per trade (position sizing required).
Filter with market sessions (Asia, Europe, US).
Strongest signals work best with trending pairs (e.g., XAUUSD, USDJPY, BTCUSD).

TEWMA - [JTCAPITAL]TEWMA - is a modified way to use Triple Exponential Moving Average (TEMA) combined with Weighted Moving Average (WMA) and adaptive multi-length averaging for Trend-Following.
The indicator blends short- and extended-length smoothed signals into a single adaptive line, then assigns directional bias to highlight bullish or bearish phases more clearly.
The indicator works by calculating in the following steps:
Source Selection
The script begins with a selectable price source (default: Close, but can be changed to Open, High, Low, HL2, etc.). This ensures flexibility depending on the user’s preferred market perspective.
Dual-Length Calculation
A base length ( len ) is chosen, and then multiplied by a factor ( multi , default 1.75). This produces a secondary, longer period ( len2 ) that adapts proportionally to the base.
Weighted + Triple Exponential Smoothing
-First, a WMA (Weighted Moving Average) is applied to the price source.
-Then, the TEMA (Triple Exponential Moving Average) is applied to smooth the WMA even further.
-This process is repeated for both len and len2 , producing TEWMA1 and TEWMA2 .
Adaptive Averaging
The final TEWMA line is calculated as the average of TEWMA1 and TEWMA2, creating a blend between the short-term and extended-term signals. This balances reactivity and stability, reducing lag while avoiding excessive noise.
Trend Direction Detection
-If TEWMA is greater than its previous value → Bullish .
-If TEWMA is lower than its previous value → Bearish .
-A Signal variable is used to store this directional bias, ensuring continuity between bars.
Visual Plotting
-The main TEWMA is plotted with bold coloring (Blue for bullish, Purple for bearish).
-TEWMA1 and TEWMA2 are plotted as thinner supporting lines.
-Each line is given a shadow-fill (between 100% and 90% of its value) for emphasis and visual clarity.
Alerts
Custom alerts are defined:
- TEWMA Long → when bullish.
- TEWMA Short → when bearish.
-These alerts can be integrated into TradingView’s alerting system for automated notifications.
Buy and Sell Conditions :
- Buy : Triggered when TEWMA rises (bullish slope). The indicator colors the line blue and an alert can be fired.
- Sell : Triggered when TEWMA declines (bearish slope). The line turns purple, signaling potential short or exit points.
Features and Parameters :
- Source → Selectable price input (Close, Open, HL2, etc.).
- Length (len) → Base period for the WMA/TEMA calculation.
- Multiplier (multi) → Scales the secondary length to create a longer-term smoothing.
- Color-coded Trend Lines → Blue for bullish, Purple for bearish.
- Shadow Fill Effects → Provides depth and easier visualization of trend direction.
- Alert Conditions → Prebuilt alerts for both Long and Short scenarios.
Specifications :
Weighted Moving Average (WMA)
The WMA assigns more weight to recent price values, making it more responsive than a Simple Moving Average (SMA). This enhances early detection of market turns while reducing lag compared to longer-term averages.
Triple Exponential Moving Average (TEMA)
TEMA is designed to minimize lag by combining multiple EMA layers (EMA of EMA of EMA). It is smoother and more adaptive than traditional EMAs, making it ideal for detecting true market direction without overreacting to small fluctuations.
Multi-Length Averaging
By calculating two versions of WMA → TEMA with different lengths and then averaging them, the indicator balances responsiveness (short-term sensitivity) and reliability (long-term confirmation). This prevents whipsawing while keeping signals timely.
Adaptive Signal Assignment
Instead of simply flipping signals at crossovers, the indicator checks slope direction of TEWMA. This ensures smoother trend-following behavior, reducing false positives in sideways conditions.
Color-Coding & Visual Shading
Visual clarity is achieved by coloring bullish periods differently from bearish ones, with shaded fills beneath each line. This allows traders to instantly identify trend conditions and compare short- vs long-term signals.
Alert Conditions
Trading decisions can be automated by attaching alerts to the TEWMA’s bullish and bearish states. This makes it practical for active trading, swing setups, or algorithmic strategies.
Enjoy!
Market Pressure Oscillator█ OVERVIEW
The Market Pressure Oscillator is an advanced technical indicator for TradingView, enabling traders to identify potential trend reversals and momentum shifts through candle-based pressure analysis and divergence detection. It combines a smoothed oscillator with moving average signals, overbought/oversold levels, and divergence visualization, enhanced by customizable gradients, dynamic band colors, and alerts for quick decision-making.
█ CONCEPT
The indicator measures buying or selling pressure based on candle body size (open-to-close difference) and direction, with optional smoothing for clarity and divergence detection between price action and the oscillator. It relies solely on candle data, offering insights into trend strength, overbought/oversold conditions, and potential reversals with a customizable visual presentation.
█ WHY USE IT?
- Divergence Detection: Identifies bullish and bearish divergences to reinforce signals, especially near overbought/oversold zones.
- Candle Pressure Analysis: Measures pressure based on candle body size, normalized to a ±100 scale.
- Signal Generation: Provides buy/sell signals via overbought/oversold crossovers, zero-line crossovers, moving average zero-line crossovers, and dynamic band color changes.
- Visual Clarity: Uses dynamic colors, gradients, and fill layers for intuitive chart analysis.
Flexibility: Extensive settings allow customization to individual trading preferences.
█ HOW IT WORKS?
- Candle Pressure Calculation: Computes candle body size as math.abs(close - open), normalized against the average body size over a lookback period (avgBody = ta.sma(body, len)). - Candle direction (bullish: +1, bearish: -1, neutral: 0) is multiplied by body weight to derive pressure.
- Cumulative Pressure: Sums pressure values over the lookback period (Lookback Length) and normalizes to ±100 relative to the maximum possible value.
- Smoothing: Optionally applies EMA (Smoothing Length) to normalized pressure.
- Moving Average: Calculates SMA (Moving Average Length) for trend confirmation (Moving Average (SMA)).
- Divergence Detection: Identifies bullish/bearish divergences by comparing price and oscillator pivot highs/lows within a specified range (Pivot Length). Divergence signals appear with a delay equal to the Pivot Length.
- Signals: Generates signals for:
Crossing oversold upward (buy) or overbought downward (sell).
Crossing the zero line by the oscillator or moving average (buy/sell).
Bullish/bearish divergences, marked with labels, enhancing signals, especially near overbought/oversold zones.
Dynamic band color changes when the moving average crosses MA overbought/oversold thresholds (green for oversold, red for overbought).
- Visualization: Plots the oscillator and moving average with dynamic colors, gradient fills, transparent bands, and labels, with customizable overbought/oversold levels.
Alerts: Built-in alerts for divergences, overbought/oversold crossovers, and zero-line crossovers (oscillator and moving average).
█ SETTINGS AND CUSTOMIZATION
- Lookback Length: Period for aggregating candle pressure (default: 14).
- Smoothing Length (EMA): EMA length for smoothing the oscillator (default: 1). Higher values smooth the signal but may reduce signal frequency; adjust overbought/oversold levels accordingly.
- Moving Average Length (SMA): SMA length for the moving average (default: 14, minval=1). Higher values make SMA a trend indicator, requiring adjusted MA overbought/oversold levels.
- Pivot Length (Left/Right): Candles for detecting pivot highs/lows in divergence calculations (default: 2, minval=1). Higher values reduce noise but add delay equal to the set value.
- Enable Divergence Detection: Enables divergence detection (default: true).
- Overbought/Oversold Levels: Thresholds for the oscillator (default: 30/-30) and moving average (default: 10/-10). For the moving average, no arrows appear; bands change color from gray to green (oversold) or red (overbought), reinforcing entry signals.
- Signal Type: Select signals to display: "None", "Overbought/Oversold", "Zero Line", "MA Zero Line", "All" (default: "Overbought/Oversold").
- Colors and Gradients: Customize colors for bullish/bearish oscillator, moving average, zero line, overbought/oversold levels, and divergence labels.
- Transparency: Adjust gradient fill transparency (default: 70, minval=0, maxval=100) and band/label transparency (default: 40, minval=0, maxval=100) for consistent visuals.
- Visualizations: Enable/disable moving average, gradients for zero/overbought/oversold levels, and gradient fills.
█ USAGE EXAMPLES
- Momentum Analysis: Observe the MPO Oscillator above 0 for bullish momentum or below 0 for bearish momentum. The SMA, being smoother, reacts slower and can confirm trend direction as a noise filter.
- Reversal Signals: Look for buy triangles when the oscillator crosses oversold upward, especially when the SMA is below the MA oversold threshold and the band turns green. Similarly, seek sell triangles when crossing overbought downward, with the SMA above the MA overbought threshold and the band turning red.
- Using Divergences: Treat bullish (green labels) and bearish (red labels) divergences as reinforcement for other signals, especially near overbought/oversold zones, indicating stronger potential trend reversals.
- Customization: Adjust lookback length, smoothing, and moving average length to specific instruments and timeframes to minimize false signals.
█ USER NOTES
Combine the indicator with tools like Fibonacci levels or pivot points to enhance accuracy.
Test different settings for lookback length, smoothing, and moving average length on your chosen instrument and timeframe to find optimal values.

Volume ClusteringThis Volume Clustering script is a powerful tool for analyzing intraday trading dynamics by combining two key metrics: volume Z-Score and Cumulative Volume Delta (CVD). By categorizing market activity into distinct clusters, it helps you identify high-conviction trading opportunities and understand underlying market pressure.
How It Works
The script operates on a simple, yet effective, premise: it classifies each trading bar based on its statistical significance (volume Z-Score) and buying/selling pressure (CVD).
Volume Z-Score
The volume Z-Score measures how far the current bar's volume is from its average, helping to identify periods of unusually high or low volume. This metric is a powerful way to spot when institutional or large players might be entering the market. A high Z-Score suggests a significant event is taking place, regardless of direction.
Cumulative Volume Delta (CVD)
CVD tracks the net buying and selling pressure across different timeframes. The script uses a lower timeframe (e.g., 1-minute) and anchors it to a higher timeframe (e.g., 1-day) to capture intraday pressure. A positive CVD indicates more buying pressure, while a negative CVD suggests more selling pressure.
Cluster Categories
The script analyzes the confluence of these two metrics to assign a cluster to each bar, providing actionable insights. The clusters are color-coded and labeled to make them easy to interpret:
🟢 High Conviction Bullish: Unusually high volume (high Z-Score) combined with significant buying pressure (high CVD). This cluster suggests strong bullish momentum.
🔴 High Conviction Bearish: Unusually high volume (high Z-Score) coupled with significant selling pressure (low CVD). This cluster suggests strong bearish momentum.
🟡 Low Conviction/Noise: Low to moderate volume and mixed buying/selling pressure. This represents periods of indecision or consolidation, where market noise is more prevalent.
🟣 Other Clusters: The script also identifies other combinations, such as high volume with moderate CVD, or low volume with high CVD, which can provide additional context for understanding market dynamics.
Key Features & Customization
The script offers several customizable settings to tailor the analysis to your specific trading style:
Z-Score Lookback Length: Adjust the lookback period for calculating the average volume. A shorter period focuses on recent volume trends, while a longer period provides a broader context.
CVD Anchor & Lower Timeframe: Define the timeframes used for CVD calculation. You can anchor the analysis to a daily or weekly timeframe while using a lower timeframe (e.g., 1-minute) to capture granular intraday pressure.
High/Low Volume Mode: Toggle between "High Volume" mode (which uses 90th and 10th percentiles for clustering) and "Low Volume" mode (which uses 75th and 25th percentiles). This allows you to choose whether to focus on extreme events or more subtle shifts in market sentiment.

Katz Impact Wave 🚀Overview of the Katz Impact Wave 🚀
The Katz Impact Wave is a momentum oscillator designed to visualize the battle between buyers and sellers. Instead of combining bullish and bearish pressure into a single line, it separates them into two distinct "Impact Waves."
Its primary goal is to generate clear trade signals by identifying when one side gains control, but only when the market has enough volatility to be considered "moving." This built-in filter helps to avoid signals during flat or choppy market conditions.
Indicator Components: Lines & Plots
Impact Waves & Fill
Green Wave (Total Up Impulses): This line represents the cumulative buying pressure. When this line is rising, it indicates that bulls are getting stronger.
Red Wave (Total Down Impulses): This line represents the cumulative selling pressure. When this line is rising, it indicates that bears are getting stronger.
Colored Fill: The shaded area between the two waves provides an at-a-glance view of who is in control.
Lime Fill: Bulls are dominant (Green Wave is above the Red Wave).
Red Fill: Bears are dominant (Red Wave is above the Green Wave).
Background Color
The background color provides crucial context about the market state according to the indicator's logic.
Green Background: The market is in a bullish state (Green Wave is dominant) AND the Rate of Change (ROC) filter confirms the market is actively moving.
Red Background: The market is in a bearish state (Red Wave is dominant) AND the ROC filter confirms the market is actively moving.
Gray Background: The market is considered "not moving" or is in a low-volatility chop. Signals that occur when the background is gray should be viewed with extreme caution or ignored.
Symbols & Pivot Lines
▲ Blue Triangle (Up): This is your long entry signal. It appears on the bar where the Green Wave crosses above the Red Wave while the market is moving.
▼ Orange Triangle (Down): This is your short entry signal. It appears on the bar where the Red Wave crosses above the Green Wave while the market is moving.
Pivot Lines (Solid Green/Red/White Lines): These lines mark confirmed peaks of exhaustion in momentum, not price.
Green Pivot Line: Marks a peak in the Green Wave, signaling buying momentum exhaustion. This can be a warning that the uptrend is losing steam.
Red Pivot Line: Marks a peak in the Red Wave, signaling selling momentum exhaustion. This can be a warning that the downtrend is losing steam.
▼ Yellow Triangle (Compression): This rare signal appears when buying and selling exhaustion pivots happen at the same level. It signifies a point of extreme indecision or equilibrium that often occurs before a major price expansion.
Trading Rules & Strategy
This indicator provides entry signals but does not provide explicit Take Profit or Stop Loss levels. You must use your own risk management rules.
Long Trade Rules
Entry Signal: Wait for a blue ▲ triangle to appear at the top of the indicator panel.
Confirmation: Ensure the background color is green, confirming the market is in a bullish, moving state.
Action: Enter a long (buy) trade at the open of the next candle after the signal appears.
Short Trade Rules
Entry Signal: Wait for an orange ▼ triangle to appear at the bottom of the indicator panel.
Confirmation: Ensure the background color is red, confirming the market is in a bearish, moving state.
Action: Enter a short (sell) trade at the open of the next candle after the signal appears.
Take Profit (TP) & Stop Loss (SL) Ideas
You must develop and test your own exit strategy. Here are some common approaches:
Stop Loss:
Place a stop loss below the most recent significant swing low on the price chart for a long trade, or above the recent swing high for a short trade.
Use an ATR (Average True Range) based stop, such as 2x the ATR value below your entry for a long, to account for market volatility.
Take Profit:
Opposite Signal: The simplest exit is to close your trade when the opposite signal appears (e.g., close a long trade when a short signal ▼ appears).
Momentum Exhaustion: For a long trade, consider taking partial or full profit when a green Pivot Line appears, signaling that buying momentum is peaking.
Fixed Risk/Reward: Use a predetermined risk/reward ratio (e.g., 1:1.5 or 1:2).
Disclaimer
This indicator is a tool for analysis, not a financial advisor or a guaranteed profit system. All trading and investment activities involve substantial risk. You should not risk more than you are prepared to lose. Past performance is not an indication of future results. You are solely responsible for your own trading decisions, risk management, and for backtesting this or any other tool before using it in a live trading environment. This indicator is for educational purposes only.

Katz Exploding PowerBand FilterUnderstanding the Katz Exploding PowerBand Filter (EPBF) v2.4
1. Indicator Overview
The Katz Exploding PowerBand Filter (EPBF) is an advanced technical indicator designed to identify moments of expanding bullish or bearish momentum, often referred to as "power." It operates as a standalone oscillator in a separate pane below the main price chart.
Its primary goal is to measure underlying market strength by calculating custom "Bull" and "Bear" power components. These components are then filtered through a versatile moving average and a dual signal line system to generate clear entry and exit signals. This indicator is not a simple momentum oscillator; it uses a unique calculation based on exponential envelopes of both price and squared price to derive its values.
2. On-Chart Lines and Components
The indicator pane consists of five main lines:
Bullish Component (Thick Green/Blue/Yellow/Gray Line): This is the core of the indicator. It represents the calculated bullish "power" or momentum in the market.
Bright Green: Indicates a strong, active long signal condition.
Blue: Shows the bull component is above the MA filter, but the filter itself is still pointing down—a potential sign of a reversal or weakening downtrend.
Yellow: A warning sign that bullish power is weakening and has fallen below the primary signal lines.
Gray: Represents neutral or insignificant bullish power.
Bearish Component (Thick Red/Purple/Yellow/Gray Line): This line represents the calculated bearish "power" or downward momentum.
Bright Red: Indicates a strong, active short signal condition.
Purple: Shows the bear component is above the MA filter, but the filter itself is still pointing down—a sign of potential trend continuation.
Yellow: A warning sign that bearish power is weakening.
Gray: Represents neutral or insignificant bearish power.
MA Filter (Purple Line): This is the main filter, calculated using the moving average type and length you select in the settings (e.g., HullMA, EMA). The Bull and Bear components are compared against this line to determine the underlying trend bias.
Signal Line 1 (Orange Line): A fast Exponential Moving Average (EMA) of the stronger power component. It acts as the first level of dynamic support or resistance for the power lines.
Signal Line 2 (Lime/Gray Line): A slower EMA that acts as a confirmation filter.
Lime Green: The line turns lime when it is rising and the faster Signal Line 1 is above it, indicating a confirmed bullish trend in momentum.
Gray: Indicates a neutral or bearish momentum trend.
3. On-Chart Symbols and Their Meanings
Various characters are plotted at the bottom of the indicator pane to provide clear, actionable signals.
L (Pre-Long Signal): The first sign of a potential long entry. It appears when the Bullish Component rises and crosses above both signal lines for the first time.
S (Pre-Short Signal): The first sign of a potential short entry. It appears when the Bearish Component rises and crosses above both signal lines for the first time.
▲ (Post-Long Signal): A stronger confirmation for a long entry. It appears with the 'L' signal only if the momentum trend is also confirmed bullish (i.e., the slower Signal Line 2 is lime green).
▼ (Post-Short Signal): A stronger confirmation for a short entry. It appears with the 'S' signal only if the momentum trend is confirmed bullish.
Exit / Take-Profit Symbols:
These symbols appear when a power component crosses below a line, suggesting that momentum is fading and it may be time to take profit.
⚠️ (Exit Signal 1): The Bull/Bear component has crossed below the main MA Filter. This is the first and most sensitive take-profit signal.
☣️ (Exit Signal 2): The Bull/Bear component has crossed below the faster Signal Line 1. This is a moderate take-profit signal.
🚼 (Exit Signal 3): The Bull/Bear component has crossed below the slower Signal Line 2. This is the slowest take-profit signal, suggesting the trend is more definitively exhausted.
4. Trading Strategy and Rules
Long Entry Rules:
Initial Signal: Wait for an L to appear at the bottom of the indicator. This confirms that bullish power is expanding.
Confirmation (Recommended): For a higher-probability trade, wait for a green ▲ symbol to appear. This confirms the underlying momentum trend aligns with the signal.
Entry: Enter a long (buy) position on the opening of the next candle after the signal appears.
Short Entry Rules:
Initial Signal: Wait for an S to appear at the bottom of the indicator. This confirms that bearish power is expanding.
Confirmation (Recommended): For a higher-probability trade, wait for a maroon ▼ symbol to appear. This confirms the underlying momentum trend aligns with the signal.
Entry: Enter a short (sell) position on the opening of the next candle after the signal appears.
Take Profit (TP) Rules:
The indicator provides three levels of take-profit signals. You can choose to exit your entire position or scale out at each level.
For a long trade, exit when you see ⚠️, ☣️, or 🚼 appear below the Bullish Component.
For a short trade, exit when you see ⚠️, ☣️, or 🚼 appear below the Bearish Component.
Stop Loss (SL) Rules:
The indicator does not provide an explicit stop loss. You must use your own risk management rules. Common methods include:
Swing High/Low: For a long position, place your stop loss below the most recent significant swing low on the price chart. For a short position, place it above the most recent swing high.
ATR-Based: Use an Average True Range (ATR) indicator to set a volatility-based stop loss.
Fixed Percentage: Risk a fixed percentage (e.g., 1-2%) of your account on the trade.
5. Disclaimer
This indicator is a tool for technical analysis and should not be considered financial advice. All trading involves significant risk, and past performance is not indicative of future results. The signals generated by this indicator are probabilistic and can result in losing trades. Always use proper risk management, such as setting a stop loss, and never risk more than you are willing to lose. It is recommended to backtest this indicator and use it in conjunction with other forms of analysis before trading with real capital. The indicator should only be used for educational purposes.

Combined Cluster & Market StructureI barrowed code from the Mxwll Price Action Suite script as appreciated the structure in which the script defined structure, however I renamed variables and reduced the original script to define only the outer structure. I added volume and CVD clustering to define ranges and initiation market structures and add the ADX to assist with determining trend strength prior to labeling market structure breaks.
Combined Cluster & Market Structure indicator, a powerful and comprehensive tool for technical analysis. This script integrates two core concepts to provide a holistic view of market dynamics:
Z-Score Clustering & Volume Analysis: The indicator calculates Z-scores for both volume and Cumulative Volume Delta (CVD) to categorize market activity into six distinct clusters:
High-Conviction Bullish/Bearish: Signals of strong directional momentum based on high volume and corresponding CVD.
Effort vs. Result: High volume with moderate CVD, suggesting potential indecision or absorption.
Quiet Accumulation/Distribution: Low-volume periods with strong CVD, often preceding major moves.
Low Conviction/Noise: Represents periods of low market participation and weak signals.
These clusters are visually marked on the chart to provide real-time insight into market sentiment.
Market Structure Mapping: The indicator automatically detects and labels significant structural points to help you navigate price action. It identifies:
Higher Highs (HH) and Lower Lows (LL) to show the primary trend direction.
Breaks of Structure (BoS), indicating trend continuation.
Changes of Character (CHoCH), signaling a potential trend reversal.
Additionally, the script features consolidation box detection, which automatically highlights periods of low-conviction market activity, helping you avoid choppy, sideways markets. An integrated ADX filter ensures that structural breaks are only labeled during periods of strong trend strength, reducing false signals.
I want to thank Mxwll Capital for their contribution to the Combined Cluster & Market Structure indicator.