Spicytrader [BUY and SELL signals + Breakouts + Trendline]
BUY and SELL signals (with alerts)
Support and resistant breakout (with alerts)
Auto trendlines : Bullish and bearish market (with alerts)
100% Compatible with Autoview bot (Buy, Sell, Takeprofit, Stop loss)
TRY IT FOR FREE : spicytrader.com
Search in scripts for "bear"

Fibonacci Retracement (S)-Silver
The Automatic Fib Retracement - Silver -0.24% script indicates the 50-61.8% pullback region.
The lines of the upper and lower pivots, the support and resistance areas are also highlighted.
Customisable Fib Length - Time period over which max and min pivots are chosen.
Offsetfib - Automatically offsets the pivots and sell zone as your entry position
will be some time after the upper and lower pivots are set.
Works well when used in combination with an oscillator which highlights Divergence.
A strategy based off buying the 50-618 with a defined stop loss and target can be the basis of your strategy.
This tool will automatically plot those points but a defined Risk Management strategy will always be needed.
Works best in Bearish trends but will work on all timeframes (Bearish correction in an uptrend also possible).
Previous pivots shown but be careful to identify which of the several pivots you are using.
Start at a larger timeframe and move down. (Entries consistent on several timeframes are golden)
Pivots and retracements are dynamic. Be sure to note your entry and targets.


Stochastique Divergences IndicatorHello,
I made a custom indicator.
Divergences with stochastique and price are really strong signals.
About the indicator
A bullish divergence happens when the stoch K makes a higher low and is depicted by a green triangle up.
A bearish divergence happens when the stoch K makes a lower high and is depicted by a red triangle down.
This script is the base for my next strategy that I should upload soon.
I will grant access (to this script and my others) to people willing to make a small donation.
Here is my BTC address : 19sVQvCDmVfEACq7BiMnWSMqFPZ8qfSQ2K
If you prefer ETH : 0xc8a5d3a63a05db0c2363ea1c08b37a01cce9ebfb
Send me a Private Message with the ID of the transaction
If you want to do some forward testing first, send me a message.
Also check blockchainfiesta.com


wTF50This is a customized trend filter that has several uses:
It helps identify trend direction, either bullish or bearish
It distinguishes between a pullback and a trend reversal
It helps identify areas where traders should stand aside
It highlights areas of consolidation
dTF50This is a customized trend filter that has several uses:
It helps identify trend direction, either bullish or bearish
It distinguishes between a pullback and a trend reversal
It helps identify areas where traders should stand aside
It highlights areas of consolidation
CCI AnalysesThis script analyses the CCI indicator values, showing when a fall in price or a rise in price may happen, or when the CCI is confirming the trend.
The user can personalize:
The period to be used and the range of the CCI bands ( by default)
The slow SMA period to be used and the price percentage variation to react for bullish/bearish
Consecutive number of bullish/bearish in order to consider the CCI as a trend confirmation rather than a price reversal

Crypto Bull/Bear Signal by CryptoTradeSignalsDetermine the sentiment of the market with this indicator. Investors can easily determine whether markets are “bullish” or “bearish”. A great tool for any trader.

OBV divergence hidden and regular on both bearish and bullish.OBV (on balance volume) divergence indicator with hidden and regular signal on both bearish and bullish.

CMYK VRMI◊ Introduction
This script indicates the relative movement of price x volume.
◊ Origin
Based on 'The Relative Momentum Index' by Roger Altman : February, 1993 issue of Technical Analysis of Stocks & Commodities magazine.
While RSI counts up and down days from close to close, the Relative Momentum Index counts up and down days from the close relative to a close x number of days ago.
This results in an RSI that is smoother. The input has been changed to the change of a smoothed close multiplied by a smoothed volume.
The polarity of VRMI indicates bearish/bullish movement.
◊ Adjustments
CMYK color theme applied.
◊ Usage
VRMI indicates the force the market moves with.
◊ Future Prospects
-
◊ ◊ ◊ ◊ ◊ ◊ ◊ ◊ ◊ ◊ ◊ ◊ ◊ ◊ ◊ ◊ ◊ ◊ ◊ ◊ ◊ ◊ ◊ ◊ ◊ ◊ ◊ ◊ ◊ ◊ ◊ ◊ ◊ ◊ ◊ ◊ ◊ ◊ ◊ ◊ ◊ ◊ ◊ ◊ ◊ ◊ ◊ ◊ ◊ ◊ ◊ ◊ ◊ ◊ ◊ ◊ ◊ ◊ ◊ ◊ ◊ ◊ ◊ ◊ ◊ ◊ ◊ ◊ ◊ ◊ ◊ ◊ ◊ ◊ ◊ ◊ ◊ ◊ ◊ ◊ ◊ ◊ ◊ ◊ ◊ ◊ ◊ ◊ ◊ ◊ ◊ ◊ ◊ ◊ ◊ ◊ ◊ ◊ ◊ ◊ ◊ ◊ ◊ ◊ ◊ ◊

CMYK VRMI RAYS ◊ Introduction
Introducing VRMI in this script, an RMI based on price movement and volume, to indicate bullish and bearish trends.
This script marks the background depending on RMI <> VRMI , VRMI polarity and large buy/sell sprees.
◊ Origin
Based on 'The Relative Momentum Index' by Roger Altman : February, 1993 issue of Technical Analysis of Stocks & Commodities magazine.
While RSI counts up and down days from close to close, the Relative Momentum Index counts up and down days from the close relative to a close x number of days ago.
This results in an RSI that is smoother.
In addition VRMI reacts quick, it is used to cut off latency from RMI, and it's polarity indicates the beginning and end of a trend.
Large buy sell sprees and detected in their proportion with an sma on the volume
◊ Adjustments
CMYK color theme applied.
◊ Usage
This indicator can be used to detect trends and mark reversals.
◊ Prospects
◊ ◊ ◊ ◊ ◊ ◊ ◊ ◊ ◊ ◊ ◊ ◊ ◊ ◊ ◊ ◊ ◊ ◊ ◊ ◊ ◊ ◊ ◊ ◊ ◊ ◊ ◊ ◊ ◊ ◊ ◊ ◊ ◊ ◊ ◊ ◊ ◊ ◊ ◊ ◊ ◊ ◊ ◊ ◊ ◊ ◊ ◊ ◊ ◊ ◊ ◊ ◊ ◊ ◊ ◊ ◊ ◊ ◊ ◊ ◊ ◊ ◊ ◊ ◊ ◊ ◊ ◊ ◊ ◊ ◊ ◊ ◊ ◊ ◊ ◊ ◊ ◊ ◊ ◊ ◊ ◊ ◊ ◊ ◊ ◊ ◊ ◊ ◊ ◊ ◊ ◊ ◊ ◊ ◊ ◊ ◊ ◊ ◊ ◊ ◊ ◊ ◊ ◊ ◊ ◊ ◊

Bats Bearish Divergence Detector (BRED-)After the release of BUBD+ here comes BRED- for calling the tops.
6 indicators are tested for the presence of any bearish Divergences and are plotted on chart as soon as they are.
Note - Price can move up after bearish divergence as well so its not foolproof. However multiple bearish divergences signify that bulls are losing power and price might reverse downwards.
Instead of blindly trusting the divergence on this indicator I suggest that you use this as a tracking mechanism instead. Once you spot a bearish divergence here, go to the oscillator that was called by the indicator and see the strength of the divergence involved.
This way you dont have to look at the indicators for divergence all the time, just only when the indicator calls for it. (Note that different timeframes will have different divergences so make sure you watch most of them. Higher timeframes indicate larger potential reversals)
Colour -
MACD- Aqua blue
RSI - Red
Stoch RSI - pink
CCI - Orange
MFI - Teal (Blue)
RVI - Silver
If you want to change the number of indicators you can do so from the bottom and remove the indicators you dont want to see by commenting them out.


Bullish and Bearish Engulfing Patterns auto detectionThis simple indicator detects automatically most important bullish and bearish candlestick patterns formations. Used to locate potential supply and demand imbalances.
Copyright 2017 Alfonso Moreno www.set-and-forget.com


RSI in Bull and Bear Market V2.0RSI oversold at 60/40 in bullish market
And Overbought at 40/60 in Bearish market
for more info of this Strategy

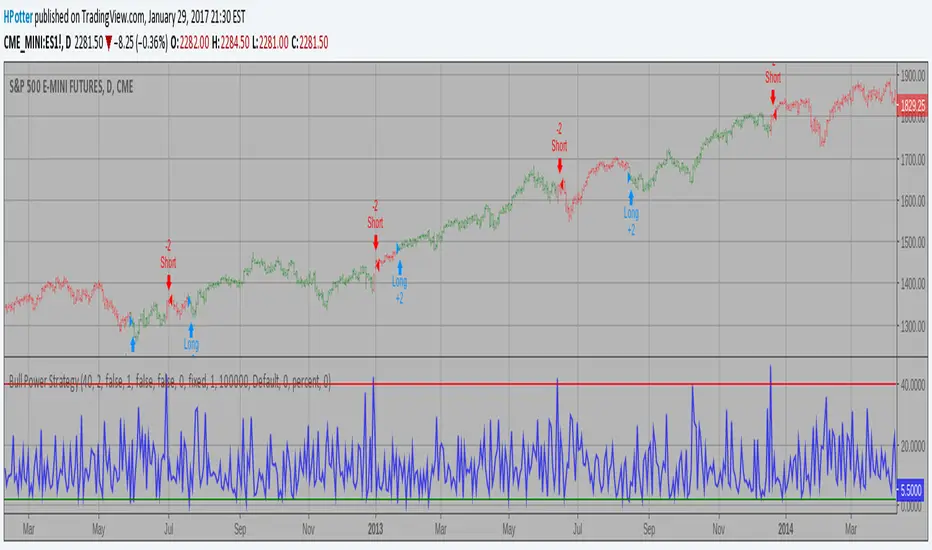
Bull Power Strategy Backtest Bull Power Indicator
To get more information please see "Bull And Bear Balance Indicator"
by Vadim Gimelfarb.
1337 VolumeThis volume indicator gives you a unique perspective and ability to analyze volume in any market. The upper line that is always >=0 represents average up volume over a user definable period while the lower line that is always <= 0 represents the average down volume over a user definable period.
green == bullish candle but volume lower than average
lime == bullish candle with above average volume
crimson == bearish candle with below average volume
red == bearish candle with above average volume
This indicator is very useful for spotting bottoms / tops (do a visual backtest and observe its behavior) as well as entry opportunities.
By default, the lookback period for average volume is 7, but I encourage you to change this value in order to find settings that work best for your particular market.
If you have any feedback or ideas for improvement, please comment.
Enjoy :D
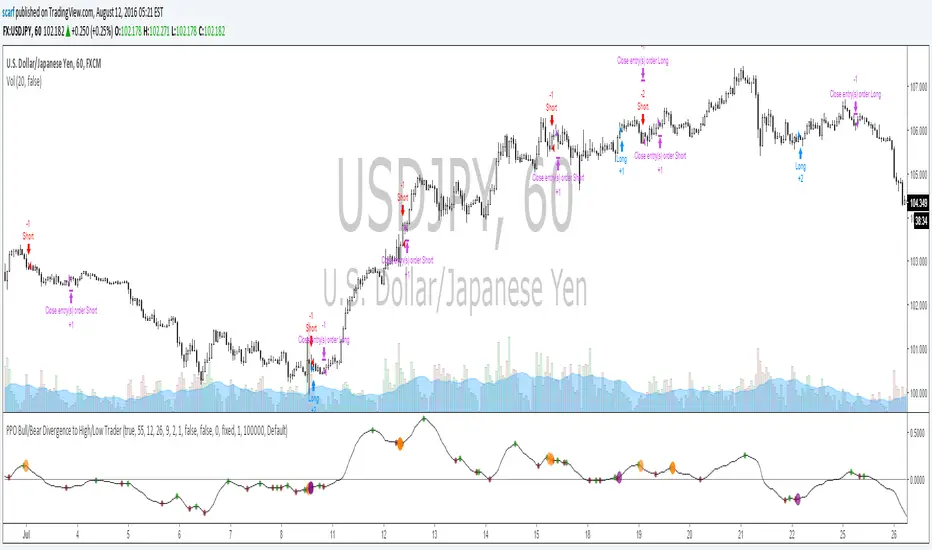
PPO Bull/Bear Divergence to High/Low StrategyA simple strategy that uses the PPO divergences to open trades and the highs/lows to close them. Credit to Pekipek for this PPO Divergence indicator (I changed the visuals a bit)
STRATEGY
Purple circle - bullish divergence - enter LONG
Orange circle - bearish divergence - enter SHORT
Green dot - high point - exit LONG
Red dot - low point - exit SHORT
That's it. Not very profitable, but I like Pekipek's indicator a lot so figured I'd see what a strategy was like. Would love to see any variations.

Super Envolvente (Bullish y Bearish)Identificador de Super-envolventes (SE), se encarga de darle un color verde a la SE alzista (Bullish) verde y rojo a la bajista (Bearish).

[NM]Improved Linear Regression Bull and Bear Power v02Hi guys, I'm back with a little improvement on the Bull and Bear Signal I published just last week thanks to some feedback I received from a couple of users, which is of course highly appreciated.
Here are the changes that have been implemented compared to v01 :
(version 1 is the top indicator, version 2 is the bottom one) in the chart above
Formula adapted to calculate the signal if no data is available for either bull or bear
Added the possibility to smoothen the signal using Arnaud Legroux Moving Average (the benefit of this is that it does not add any lag to the signal)
Zero line was added
If you have any further ideas on how to improve the indicator or if you are happy with it and want to share your settings or rules of engagement, please feel free to share them below.
Oh, and don't forget to click that like button ! :)
