FxAST Bull Bear Power 62 [ALLDYN]I thought I would create something based on what I use in my trading style around Volume Price Analysis and Fibonacci trading.
This tool combines the work of Dr. Alexander Elder (The Elder Ray Index) and the original work done by Rob Booker (The Power of 62).
Basics of the Elder Ray Index: The Elder Ray Index uses indicators to measure buying and selling pressure within a given instrument. The default is what Dr. Alexander used in his trading the 26-period EMA. Technical traders use this information to help determine the direction of a trend. If there is strong bullish pressure, then traders would consider long positions. If there is strong bearish pressure, then traders would consider short positions.
This Tool: My tool gives the bullish and bearish volume as a histogram. The stronger the movement, the longer the histogram bars will be and vice versa as volume pressure weakens. This information allows us to spot divergence with what is happening between the tool and the price action chart. Spotting divergence allows us to wait until we see convergence (things matching the tool and the price action chart) and give us the added confluence we need to consider entering a trade.
Basics of Power Of 62: This system uses 3 Fibonacci EMAs (5-13-62). The 5 is the closest to price action, the 13 is based on the work that Dr. Alexander did measuring bull and bear pressure, and the 62 is based on the .618 or phi of the Fibonacci sequence. Technical traders can use these to gauge trend strength and momentum. For example, 5-13 trending towards the 62 indicates that the market is bullish with a strong bullish confirmation of the 13 crossing above the 62. Conversely, the opposite is valid for a bearish movement and strong confirmation.
This Tool: My tool shows when the 5 crosses the 13 by a visual blue dot. All this indicates is that associated price action is above/below the 13 EMA which if you remember the basics of the Elder Ray index if associated price action is above the 13 indicates the Bulls are in control and if associated price action is below the 13 indicates the Bears are in control. Where these are in relationship to the 62 (above/below) is a strong confirmation of the trend itself. Consider the slope of the lines and the clock analogy. If the lines are between the 1-2 then this is a strong bullish trend. If the lines are between the 4-5 then this is a strong bearish trend. If the lines are flat/horizontal, this indicates price equilibrium and indecision in the market.
Putting it All Together: Combining these concepts allows technical traders to trade with the trend, allowing both systems to give symbiotic confirmations for buying and selling ideas, for example. If we see that the histogram bars are sloping in one direction (above/below 0 line) and we get a cross of the 5-13 trending towards the 62, we can then wait until both cross above/below the 62 AND the histogram is showing bullish/bearish histogram bars above/below the 0 line. Everything above 0 line = Strong Bullish Confirmation, and everything below 0 line = Strong Bearish Confirmation.
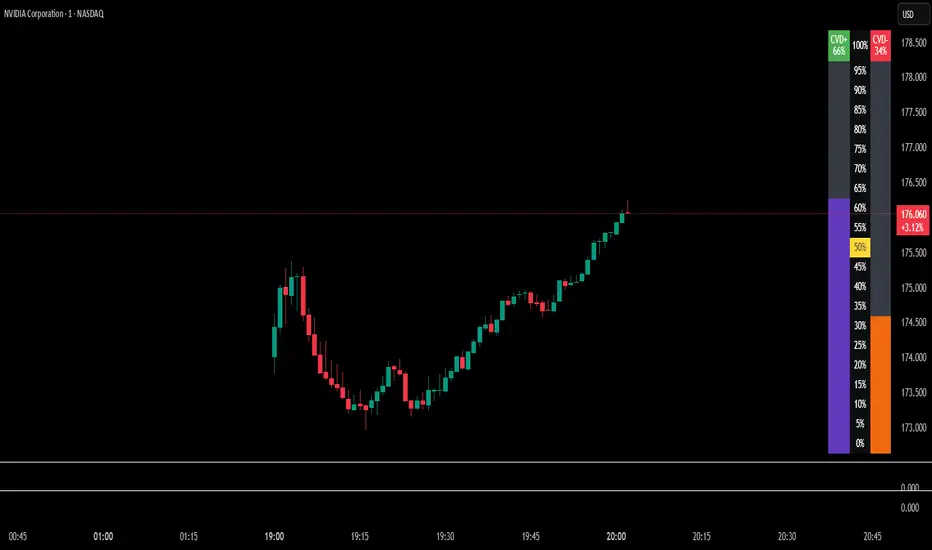
I like to use this with the MACD (Chris Moody's) or the RSI/Stochastic/ADX. On the chart above you can see that Tradingviews default VOT (Volume Over Time) indicator is applied to the chart with the MA option checked.
5 = green line
13 = red line
62 = purple line
Search in scripts for "bear"

[astropark] Volume AnalyzerDear Followers,
today another awesome Analysis Tool, that you can use for day scalping: Volume Analyzer !
This indicator
works on every market, pair and timeframe
lets you see analysis of a different timeframes using the resolution parameter
has an optional trend colored background (I suggest to disable it if you use a different resolution)
integrates a tape profit strategy based on RSI (you can config it and enable/disable it)
lets you setup alarms on bull/bear signal as well as on TP RSI-based signals
I prefer to use this indicator in my day trading on low timeframes , like 5m - 15m - 1h, as you can have access to a more detailed volume information, but it works on high timeframes too as you can see in examples at the bottom of the description.
I truly think that Volume says a lot about future price action, as stated in my Cumulative Volume Delta (CVD) indicator, which you can find here below:
In this indicator, I'm much more interested in the bullish or bearish effect of volume generated by traders and following price action.
Be sure to understand that at current status this is not a complete automated strategy, but an analysis tool which aims to give you a positive bias, a profitable hedge in your trading journey.
As I always say, all tools are great if you use them correctly: this is not the "Holy Grail", so always use proper money and risk management strategies.
This indicator quite often calls bottoms and tops , most of the times it announces a coming reversals , sometimes it fails too of course.
Check this screenshot to have a clear idea of what I'm talking about:
You are supposed to discard signals of the same type that comes later and at a worse price (related to the trend) or you can use to re-fill your still-open position, using it as a re-entry.
You are supposed to act at first signals and average up/down if price goes against you when a new bear/bull signal appears at a better price.
Here it is another element you must consider: price action can deny a reversal stated by volume analysis .
In these cases, you must apply a stop loss in your trade and reverse your position. Don't average up/down your entry.
The reason in this screenshot below:
As you can see, the local downtrend was broken, as it was a simple pullback, previous bull trend was restored and price went up a lot!
The indicator here detected bears rejecting the run-up as much violently as they could, but that was a pullback, nothing more than that: main bull trend was still intact.
Another important advice: don't be greedy, always remember to take profits ! Avoid turning a winning trade into a losing one, which is a common mistake traders do.
That's why I decided to include an RSI based Take Profit algorithm inside:
when background is colored by green (and you can't see any bull signal), then you are in over bought region: start taking profits on you buy/long position or close it or set a trailing stop or a stop loss in profit!
when background is colored by red (and you can't see any bear signal), then you are in over sold region: start taking profits on you sell/short position or close it or set a trailing stop or a stop loss in profit!
when price is in a big overbought or oversold region, then you can see a "ob" label or a "os" label respectively
if you are in a bullish trend (you can see it from the trend colored green background as last signal was a "bull" one), "ob" becomes a clear "tp" - Take Profit advice
if you are in a bearish trend (you can see it from the trend colored red background as last signal was a "bear" one), "os" becomes a clear "tp" - Take Profit advice
Here some examples how you can use the signals produced by the indicator in order to be a successful trader.
I circled with pink signals you as supposed to take, then with a "$" pink backgrounded region where you are supposed to take profits, I finally put an X on failing signals, where you would theoretically have been stopped-out.
GBPUSD, 15m
ETHUSD, 1h
TSLA, 5m
BTCUSD, 15m
XAGUSD, 1h
EURUSD, 15m
SPX500, 1h
ETHUSD, 1D
ETHBTC, 6h
This is a premium indicator , so send me a private message in order to get access to this script.

Traders Dynamic Index(RSI) w/ Bull&Bear Control ZonesMomentum (RSI) is one of the most commonly used indicators for trading, but the vast majority of traders who use it, simply apply it as an oscillator to measure overbought and oversold conditions. However, momentum is much more complex than that and using a basic RSI fails to highlight these complexities.
What this highlights are some of the areas/zones that many people may not even know about or are unaware what the RSI can actually reveal about a particular trend.
What this indicator is showing:
Fast moving RSI (Green) - 1 period
Slow moving RSI (Red) - 9 period
Bollinger Bands
Relative Strength: 1 - 100
Bearish Control Zone: 30(Below) - 45
Bullish Control Zone: 60 - 70 (Above)
How this identifies trends:
Bear Market(Bearish Control Zone):
-Support: 20(Below) - 30
-Resistance: 55 - 65
-Momentum will test resistance but will fail to hold support at 50
Bull Market(Bullish Control Zone):
-Support: 45 - 50
-Resistance: 80 - 90(Above)
-Momentum will test support but will not continue past the 45 support
How this identifies reversals:
If a market is bullish, but loses support at 45 and tests 30, it has begun reversal. If a market is bearish, but breaks 60 and tests 70, it has begun reversal.
-A bull market reversal is confirmed if it finds resistance at 60 after testing bearish support
-A bear market reversal is confirmed if it finds support at 50 after testing bullish resistance
Slow & Fast RSI w/ Boll Bands:
-The Slow and Fast RSI crossovers will act as Intermediate trends within the Macro trend - Fast crosses slow, bullish. Slow cross fast, bearish.
-Use in confluence with the Macro trend.
-While under Bearish Control, the Slow RSI will act as resistance for the Fast RSI.
-While under Bullish Control, the Slow RSI will act as support for the Fast RSI.
-The two will have an impulsive crossover when the Macro trend reverses.
-The Bollinger Bands will act as a volatility gauge for potential approaching tests of Support & Resistances. (Expansions & Contractions)
This is an analog of TDIGM (GoldMinds)
-Added Bullish/Bearish Control Zones.
-Changed Fast RSI to Green and Slow RSI to Red.

Candlestick Patterns by Dipak V2I am really excited to publish my work, I know its at the beginning but there is a lot to come in the future. I am writing a script to identify the candlestick patterns. In this version, I have added Hammer and Hanging Man Pattern in the first version, I know its less but its a beginning, I will keep adding the new information in my script in upcoming versions.
This script is for only learning purpose and not for treading realtime. In this script, it only identifies the pattern and does not check for its confirmation or does not provide any stop-loss, Also it does not check the prior trend before the pattern. These things really matter in the live trade. But in future, I am planning to add these things.
If you like my work, please like or comment your ideas I will try to include those in upcoming versions.
Hanging Man:
Hanging man is a bearish reversal candlestick pattern that signals about the uptrend or advancing phase are over and bulls have lost their control. Color of the candle is not important.
Identity:
1) Comes after a significant up rally or uptrend or advancing phase.
2) Small real body at the top.
3) Long lower shadow at least twice the real body.
4) Very small or no upper shadow.
Confirmation:
Immediate next candle’s close should be below the hanging man’s real body.
StopLoss:
There is a potential resistance level above the top of the hanging man. Stoploss should be above the resistance area or at the high of the hanging man.
Hammer:
Hammer is a bullish reversal candlestick pattern that signals about the downtrend or declining phase are over and bears have lost their control. Color of the candle is not important.
Identity:
1) Comes after significant down rally or downtrend or declining phase.
2) Small real body at the top.
3) Long lower shadow at least twice the real body.
4) Very small or no upper shadow.
Confirmation:
Immediate next candle’s close should be above the hammer’s low.
StopLoss:
There is a potential support level below the low of the hammer. Stoploss should be below the support area or at the low of the hammer.
Note: The candle is the same for Hanging Man and Hammer , Difference is where they appear in the uptrend or in the downtrend that makes the real difference.

Probability: Bull/Bear Dominance | Ratio | Bar CountIntro
What's the probability of the next bar being red? How about green? Well, there are many ways to quantify the probability but I am presenting just one stupidly simple (but generally accurate) way to measure it.
Strangely... no one has done this before that I can find. I try to check if someone else has done it first (Pro Tip: Plz do this. We honestly don't need the 5 trillionth "MTF MAs" script.)
Indicator
Its a basic counting script, but the nice thing about this script is you choose the time range. It starts counting from a specified point of your choosing. It counts up the bull bars and bear bars separately.
Bull Bar = Close > Open
Bear Bar = Open > Close
You can look at them in sum or as a ratio of Green Bars : Red Bars
I know, it's almost too simple. But, here's some interesting food for thought from a layman to fellow laymen.
Analysis/Edge
Between the time of candle open and candle close, the price can do one of three things, close higher, close lower, or close equal to.
'Equal to' is rare on higher timeframes in liquid markets and it provides no useful information. Thus, we'll nix it for purposes of this conversation.
So boil it down. The next candle is going to be a red candle or a green candle.
It is popular to refer to the general probability of most candles as 50/50, with trader's mission in life being to seek an edge that tilts the probabilities slightly in their favor.
The truth is the odds are probably never actually 50/50, but knowing the precisely correct probability is unknowable, just like the accuracy of a weather forecast is inherently unknowable. What we're trying to do as traders is develop systems that give us predictive probabilistic outcomes that correspond with future realities based on various ways of measuring the market (most often heavily dependent on the past).
The reality is that the market can be measured in many, many different ways. The important thing is that you measure it in a way that is accurate, relevant, and universally applicable.
So look at this indicator here:
You start from a point in time on a chosen timeframe and you put red bars in the red column, green in the green column, and count them all up.
Then you make a ratio, in this case, Green : Red.
What the ratio shows you is the percentage of green bars compared to red bars . At the time of this screenshot, the 4h on the SPX starting from the 2020 bottom is showing a ratio of 1.2.
This means there have been 20% more green bars than there have been red bars.
Now there are 1,000 directions you can take this discussion. What is the overall volatility picture, the size of the red bars vs the green bars, what happens if you miss out on the 5 biggest green bars... so many more variables that you would need to take into account to develop a true edge from this idea. But, the bottom line fact (which is what I like about this) is that we can take this data and say with a certain level of confidence that on the SPX you have a 20% better shot at making money (otherwise stated there's a 60/40 chance) if you open a LONG trade at the beginning of a 4h candle than if you open a short.
That's useful information. One could argue that it's not a complete strategy in and of itself (although I bet it could be with a couple of additional parameters). But I can tell you, based on the 4h candles in the 2020 rally if you open a short, the deck is stacked against you from this perspective. And we can actually somewhat demonstrate this to be true for our dataset because we can look at the price history and see who likely made more money. The SPX is up 1000pts off the bottom. So, thus far, for this dataset, it rings true; Bulls have been doing way better in the latter part of 2020 than the bears.
Conclusion
Predictive systems with a small number of variables tend to be more robust than a system with many variables when applied to a complex system. I may keep updating this script if people like it and determine aspects like population vs sample size, confidence intervals, volatility, and exclusion of outliers. For now, this is just an opening foray into the basic idea of how we can establish an edge in the markets. It really can be this simple.
Thanks for Reading.

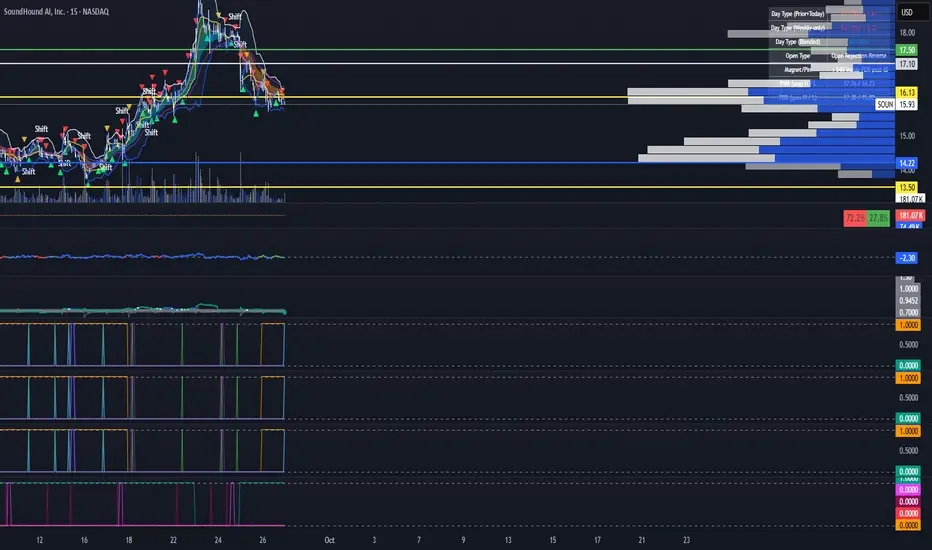
Divergence FinderHello Fellow Traders!
Divergence Finder is a custom script built upon request from a PRO user to help find Divergences & Hidden Divergences using OBVM & Fractal Levels of Support and Resistance along with visuals and alerts. This script also only looks at the divergences that happen with the greater macro trend, meaning price is trending above the 200 EMA of the current period.
Features
----------------------
Custom Alerts are built into the script for manual or automatic trading.
Multiple MA's to show overall trend and EMA supports for manual traders
Custom icons to indicate BULL, BEAR, HIDDEN BEAR, HIDDEN BULL --> the ghost emoji means hidden
Alerts Added for every point
Visual Entry & Exit Points for each level
Visual Trend Bands
You can get access to any of my scripts by visiting my website below , all links are down below in my signature!

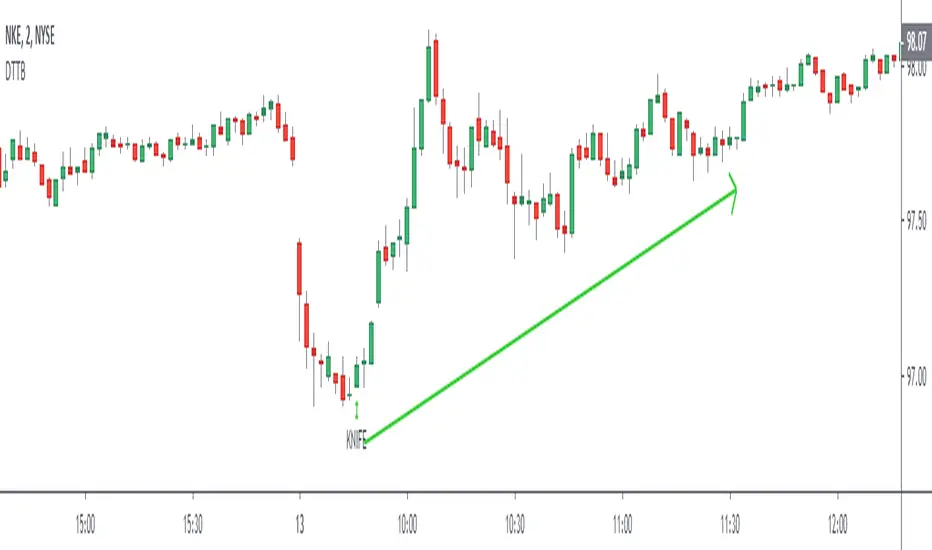
Death To The BearAre you a bear ? RUN!! RUN!! Your life is short here!
Dear friends, I bring you this indicator that you will like, no complexity, just buy signals.
We will try to find possible turning areas, and you will have 6 weapons to use.
Look at the simple configuration:
- BOMB
- KNIFE
- DYNAMITE
- DAGGER
- GUN
- CHEMICAL
- Minimum Level
let's start...
BOMB = high probability of turning
strong bearish trend bombs? it doesn't matter .. does it reach you a 3: 1 ratio? You can make a quick play.
KNIFE = a little more confirmation and excellent weapon to average positions
DYNAMITE = excellent weapon to massively dynamite low areas and also solitary dynamites
DAGGER = excellent weapon to average price
GUN = good shots for patient people who want to average price and look for a more extensive movement
CHEMICAL = I really like this to average the price while I have a nice drink
Minimum Level = you can modify this variable, negative values look for more depth in the market but you will have less signals, positive values look for less depth in the market but you will have more signals, by default = 0
Very simple, without complications!!
aaaa .... but can I activate several weapons at once? of course BOOOOOOMMMM .... poor bears !!!
Anything else? Yes of course....
- All alerts ready to use
LISTEN TO ME ... ADD THE INDICATOR, TAKE YOUR TIME, TEST DIFFERENT CONFIGURATIONS, TEST DIFFERENT TIME FRAMES, TEST DIFFERENT ACTIVE, SEARCH AND FIND, PATIENCE ...... OK READY?
WE WILL MAKE MONEY AND KILL OUR DEAR BEARS!
APPLY A GOOD RISK MANAGEMENT.
NOTE: GOOD INSTRUMENT DATA WITH REAL VOLUME IS REQUIRED
thumbs up!!!!
BTC Precognition - Mtrl_ScientistHello Everyone,
I have been interested in algorithmic trading for a while now, and have picked up coding in Python/C++ 2 years ago, which made it possible for me to understand Pine Script (Trading View's proprietary language) fairly easily. I got interested in Bitcoin in 2013, but have only started actually investing in mid 2017. Making money during a bull run is easy but it's really the bear market that teaches you a lesson. So I went about and tried to avoid losses in future bear markets by digging into the analysis of financial time series. I looked around and found useful books, examples of pine script code, technical analyses from fellow chartists and sought out to combine it all into algorithms that can help prevent losses during the next bear market.
I came up with several profitable scripts, but let this be the first one I'm actually sharing with you guys. It draws data from all major Bitcoin exchanges (Hence this script will ONLY work for BTCUSD ) and is based on CVI, Fractal Adaptive Moving Avergage ( FRAMA ), and some calculus operations to make sense of their relationship.
I tried to tidy the final version up as much as possible, so that it becomes straightforward to use. All you need to look at is when the bar becomes green/red, the bar height is just the integrated area since it's crossed the 0-line and can serve as a threshold on lower time frames to avoid noise.
I've got a degree in Chemistry, so don't take this as financial advice, but please do let me know what you think!
Note:
- This is a re-upload because the first version got pulled due to linking to Twitter
- Script works best with Hekin Ashi candles
Planned features:
- Reduce amount of signals on lower time frames
- Make it work better with normal candles
Suggestions?

Oscillator Divergence HistogramIdentify Divergences on 6 oscillators simultaneously.
From the bottom up.
0 to 1 (black): MACD
1 to 2 (green): Elders Force Index
2 to 3 (blue): RSI
3 to 4 (purple): Awesome Oscillator
4 to 5 (red): Commodity channel index
5 to 6 (orange): Stochastic
You can change the identification of the divergence in the settings and use the Oscillator Divergences indicator to visually see them when testing.
This detects the following divergences between price and the oscillator.
Regular Bullish Divergence: Price lower low | Oscillator higher low
Regular Bearish Divergence: Price higher high | Oscillator lower high
Hidden Bullish Divergence: Price higher low | Oscillator lower low
Hidden Bearish Divergence: Price lower high | Oscillator higher high
Early warning alert system. This identifies a developing divergence and can be used to set alerts.
Colors
Bearish: Maroon
Bullish: Green
Hidden Bearish: Light brown
Hidden Bullish: Light green
Developing early warning are lighter shades of the above.

Bull/Bear CandleThis script will display a small triangle under the latest two candles to indicate whether that candle is bullish or bearish based on the following definition.
A bullish candle closes in the top portion of the trading range of the candle while a bearish candle closes in the bottom portion of the trading range of the candle.
The cutoff is currently set at 65% (you can adjust it) so the close must be outside or equal to 65% of the trading range to be considered bullish or bearish. If less than 65% the triangle will indicate a neutral candle.
Colours are;
green triangle = bullish candle
red triangle = bearish candle
yellow triangle = neutral candle
I hope this helps those using TraderCobb's cradle strategy.
Daily SMA Gate (Bear) + HS(15m & 1H RS) + Daily Upper BBDaily SMA Bear Gate + HS (15m/1H) – Early Signal + Daily Upper BB
Purpose: a “sell the rip” scanner/indicator that looks for early right-shoulder completion of a standard Head & Shoulders (HS) on intraday charts (15m & 1H), but only when the daily context is bearish. Optional daily Upper Bollinger proximity lets you focus on rallies into resistance.
How it works
1) Daily Bear Gate (trend filter)
Uses the Daily timeframe.
Gate is true when:
Price is below the Daily SMA(50), and
Price is within X% of the Daily SMA(20) (configurable).
Option to use the prior completed daily bar only (no intraday bleed).
2) HS right-shoulder detector (early) on intraday
Runs on 15m and 1H via request.security.
Detects a standard HS using swing pivots:
Ordered pivots H1 (left shoulder), H2 higher high (head), H3 (right shoulder).
Right shoulder must be lower than the head and near H1 (ATR- or %-based tolerance).
Neckline is required: lowest swing-low strictly between H1 and H3.
Minimum bar separation between shoulders/head is configurable.
Signals fire as the right-shoulder pivot confirms (on the bar that completes R bars to the right of the pivot).
3) Daily Upper Bollinger filter (optional)
Daily basis = SMA(20); band = SMA(20) + k·σ (k default 1.0).
Prints 1 when Daily Close is within Y% of the upper band.
Useful to isolate “overbought rally into resistance” conditions.
Plots / Screener columns
Combined HS Signal (15m OR 1H RS) – red (1 when Bear Gate is true and either TF confirms HS RS).
HS(15m Early) – maroon.
HS(1H Early) – fuchsia.
Daily SMA Bear Gate Only – orange (1 when below SMA50 and near SMA20).
Daily Upper Bollinger (within %) – teal (1 when within your % threshold of the upper band).
(Each line is 1 when true, 0 otherwise, so it works well in the Pine Screener.)
Inputs
Daily
SMA(50), SMA(20) lengths
“Within % of Daily SMA(20)”
“Use prior completed Daily bar only”
Bollinger
“Daily BB stdev (above SMA20)” (k)
“Within % of Daily Upper BB”
Pattern (HS)
Pivot L / R (pivot windows)
Min separation bars (H1–H2 and H2–H3)
Tolerance mode: ATR×mult or % of H1
How to use
Scan the watchlist with:
Daily SMA Bear Gate Only = 1, and
Daily Upper Bollinger (within %) = 1 (optional), and/or
Combined HS Signal (15m OR 1H) = 1 for entries.
Open the chart and inspect structure:
Confirm broader downtrend (below Daily 50-SMA).
Check that the right shoulder formed near the left shoulder and that a neckline exists between H1–H3.
Plan execution around your rules:
Many traders use the neckline or RS high for risk, and the neckline break/close for confirmation.
Notes & limitations
Pivot functions confirm only after R bars; before that, a potential pivot can disappear. Signals appear on confirmation (this is by design for “early RS” but avoids premature alerts).
Signals are timeframe-mixed: Daily for filters, 15m/1H for HS. Different markets/timeframes can produce different densities—tune L/R and tolerances to your instrument.
This is a discretionary tool, not financial advice. Always validate with your risk management and broader context (volume, higher-TF levels, news, etc.).
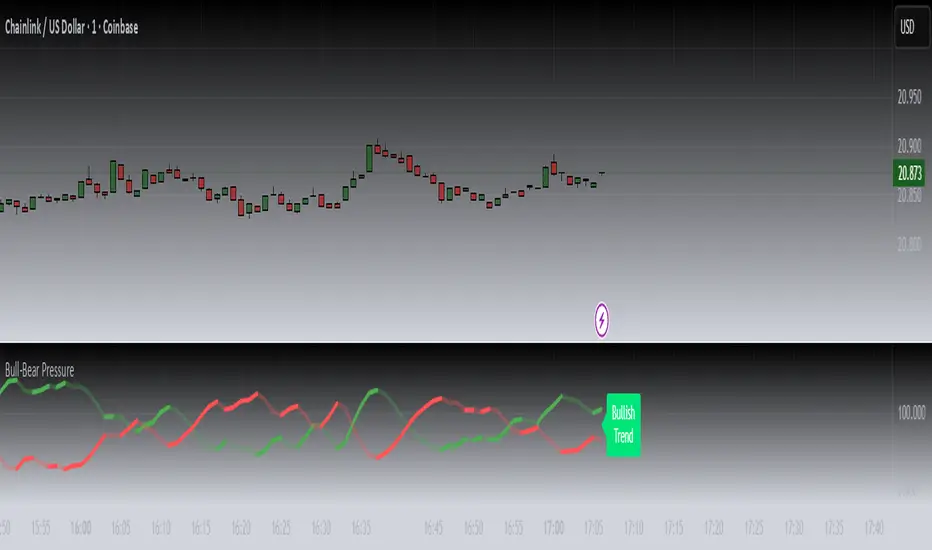
Bull-Bear PressureBULL-BEAR PRESSURE
Uniqueness
Bull-Bear Pressure measures the live tug-of-war between bullish and bearish momentum by transforming internal engine data into a visual gauge of market pressure.
How It Works
The indicator processes dual data feeds — one representing bullish pressure and the other bearish pressure. These values update in real time showing how pressure dynamics are currently distributed and highlighting areas where momentum dynamics may be adjusting.
Usefulness
By monitoring pressure dynamics, traders gain context on whether moves are supported by strong participation or fading momentum. It adds depth to directional bias especially when viewing multiple timeframe charts side by side.
How to Use It
Overlay Bull-Bear Pressure on your chart and compare shifts in bullish vs bearish strength. Use it underneath multi-timeframe or forecast-style indicators for added context.
Disclaimer
This indicator produces visual and informational outputs only. It does not generate trade signals, entry/exit rules, or backtestable strategies. The tool is intended purely as an educational resource to help users interpret market behavior. It does not constitute financial advice, and past performance does not guarantee future results. Trading involves risk, and you may lose some or all of your investment.
Release Notes:
v1.0 (Initial Release)
Bull/Bear Thermometer - GSK-VIZAG-AP-INDIABull/Bear Thermometer - GSK-VIZAG-AP-INDIA
Overview
The Bull/Bear Thermometer is a visual volume-based indicator designed to gauge the cumulative buying (bullish) and selling (bearish) pressure over customization time intervals on any chart. It uses Cumulative Volume Delta (CVD) to track buying and selling dominance and visually represents this data as vertical bar meters with percentage scales.
Key Features
Multi-Time frame Accumulation: Allows users to select accumulation intervals - Daily, Weekly, or Monthly - adapting to their trading style and time frame.
Cumulative Volume Delta (CVD) Computation: Calculates the net buying and selling volume by comparing volume on bullish and bearish bars to measure market strength.
Visual Thermometer Display: Presents buying (CVD+) and selling (CVD-) dominance in colorful vertical bars on an easy-to-read table overlay on the price chart.
Percentage Scale with Highlights: Includes a percentage scale from 0% to 100%, highlighting the important 50% benchmark with a yellow line for quick reference.
Clear Color Coding: Uses green and red color schemes to represent bullish and bearish pressure, with distinctive numeric labels.
Customization Reset Points: Weekly reset day and Monthly reset date options ensure the accumulation aligns with user preference or trading strategy cycles.
Inputs and Usage
Select Time frame: Choose how the buying/selling volume is accumulated — Daily, Weekly (reset day configurable), or Monthly (reset date configurable).
Volume-Based Signals: Monitor changes in buying and selling pressure levels as the market tides shift.
Table Display: A table positioned at the bottom right corner overlays the price chart showing percentage bars for both buying and selling dominance.
Ideal for: Day traders, swing traders, and volume-focused market analysts who want a quick visual summary of market sentiment.
How It Works
The indicator tracks volume on each bar, assigning positive or negative values depending on whether the bar closes higher or lower than the previous.
It accumulates these values over the selected time frame to calculate the cumulative buying (green) and selling (red) volumes.
The data is then converted to percentages and mapped as vertical colored bars in the table.
The midpoint (50%) is highlighted with a yellow line, helping traders quickly assess bullish/bearish balance.
Why Use This Indicator?
Simplicity: Easy to interpret visual thermometer of market sentiment.
Customization: Flexible period settings align with different trading styles.
Volume Insight: Goes beyond price action, factoring volume momentum for deeper market understanding.
Non-intrusive Overlay: Displayed neatly on chart without clutter or distraction.
Recommended Pairings
Use alongside price action or trend indicators.
Suitable for equities, futures, forex, and crypto instruments where volume data is reliable.
TRAPPER TRENDLINES — RSIBuilds dynamic RSI trendlines by connecting the two most recent confirmed RSI swing points (highs→highs for resistance, lows→lows for support). Includes optional channel shading for the 30–70 zone, an RSI moving average, clean break alerts, and simple bullish/bearish divergence alerts versus price.
How it works
RSI pivots: A point on RSI is a swing high/low only if it is the most extreme value compared with a set number of bars on the left and the right (the Pivot Lookback).
RSI trendlines:
Resistance connects the last two confirmed RSI swing highs.
Support connects the last two confirmed RSI swing lows.
Lines can be Full Extend (update into the future) or Pivot Only.
Channel block: Optional fill of the 30–70 range for fast visual context.
Alerts:
Breaks of RSI support/resistance trendlines.
Basic bullish/bearish RSI divergences versus price pivots.
Inputs
RSI
RSI Length: Default 14 (standard).
Pivot Lookback: Bars to the left/right required to confirm an RSI swing.
Overbought / Oversold: 70 / 30 by default.
Line Extension: Full Extend or Pivot Only.
Visuals
Show RSI Moving Average / Signal Length: Optional smoothing line on RSI.
RSI/Signal colors: Customize plot colors.
Show 30–70 Channel Block: Toggle the middle-zone fill.
Tint pane background when RSI in channel: Optional subtle background when RSI is between OB/OS.
Divergences & Alerts
Enable RSI TL Break Alerts: Alert conditions for RSI line breaks.
Enable Divergence Alerts: Bullish/Bearish divergence alerts versus price.
Pairing with price for confluence/divergence
For accurate confluence and clearer divergences, align this RSI tool with your price trendline tool (for example, TRAPPER TRENDLINES — PRICE):
Set RSI Pivot Lookback equal to the Pivot Left/Right size used on price.
Example: Price uses Pivot Left = 50 and Pivot Right = 50 → set RSI Pivot Lookback = 50.
Keep RSI Length = 14 and OB/OS = 70/30 unless you have a specific edge.
Interpretation:
Confluence: Price reacts at its trendline while RSI reacts at its own line in the same direction.
Divergence: Price makes a higher high while RSI makes a lower high (bearish), or price makes a lower low while RSI makes a higher low (bullish), using matched pivot windows.
Suggested settings
Higher timeframes (4H / 1D / 1W): Pivot Lookback = 50; optional RSI MA length 14; channel block ON.
Intraday (15m / 30m / 1H): Pivot Lookback = 30; optional RSI MA length 14.
Always mirror your price pivot size to this RSI Pivot Lookback for consistent swings.
Reading the signals
RSI trendline touch/hold: Momentum reacting at structure; look for confluence with price levels.
RSI Trendline Break Up / Down: Momentum shift; consider price structure and retests.
Bullish/Bearish Divergence: Confirm only when pivots are matched and the new swing is confirmed.
Notes & limitations
Pivots require future bars to confirm by design; trendlines update as new swings confirm.
Divergence logic compares RSI pivots to price pivots with the same lookback; mismatched windows can produce false positives.
No strategy entries/exits or performance claims are provided. This is an analytical tool.
Alerts (titles/messages)
RSI: Trendline Break Up — “RSI broke falling resistance line.”
RSI: Trendline Break Down — “RSI broke rising support line.”
RSI: Bullish Divergence — “Bullish RSI divergence confirmed.”
RSI: Bearish Divergence — “Bearish RSI divergence confirmed.”
Quick start
Add the indicator to a separate pane.
Set Pivot Lookback to match your price tool’s pivot size (e.g., 50).
Optionally toggle the RSI MA and Channel Block for clarity.
Enable alerts if you want notifications on RSI line breaks and divergences.
Use with TRAPPER TRENDLINES — PRICE or any price-based trendline tool for confluence/divergence analysis.
Compliance
This script is for educational purposes only and does not constitute financial advice. Trading involves risk. Past performance does not guarantee future results. No performance claims are made.

Greer Gap# Greer Gap Indicator (No mitigation: i.e. removing false signals)
## Summary
The **Greer Gap Indicator** identifies **Fair Value Gaps (FVGs)** and introduces specialized **Greer Bull Gaps (Blue)** and **Greer Bear Gaps (Orange)** to highlight high-probability trading opportunities. Unlike traditional FVG indicators, it avoids hindsight bias by not removing historical gaps based on future price action, ensuring transparency in signal accuracy. Built upon LuxAlgo’s FVG logic, it adds unique filtering: only the first Greer Gap after an opposite gap is plotted if its level (min for Bull, max for Bear) is not higher/lower than the previous Greer Gap of the same type, while all valid gaps are recorded for comparison. Traders can use these gaps as support/resistance or entry signals, customizable via timeframe, look back, and display options.
## Description
This indicator detects and displays **Fair Value Gaps (FVGs)** on the chart, with a focus on specialized **Greer Gaps**:
- **Bullish Gaps (Green)**: Areas where the low of the current candle is above the high of a previous candle (look back period), indicating potential upward momentum.
- **Bearish Gaps (Red)**: Areas where the high of the current candle is below the low of a previous candle, indicating potential downward momentum.
- **Greer Bull Gaps (Blue)**: A bullish gap that is above the latest bearish gap's max. Only the first such gap after a bearish gap is plotted if it meets criteria (not higher than the previous Greer Bull Gap's min), but all valid ones are recorded for comparison.
- **Greer Bear Gaps (Orange)**: A bearish gap that is below the latest bullish gap's min. Only the first such gap after a bullish gap is plotted if it meets criteria (not lower than the previous Greer Bear Gap's max), but all valid ones are recorded.
## How It Works
The script uses a dynamic look back period to detect FVGs. It maintains a record of all detected gaps and applies additional logic for Greer Gaps:
- **Greer Bull Gaps**: Checks if the new bullish gap's min is above the latest bearish gap's max. Plots only if it's the first since the last bearish gap and its min is <= previous Greer Bull min (or first one).
- **Greer Bear Gaps**: Checks if the new bearish gap's max is below the latest bullish gap's min. Plots only if it's the first since the last bullish gap and its max is >= previous Greer Bear max (or first one).
- **Resets**: A new bearish gap resets the Greer Bull Gap flag, and a new bullish gap resets the Greer Bear Gap flag.
## How to Use
- **Timeframe**: Set a higher timeframe (e.g., 'D' for daily) to detect gaps from that timeframe on the current chart.
- **Look back Period**: Adjust to change gap detection sensitivity (default: 34). Use 2 if you want to compare to LuxAlgo
- **Extend**: Controls how far right the gap boxes extend.
- **Show Options**: Toggle visibility of all bullish/bearish gaps or Greer Gaps.
- **Colors**: Customize colors for each gap type.
- **Application**: Use Greer Gaps as potential support/resistance levels or entry signals, but combine with other analysis for confirmation.
## Originality and Credits
This script is inspired by and builds upon the **"Fair Value Gap "** indicator by LuxAlgo (available on TradingView: ()).
**Credits**: Thanks to LuxAlgo for the core FVG detection logic.
**Significant Changes**:
- Added **Greer Bull and Bear Gap** logic for filtered, directional gaps with reset mechanisms.
- Introduced recording of all valid Greer Gaps without plotting all, to compare levels without hindsight bias.
- **No mitigation/removal of gaps**: Unlike LuxAlgo's approach, which mitigates (removes or alters) gaps based on future price action (e.g., when filled), this can create a hindsight bias where incorrect signals disappear over time. If a signal is used for a trade and later removed due to new data, it doesn't reflect real-time performance accurately. The Greer Gap avoids this by using gap comparisons to validate signals without altering historical boxes, ensuring transparency in when signals were right or wrong.

Trendline + Bull/Bear Flag + EMA 9/21 Buy-Sell Signalseasy scalping and buy sell signals on 9-21 ema cross and trendline breakout

✨Smart Option MACD: Bullish, Bearish, Neutral Logic by AKM ✨The **Smart Option MACD: Bullish, Bearish, Neutral Logic by AKM** is an advanced indicator designed for TradingView, tailored for option traders on indices like NIFTY. It automates options trend scanning by applying MACD analysis to both Call (CE) and Put (PE) options near the ATM (At-The-Money) strike, providing actionable market states—Bullish, Bearish, or Neutral—using distinct logic for both strikes and overall market context.
***
### Core Features
- **Option Selection Logic:** The script dynamically calculates ATM, CE, and PE strike prices based on the underlying index spot price and customizable user inputs for expiry, strike distance, and OTM/ITM shift.
- **MACD on Option Prices:** For both CE and PE symbols, the indicator computes the MACD (Moving Average Convergence Divergence) and Signal lines. It uses standard MACD settings: 12-period EMA (fast), 26-period EMA (slow), and 9-period Signal.
- **Strike Status Classification:**
- AZL 🔼: Indicates MACD > 0 for that option, signifying positive momentum.
- BZL 🔽: Indicates MACD 0 & crossover up), PE is bearish (MACD<0 & crossover down).
- **Bearish:** PE is bullish & crossover up, CE is bearish & crossover down.
- **Neutral:** All other scenarios—including mixed or undefined signals.
***
### Table Output
A real-time table is displayed on the chart (top-right) with key option and market details:
- Spot price
- ATM Strike
- CE/PE strike status (momentum + crossover logic)
- Option prices
- Overall market state, color-coded for clarity
***
### How to Use This Indicator
- **Entry Signal:** Use the Bullish/Bearish status for directional trades or option strategies. Bullish calls for buying or selling upward momentum options; Bearish favors downside trades. Neutral advises caution or range-bound trades.
- **Customizability:** Expiry, strike width, OTM/ITM offset, and chart resolution are user-controlled, allowing adaptation to different market contexts.
- **Best Practice:** Use alongside price action, support/resistance zones and other indicators to confirm options momentum, as MACD is powerful yet not infallible.
***
### Who Is It For?
- **Option traders** who want to automate trend/momentum detection for CE/PE strikes instead of manual chart switching.
- **Index traders** (NIFTY, BANKNIFTY...) seeking systematic edge in intraday/positional strategies tied to option momentum.
- **Technical analysts** interested in visual, rule-based signals combining options data and classic MACD logic.
***
The Smart Option MACD indicator streamlines multi-strike, multi-option momentum analysis and presents clear actionable logic directly on your chart for enhanced decision-making. Use it as a core part of your TradingView toolkit for options-focused market views.

FVG-Bully BearsFVG-Bully Bears Indicator
The FVG-Bully Bears indicator is a powerful tool designed to identify Fair Value Gaps (FVGs) on your TradingView charts. FVGs are price gaps that occur when the market moves sharply, leaving areas where little to no trading activity took place. These gaps often act as key support or resistance zones, making them valuable for traders looking to spot potential reversal or continuation points.
This indicator highlights Bullish FVGs (potential support zones) and Bearish FVGs (potential resistance zones) with customizable boxes and labels, helping you visualize these critical price levels with ease.
Features
Bullish and Bearish FVGs: Detects gaps where price has left untested areas, marking bullish (green) and bearish (red) FVGs.
Customizable Display: Choose to show or hide bullish/bearish FVGs, adjust colors, and control box visibility.
FVG Labels: Optional labels on each FVG box to clearly identify bullish or bearish gaps, with adjustable text size.
Delete Filled FVGs: Automatically removes FVGs once price revisits and fills the gap, keeping your chart clean.
Box Extension: Extend FVG boxes into the future (up to 100 bars) to track unfilled gaps over time.
Performance Optimization: Limits the number of displayed FVG boxes (default: 50) to ensure smooth chart performance.
How It Works
Bullish FVG: Identified when the high of a candle two bars ago is lower than the low of the current candle, indicating a sharp upward move.
Bearish FVG: Identified when the low of a candle two bars ago is higher than the high of the current candle, indicating a sharp downward move.
FVGs are drawn as colored boxes (green for bullish, red for bearish) and can include labels for easy identification.
If enabled, filled FVGs (where price revisits the gap) are deleted to reduce chart clutter.
Settings
FVG Settings
Show Bullish FVGs: Enable/disable bullish FVG boxes (default: enabled).
Show Bearish FVGs: Enable/disable bearish FVG boxes (default: enabled).
Bullish FVG Color: Customize the color and transparency of bullish FVG boxes (default: light green).
Bearish FVG Color: Customize the color and transparency of bearish FVG boxes (default: light red).
Max FVG Boxes: Set the maximum number of FVG boxes displayed (default: 50, range: 1–500).
Extend FVG Boxes (Bars): Extend FVG boxes into the future by a specified number of bars (default: 8, range: 0–100).
Show FVG Labels: Enable/disable text labels on FVG boxes (default: enabled).
Label Size: Choose the size of FVG labels (options: Tiny, Small, Normal, Large, Huge; default: Small).
Delete Filled FVGs: Automatically remove FVGs when price fills the gap (default: enabled).
How to Use
Add the FVG-Bully Bears indicator to your TradingView chart.
Customize the settings to match your trading style (e.g., adjust colors, toggle labels, or change box extensions).
Watch for green (bullish) and red (bearish) FVG boxes:
Bullish FVGs: Potential support zones where price may bounce or consolidate.
Bearish FVGs: Potential resistance zones where price may reverse or stall.
Use FVGs in combination with other indicators (e.g., support/resistance, trendlines) for better trade decisions.
If “Delete Filled FVGs” is enabled, filled gaps will disappear, keeping your chart focused on active FVGs.
Ideal For
Swing Traders: Identify key price zones for entries or exits.
Day Traders: Spot intraday support/resistance levels created by rapid price moves.
Price Action Traders: Use FVGs to confirm market structure and potential reversal points.
Notes
For best performance, keep “Max FVG Boxes” at a reasonable value (e.g., 50) to avoid chart lag.
FVGs are most effective on lower timeframes (e.g., 5m, 15m, 1H) but can be used on any timeframe.
Combine with other tools like volume or trend indicators for a complete trading strategy.
Enjoy trading with FVG-Bully Bears and take advantage of Fair Valu

GCM Bull Bear RiderGCM Bull Bear Rider (GCM BBR)
Your Ultimate Trend-Riding Companion
GCM Bull Bear Rider is a comprehensive, all-in-one trend analysis tool designed to eliminate guesswork and provide a crystal-clear view of market direction. By leveraging a highly responsive Jurik Moving Average (JMA), this indicator not only identifies bullish and bearish trends with precision but also tracks their performance in real-time, helping you ride the waves of momentum from start to finish.
Whether you are a scalper, day trader, or swing trader, the GCM BBR adapts to your style, offering a clean, intuitive, and powerful visual guide to the market's pulse.
Key Features
JMA-Powered Trend Lines (UTPL & DTPL): The core of the indicator. A green "Up Trend Period Line" (UTPL) appears when the JMA's slope turns positive (buyers are in control), and a red "Down Trend Period Line" (DTPL) appears when the slope turns negative (sellers are in control). The JMA is used for its low lag and superior smoothing, giving you timely and reliable trend signals.
Live Profit Tracking Labels: This is the standout feature. As soon as a trend period begins, a label appears showing the real-time profit (P:) from the trend's starting price. This label moves with the trend, giving you instant feedback on its performance and helping you make informed trade management decisions.
Historical Performance Analysis: The profit labels remain on the chart for completed trends, allowing you to instantly review past performance. See at a glance which trends were profitable and which were not, aiding in strategy refinement and backtesting.
Automatic Chart Decluttering: To keep your chart clean and focused on significant moves, the indicator automatically removes the historical profit label for any trend that fails to achieve a minimum profit threshold (default is 0.5 points).
Dual-Ribbon Momentum System:
JMA / Short EMA Ribbon: Visualizes short-term momentum. A green fill indicates immediate bullish strength, while a red fill shows bearish pressure.
Short EMA / Long EMA Ribbon: Acts as a long-term trend filter, providing broader market context for your decisions.
"GCM Hunt" Entry Signals: The indicator includes optional pullback entry signals (green and red triangles). These appear when the price pulls back to a key moving average and then recovers in the direction of the primary trend, offering high-probability entry opportunities.
How to Use
Identify the Trend: Look for the appearance of a solid green line (UTPL) for a bullish bias or a solid red line (DTPL) for a bearish bias. Use the wider EMA ribbon for macro trend confirmation.
Time Your Entry: For aggressive entries, you can enter as soon as a new trend line appears. For more conservative entries, wait for a "GCM Hunt" triangle signal, which confirms a successful pullback.
Ride the Trend & Manage Your Trade: The moving profit label (P:) is your guide. As long as the trend line continues and the profit is increasing, you can confidently stay in the trade. A flattening JMA or a decreasing profit value can signal that the trend is losing steam.
Focus Your Strategy: Use the Display Mode setting to switch between "Buyers Only," "Sellers Only," or both. This allows you to completely hide opposing signals and focus solely on long or short opportunities.
Core Settings
Display Mode: The master switch. Choose to see visuals for "Buyers & Sellers," "Buyers Only," or "Sellers Only."
JMA Settings (Length, Phase): Fine-tune the responsiveness of the core JMA engine.
EMA Settings (Long, Short): Adjust the lengths of the moving averages that define the ribbons and "Hunt" signals.
Label Offset (ATR Multiplier): Customize the gap between the trend lines and the profit labels to avoid overlap with candles.
Filters (EMA, RSI, ATR, Strong Candle): Enable or disable various confirmation filters to strengthen the "Hunt" entry signals according to your risk tolerance.
Add the GCM Bull Bear Rider to your chart today and transform the way you see and trade the trend!
ENJOY

Bullish/Bearish Body StrengthThis indicator analyzes candlestick body sizes to measure bullish versus bearish strength over a specified period. Here's what it does:
Features:
- Measures and totals the body sizes of bullish and bearish candles over your chosen lookback period
- Shows the total bullish and bearish body measurements as separate plots
- Calculates and displays a bull/bear ratio (bullish total divided by bearish total)
- Shows the difference between bullish and bearish totals
- Colors the background based on bullish (green) or bearish (red) dominance
- Includes an information table with current values and signals
Customization Options:
- Lookback Period: Set how many bars to analyze (default: 14)
- Normalize by ATR: Option to normalize body sizes by the Average True Range for more consistent measurement across different volatility periods
- Smoothing Period: Apply smoothing to the ratio and difference values
- Display Options: Toggle for showing the bull/bear ratio and bull-bear difference
How to Use:
1. Add the indicator to your chart in TradingView
2. Adjust the lookback period to fit your trading timeframe
3. Watch for:
- When bullish bodies significantly outweigh bearish ones (green dominance)
- When bearish bodies significantly outweigh bullish ones (red dominance)
- Ratio values above 2 (strong bullish signal) or below 0.5 (strong bearish signal)
The indicator provides both visual cues and numerical data to help identify periods of bullish or bearish momentum based on actual price movement rather than just candle count.
Smart Money Index + True Strength IndexThe Smart Money Index + True Strength Index indicator is a combination of two popular technical analysis indicators: the Smart Money Index (SMI) and the True Strength Index (TSI). This combined indicator helps traders identify potential entry points for long and short positions based on signals from both indexes.
Main Components:
Smart Money Index (SMI):
The SMI measures the difference between the closing and opening price of a candle multiplied by the trading volume over a certain period of time. This allows you to assess the activity of large players ("smart money") in the market. If the SMI value is above a certain threshold (smiThreshold), it may indicate a bullish trend, and if lower, it may indicate a bearish trend.
True Strength Index (TSI):
The TSI is an oscillator that measures the strength of a trend by comparing the price change of the current bar with the previous bar. It uses two exponential moving averages (EMAS) to smooth the data. TSI values can fluctuate around zero, with values above the overbought level indicating a possible downward correction, and values below the oversold level signaling a possible upward correction.
Parameters:
SMI Length: Defines the number of candles used to calculate the average SMI value. The default value is 14.
SMI Threshold: A threshold value that is used to determine a buy or sell signal. The default value is 0.
Length of the first TSI smoothing (tsiLength1): The length of the first EMA for calculating TSI. The default value is 25.
Second TSI smoothing length (tsiLength2): The length of the second EMA for additional smoothing of TSI values. The default value is 13.
TSI Overbought level: The level at which the market is considered to be overbought. The default value is 25.
Oversold level TSI: The level at which it is considered that the market is in an oversold state. The default value is -25.
Logic of operation:
SMI calculation:
First, the difference between the closing and opening price of each candle (close - open) is calculated.
This difference is then multiplied by the trading volume.
The resulting product is averaged using a simple moving average (SMA) over a specified period (smiLength).
Calculation of TSI:
The price change relative to the previous bar is calculated (close - close ).
The first EMA with the length tsiLength1 is applied.
Next, a second EMA with a length of tsiLength2 is applied to obtain the final TSI value.
The absolute value of price changes is calculated in the same way, and two emas are also applied.
The final TSI index is calculated as the ratio of these two values multiplied by 100.
Graphical representation:
The SMI and TSI lines are plotted on the graph along with their respective thresholds.
For SMI, the line is drawn in orange, and the threshold level is dotted in gray.
For the TSI, the line is plotted in blue, the overbought and oversold levels are indicated by red and green dotted lines, respectively.
Conditions for buy/sell signals:
A buy (long) signal is generated when:
SMI is greater than the threshold (smi > smiThreshold)
TSI crosses the oversold level from bottom to top (ta.crossover(tsi, oversold)).
A sell (short) signal is generated when:
SMI is less than the threshold (smi < smiThreshold)
TSI crosses the overbought level from top to bottom (ta.crossunder(tsi, overbought)).
Signal display:
When the conditions for a long or short are met, labels labeled "LONG" or "SHORT" appear on the chart.
The label for the long is located under the candle and is colored green, and for the short it is above the candle and is colored red.
Notification generation:
The indicator also supports notifications via the TradingView platform. Notifications are sent when conditions arise for a long or short position.
This combined indicator provides the trader with the opportunity to use both SMI and TSI signals simultaneously, which can improve the accuracy of trading decisions.
Bull Bear Candles with Volume ProfileUser Guide for Bull Bear Candles Indicator with Keltner Channels
Author: NellyN
Introduction
This indicator helps identify potential bullish and bearish trends in the market by analyzing buying and selling volume over two configurable timeframes. It calculates the percentage of buying and selling volume and displays the current market condition based on two moving averages for 2 periods.
Key Features
• Volume Analysis : Calculates Buy and Sell Volume for two configurable timeframes (e.g., 5 min, 15 min, 15 min. and 1 hour, etc.) and displays them as percentages.
• Moving Averages : Uses one Moving Average (MA) for two different time periods to identify trends (uptrend when shorter-term MA is above longer-term MA). You can also choose other Moving Average types like SMA, EMA, WMA, RMA, VWMA, or HMA.
• Colored Candles : Candles are colored green for bullish conditions, red for bearish conditions, and gray for neutral conditions.
• Market Condition Labels : Displays labels in table-view indicating the current market condition based on Buy and Sell Volume (Very Bullish, Very Bearish, Bullish/Bearish Retracement, Chop).
• Alerts: Generates alerts for potential buy and sell signals based on indicator conditions (Note: Enable alerts in the indicator settings).
• Visual Signals: Provides visual signals through colored candles and market condition labels in addition to alerts.
Input Parameters
• Source: Close price (default) or Heikin Ashi
• Timeframe: Select the timeframe for price and volume data used in the indicator (e.g., Daily, Hourly).
• Colored Candles On: Enable (True) or disable (False) coloring candles based on market conditions.
• Enable Alerts: Enable (True) or disable (False) alerts for buy/sell signals.
• Length of MA: Sets the length for the MAs used in trend identification (minimum 1).
• Lookback Period Vol. 1 & 2: Define the timeframes used to calculate buying and selling volume and the MA calculation (e.g., 5 min, 15 min).
Understanding the Outputs
• Cloud Fill: The area between two MAs is filled with a color that reflects the trend (green for uptrend, red for downtrend).
• Table: Shows Buy Volume, Sell Volume, Buy Percentage, Sell Percentage, and the current Market Condition Labels. (If you decide to see them uncomment them from the code simply removing the // in front of the code)
• Colored Candles and Market Condition Labels: Look for green candles and bullish labels for potential buying opportunities, and vice versa for red candles and bearish labels.
Bullish green label appears when short-term MA is above long-term MA AND Buy Volume percentage is greater than 50%.
Red cross for exiting long entry appears when we have bearish volume OR bearish crossover of the MA for the 2 periods.
Bearish red label appears when short-term MA is below long-term MA AND Buy Volume percentage is less than 50%.
Green cross for exiting short entry appears when we have bullish volume OR bullish crossover of the MA for the 2 periods.
• Bullish/Bearish Retracement: The moving averages indicate a potential trend reversal, while the Buy Volume percentage suggests a continuation of the prior trend. The candle color may be green, red, or gray depending on the current price position relative to the moving averages.
• Chop (Gray Candle): The moving averages are flat and the Buy Volume percentage is not significantly above or below 50%.
• Buy/Sell Alerts: The indicator generates alerts based on specific conditions, but these should be used in conjunction with other trading strategies and careful risk management.
Important Notes
• This indicator is for informational purposes only and should not be considered financial advice. Back-test the indicator with historical data to understand its performance before using it for live trading.
• Combine this indicator with other technical analysis tools.

3 Confirmation BearThe "3 Confirmation Bear" indicator is designed to help traders identify strong bearish market conditions with three key confirmations:
Price Below EMA15:
The price trading below the 15-period Exponential Moving Average (EMA) signals bearish momentum.
RSI Below a Threshold:
The Relative Strength Index (RSI) is below a user-defined threshold (default: 50), confirming a lack of bullish strength and momentum favoring the downside.
Downtrend Confirmation:
The indicator ensures the market is in a downtrend by checking for lower highs and lower lows over a specified lookback period.
Key Features:
Bearish Signals: Displays a red downward-pointing label above the price bar when all three conditions are met, making bearish setups easy to identify.
Customizable Inputs: Traders can adjust the EMA length, RSI threshold, and downtrend lookback period to suit their specific strategies.
Versatile Application: Ideal for short entries, trend validation, or avoiding long trades during bearish conditions.
How to Use:
Use the "3 Confirmation Bear" indicator to:
Confirm Short Trades: Enter bearish trades when the signal aligns with your strategy.
Validate Trends: Ensure a clear downtrend is present before committing to a position.
Filter Trades: Avoid long positions during bearish momentum.
This indicator simplifies decision-making by focusing on high-probability bearish setups. Perfect for day traders, swing traders, and those seeking clear confirmation before entering a trade.
