The power of community
Get inspiration for your next trade. Don't reinvent the wheel.

Trading opportunity. What to buy?In the crypto market, the largest assets are currently experiencing similar situations.
On the charts, we can see that six assets have formed sideways trends. Prices for all six assets are currently at the bottom of these sideways trends. For four assets, the price temporarily dropped below the lo

Why will Ethereum drop toward 2500 levelLiquidity is slowing off Etherum toward Bitcoin as show on the ETH/BTC pair
structure at lower timeframe is respecting the 50% fib level and also trending downward inside the channel , as it repeats is similar pattern!!
Thank you for watching
Follow me for more crypto analysis

Factors Driving Gold (XAUUSD) Prices Up Analysis: Factors Driving Gold Prices Up
Here is why we think it will go up
(FUNDAMENTAL ANALYSIS)
Weak NFP Report and Potential Fed Rate Cuts:
The recent Non-Farm Payrolls (NFP) report came in weaker than expected, signaling sluggish job growth in the United States. This unexpected weak

The TradingView Show - Must-see Charts with TradeStationHello to all the global traders! We're live with David Russell, TradeStation's Global Head of Markets. He's also the one who publishes the research and analysis from the official TradeStation account on TradingView. Follow them here: www.tradingview.com
In today's show, we're discussing the most

Tesla among top 10 losers. Next what?Tesla is the 7th worst performer YTD in the Nasdaq-100. It is the 11th worst performer in the S&P 500. The stock stands 28% lower.
Still, after reaching its lowest level on 22/April, the stock has rallied a remarkable 30%. On 24/April, the stock rallied 12% after the positive earnings call. On 29/

An Exciting Insight into FXOpen's New Hong Kong-listed Stock CFDLook East! An Exciting Insight into FXOpen's New Hong Kong-listed Stock CFDs
Hong Kong has built up a gilt-edged reputation as one of the world's most reputable financial market centres. The city of Hong Kong enjoyed a unique position for many years. It is situated in the Asia Pacific region, very

FTSE 100 : HIGH IN THE SKY- The market still trades above a bullish trend line since mid-February 2024, strongly helped by a decreasing Pound Sterling. The mid-term trend is bullish for UK equities.
- Since the 3rd impact on its bullish trendline at the end of last week, the market has rallied to an hall-time high above 8,0

Technical Analysis: USD/EUR Exchange RateAs of the latest trading sessions, the USD/EUR currency pair displays a complex interaction of technical indicators and price patterns, suggesting a cautious yet potentially bullish outlook. We will break down the technical analysis using various tools and patterns, integrating recent market news in

XRP to 1$We can see a huge bullish Harmonic bat pattern that formed from the 2020 lows to the 2021 highs to the 2022 lows.
On July 13, 2023, the first target price(0.382) was reached.
Now we can look forward to the secondary price target(0.618).
If we look at a longer chart, we can see that a huge trian

See all editors' picks ideas
Learn the ins and outs of trading.
How To Trade Triangles Like A Pro?Welcome, traders and investors, to our educational post on ascending and descending triangles!
In the fast-paced world of financial markets, understanding chart patterns like these is crucial for making informed trading decisions. Ascending and descending triangles are powerful tools that prov

The TradingView Show: Live With OKX & TradeTravelChillGreetings, TradingViewers worldwide! This interview was conducted live and is now available for playback and on-demand viewing on our TradingView account, accessible for free. This program delves into trader education, cryptocurrencies, and the flexibility of trading from anywhere with an Internet c

Trade identification: Using bitcoin as an exampleHello,
Trade identification is the process through which you are able to identify setups that can be actioned on in the markets. For this example, I shall be using the BTCUSD chart to chant my path as I look for tradeable setups.
1: Structure drawing
Identifying the structure of trades is very k


Putting Risk Reward into PerspectiveMost newbies, and even intermediate traders don't really understand what high risk to reward trades require from themselves and from the market. They think it is something to strive for, and that high RR trades are reserved for the pros. This is far from the truth.
In this video I try to give more

Uncommon Inflation Measures for Analyzing Attitude towards Risk In this analysis we breakdown certain inflation measures that can aid us in capitalizing on longer term trends in various asset classes. The Baltic Dry Index or BDI gives us a real world view of shipping costs. The Index is a measure of the cost to move commodities by the Sea. Therefore, It's a lead

Options Blueprint Series: Debit Spreads - Precision InvestingIntroduction to Options on Corn Futures
Corn Futures are one of the staple commodities traded on the Chicago Board of Trade (CBOT), representing a critical component of the agricultural sector's financial instruments. Each Corn Futures contract is standardized to 5,000 bushels, and the price is qu

The ultimate guide on Elliott waves in crypto tradingMost of you have probably heard about Elliott waves and we are sure that you don’t use it in cryptocurrency trading strategy because it’s very complicated and subjective approach. Crypto trading for beginners is very challenging and stressful even without Elliott waves. To be honest when we first ti

Trading Diverging Chart PatternsContinuing our discussion on trading chart patterns, this is our next tutorial after Trading Converging Chart Patterns
This tutorial is based on our earlier articles on pattern identification and classification.
Algorithmic Identification of Chart Patterns
Flag and Pennant Chart Patterns

How Does Recession Affect Financial Markets?How Does Recession Affect Financial Markets?
Recessions, marked by widespread economic decline, profoundly impact financial markets. Understanding how different markets – stock, forex, commodity, and bond – respond to these downturns is crucial for traders and investors. This article delves into t

See all editors' picks ideas
Trading explainers – why read when you can watch instead?
The TradingView Show: Live With OKX & TradeTravelChillGreetings, TradingViewers worldwide! This interview was conducted live and is now available for playback and on-demand viewing on our TradingView account, accessible for free. This program delves into trader education, cryptocurrencies, and the flexibility of trading from anywhere with an Internet c
Why will Ethereum drop toward 2500 levelLiquidity is slowing off Etherum toward Bitcoin as show on the ETH/BTC pair
structure at lower timeframe is respecting the 50% fib level and also trending downward inside the channel , as it repeats is similar pattern!!
Thank you for watching
Follow me for more crypto analysis
The TradingView Show - Must-see Charts with TradeStationHello to all the global traders! We're live with David Russell, TradeStation's Global Head of Markets. He's also the one who publishes the research and analysis from the official TradeStation account on TradingView. Follow them here: www.tradingview.com
In today's show, we're discussing the most
Putting Risk Reward into PerspectiveMost newbies, and even intermediate traders don't really understand what high risk to reward trades require from themselves and from the market. They think it is something to strive for, and that high RR trades are reserved for the pros. This is far from the truth.
In this video I try to give more
Uncommon Inflation Measures for Analyzing Attitude towards Risk In this analysis we breakdown certain inflation measures that can aid us in capitalizing on longer term trends in various asset classes. The Baltic Dry Index or BDI gives us a real world view of shipping costs. The Index is a measure of the cost to move commodities by the Sea. Therefore, It's a lead
How To Grow A Forex or Crypto Acc Scalping A 5m Time FrameIn this video, we delve into a high-probability scalping strategy, building upon the concepts introduced in our previous videos on developing a trading plan and risk management. This third installment in the series focuses on refining entry points for high-probability trades. We explore a basic tren


Assessing Market sentiment using the Vix and Dxy 📑Hello Traders and welcome back to another Video analysis. We break down the relationship amongst different asset classes when gauging market sentiment. In particular, how to analyze market direction on the Nasdaq 100 by looking at the Volatility and Dollar Indexes. We combine this sentiment analysis

GBPUSD: Bullish Momentum Ahead! Friday Trading OutlookGreetings Traders!
In this video, I'll provide a comprehensive analysis of the DXY and GBPUSD, offering insights into what to anticipate in tomorrow's trading session. We've reached a crucial juncture on both the DXY and GBPUSD charts, so what lies ahead?
Stay tuned for valuable insights, and feel

See all editors' picks ideas
Trading indicators and strategies built by our community.
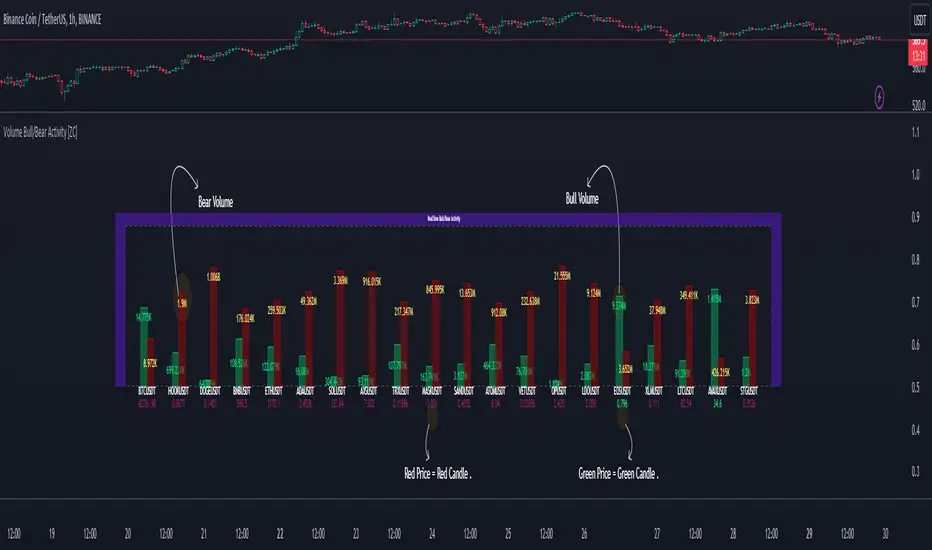
Volume Bull/Bear Activity [ZC]Volume Bull/Bear Activity Summary
This indicator generates a summary of bull/bear activity for 20 symbols.
For each symbol, two bars are displayed, colored green and red.
The green bar indicates bull volume, reflecting activity within the last candle of the symbol.
The red bar signifie
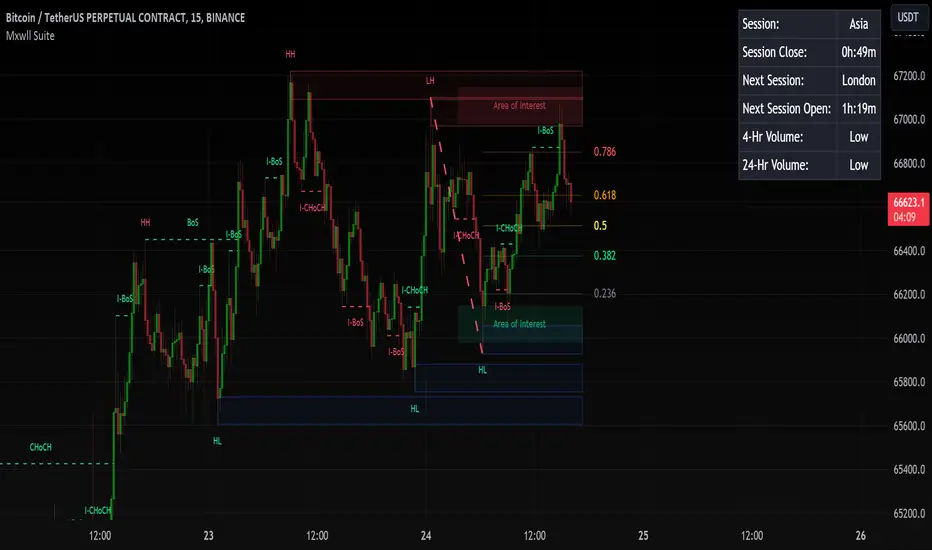
Mxwll Price Action Suite [Mxwll]Introducing the Mxwll Price Action Suite!
The Mxwll Price Action Suite is an all-in-one analysis indicator incorporating elements of SMC and also ideas extending beyond the trading methodology!
Features
Internal structures
External structures
Customizable Sensitivities
BoS/CHoCH
Order B
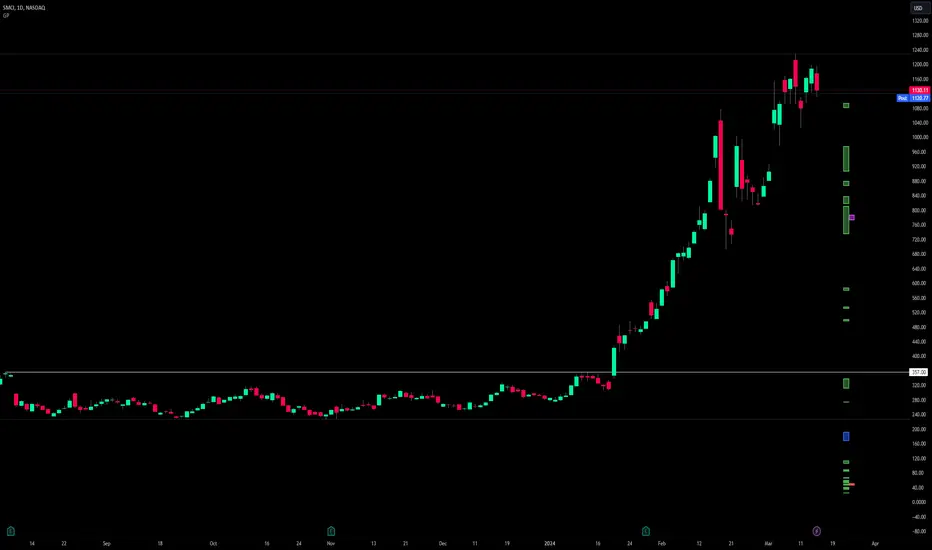
Percent Rank HistogramThis Pine script indicator is designed to create a visual representation of the percent rank for multiple financial instruments. Here's a breakdown of its key features:
Percent Rank Calculation:
The core functionality of this Pine script indicator revolves around the calculation of the percent r

Heat Map SeasonsHeat Map Seasons indicator
Indicator offers traders a unique perspective on market dynamics by visualizing seasonal trends and deviations from typical price behavior. By blending regression analysis with a color-coded heat map, this indicator highlights periods of heightened volatility and helps

Index Generator [By MUQWISHI]▋ INTRODUCTION :
The “Index Generator” simplifies the process of building a custom market index, allowing investors to enter a list of preferred holdings from global securities. It aims to serve as an approach for tracking performance, conducting research, and analyzing specific aspects of the glob

Higher-timeframe requests█ OVERVIEW
This publication focuses on enhancing awareness of the best practices for accessing higher-timeframe (HTF) data via the request.security() function. Some "traditional" approaches, such as what we explored in our previous `security()` revisited publication, have shown limitations

Trailing Management (Zeiierman)█ Overview
The Trailing Management (Zeiierman) indicator is designed for traders who seek an automated and dynamic approach to managing trailing stops. It helps traders make systematic decisions regarding when to enter and exit trades based on the calculated risk-reward ratio. By providing a cle

Periodic Activity Tracker [LuxAlgo]The Periodic Activity Tracker tool periodically tracks the cumulative buy and sell volume in a user-defined period and draws the corresponding matching bars and volume delta for each period.
Users can select a predefined aggregation period from the following options: Hourly, Daily, Weekly, and Mo

Gaps Profile [vnhilton]Note: If you get an error preventing indicator from executing due to a loop running longer than >500ms, please lower the amount of boxes shown and/or increase the minimum gap % threshold.
OVERVIEW
The Gaps Profile (GP) simply shows the remaining gaps on the chart that have yet to be closed. Gaps
TTrades Daily Bias [TFO]Inspired by @TTrades_edu video on daily bias, this indicator aims to develop a higher timeframe bias and collect data on its success rate. While a handful of concepts were introduced in said video, this indicator focuses on one specific method that utilizes previous highs and lows. The following des

See all editors' picks scripts