A powerful crypto exchange that just started. UPDATEEverything is pumping and rising soon, US500, EURUSD, GOLD, BITCOIN ETC
It is a coin of a major crypto exchange and definitely a good choice. The crypto industry is in its infancy
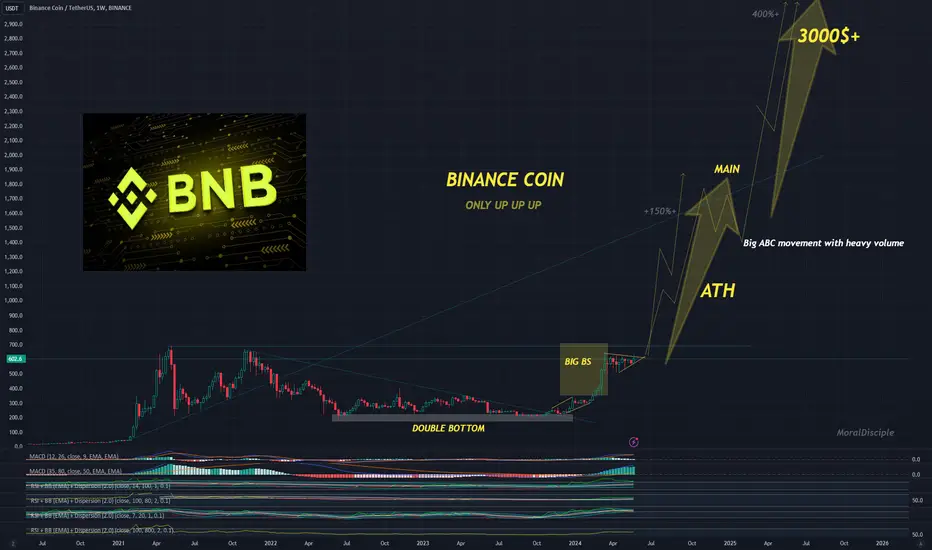
Only up!
BNBUSDT trade ideas
BNB Bulls Eye Breakout: Will Binance Coin (BNB) Surge Past $660?Binance Coin (BNB) has emerged as a standout performer, showcasing significant price movements over the past few years. From its early days at around $50 in November 2020 , BNB has experienced dramatic highs, bringing significant opportunities for investors.
BNB's journey has been nothing short of remarkable. After climbing to an impressive $696 peak in May 2021 , the subsequent bearish market took its toll, driving the price down to a low of $200 in June 2022 . The coin then faced a resistance level of $340 , appearing as a double top pattern before retracing back to the yearly support of $200 by October 2023.
However, the tide turned in favor of BNB as the broader crypto market regained momentum. The resurgence propelled BNB to new heights, surging to an all-time high of $640 . Currently, BNB has found solid support at the $500 level, a critical juncture that could pave the way for further upward movement.
I am closely monitoring BNB's recent price action, particularly as it hovers around the $590 resistance zone . A breakout above this level could set the stage for a significant rally towards the next resistance point at $620 . If BNB manages to breach this barrier, experts anticipate a clear path towards surpassing its previous all-time high to a new price $700 and potentially even higher.
Looking at the weekly timeframe chart, the $500 support level holds key significance. Should this level remain intact, market sentiment suggests a bullish breakout scenario, targeting ambitious price goals beyond the current resistance.
Investors and traders are advised to keep a close watch on BNB's performance in the coming days, as market dynamics continue to shift rapidly. With the broader crypto market showing signs of upward momentum, Binance Coin stands poised for a potential breakout, setting the stage for an exciting period of price discovery and market activity.
As always, it's crucial for participants in the crypto space to exercise caution and conduct thorough research before making investment decisions. The inherent volatility of cryptocurrencies underscores the importance of staying informed and adapting to evolving market conditions.

BNB detailed analysis ⏰ detailed chart 📉📈My analysis on BINANCE:BNBUSD
Detailed chart 📉📈 provided
Every move I will update under this post 🤠
Make shure saved / follow updates on my post of BINANCE:BNBUSDT
Just boosting 🚀 give support 📌
Soon i will update complete idea 💡
🧵 👉

BNB: analaysis in D1📊Analysis by AhmadArz:
According to the flag pattern that we saw the best reactions in the past, we can expect the same analysis from the chart at this time.🧨
Just keep in mind that there is a 10% chance of a fake breakout on each side of this horizontal trend.🚨
🔗"Uncover new opportunities in the world of cryptocurrencies with AhmadArz.
💡Join us on TradingView and expand your investment knowledge with our five years of experience in financial markets."
🚀Please boost and💬 comment to share your thoughts with us!

BNB (Y24.P2.Video1).Breakout trade and what nextHi Traders,
Here are my thoughts on this level and what to watch out for in terms with fibonacci levels as well as structure and liquidity.
Please give me a like and share,
Regards,
S.SAri

BNB : NEW ATH !! What's NEXT FOR BNB ??BINANCE:BNBUSDT
Binance coin / BNB has recently made a new ATH 💥🚀 And the price doesn't seem to be ready to turn around just yet. How can we gauge the next possible targets AND retracements for BNB SHORT TERM?
1) Bollinger Bands
Bollinger Band Strategy is excellent to use on lower timeframes, especially when combined with Fibonacci zones. The yellow dot basis (20d Moving Averages) is a common zone to watch for retracements, as well as bounces. As long as the price is bullish, the basis will hold and act as support. The Fib lines up until the basis can be watches for bounce zones:
Notice that periods of contractions is followed by expansion - watch the upper red and purple lines for near term targets (price labels on the right).
2) Fibonacci
Trend based Fibonacci can be helpful to identify key zones that could likely act as resistance, for example:
If we can't close ABOVE the 2.618, we stand a risk to form a nasty M-Pattern, which could indicate the end of the bullish cycle.
3) Moving Averages
The price often corrects towards the moving averages in the daily timeframe. This could be a potential re-entry zone for a swing trade (not accumulation as the price is at the peak of the bullish cycle). Understand that you risk is HIGH if you're looking to buy here. If we lose the 50d (green trendline) that could mean the bullish cycle is coming to an end. You can see the bounce is slightly smaller every time it touches, indicating the end is potentially near:
____________________________

BNB - Ranges overview BNB is currently breaking its highs and making new highs. Let's see how we play from here.
Plan is simple and straightforward as always. Follow the market and the ranges.
IF we fail to hold above 670$ and close back within the range (clean candle close) expect us to hunt the sellside liquidity resting around 540$ and 520$
IF we hold the current highs expect us to continue higher
PLAN...BE PATIENT and EXECUTE
Stay safe and never risk more than 1-5% of your capital per trade. The following analysis is merely a price action based analysis and does not constitute financial advice in any form.

Long signal for BNB/USDTThis technical analysis is based on the daily chart of BINANCE:BNBUSDT on the Binance exchange. In this analysis, a price channel is drawn, and support and resistance levels are evaluated.
Price Channel Analysis:
The price is currently within a price channel ranging from 556.3 to 676.1 USDT.
The suggested entry point is around 588.5 USDT.
Entry and Exit Points:
Entry: 588.5 USDT
Take Profit: 676.1 USDT
Stop Loss: 556.3 USDT
Conclusion:
This analysis suggests that by adhering to the specified take profit and stop loss levels, a successful trade can be achieved. The Reward/Risk Ratio for this trade is approximately 2.74, indicating a highly favorable risk-to-reward scenario. To manage risk effectively, it is recommended to strictly follow the stop loss level.

BNB M BULLFLAG, explosive move on H BNB getting its explosive move to resistance after weeks of continually basing higher.
Been flipping this for weeks to build a decent position,
Out1 /2 too profits into this move ,
taking back a big position in retest of 15 Ema 12 and then 5 OS for an H HL.
Basically I am expecting a break oiut of this range soon , if yoo see my post on JASMY
it did a similar thing and had nice follow through.

BNB ATH incomingIt seems to me that $1000 per BNB is destined at this point
Binance won the exchange wars, and it's positioned to win in the scene of degenerate gambling that the US economy is promoting, high levels of debt and keep on printing infinite fiat (saw news that the Wall Street guys are looking to adopt the 24/7 trading hours)
In whatever case, bear market or bull market, Binance is the best investment for the crypto industry.
So much for decentralization and muh ''bitcoin fix this''

BNBUSDT Elliott wave countAfter hitting 1.618 fib extension of wave ((i)) below 721.8 we are looking to the downside for wave ((iv)).
Possible target 0.236 fib retracement of wave ((iii)) in the span of previous wave (iv).
We are not excluding one more leg up above 721.8.

BNB: Potential Bull Pennant Breakout!Hey everyone! If you enjoy this content, please consider giving it a thumbs up and following for more analysis.
BNB recently completed a formation resembling a bull pennant pattern on the daily timeframe. The price has broken out of this pattern and is currently retesting the breakout zone. If it holds this retest level, it could signal further bullish momentum for BNB.
Buy some now and add more in the dip.
Entry range:- $560-$600
Targets:- $712/$834/$986/$1194
SL:- Daily close below $530
Let's Discuss!
What are your thoughts on BNB's current price action? Do you see a bullish pattern? Share your analysis in the comments below!

My BNB plan for the next couple of weeksMy BNB plan for the next couple of weeks
If a breakout happens, we could see a $1000 target!
But be cautious: if it breaks down below $575, we might see $400 levels.

ALT COIN Explosion incomingBullish on All ALTS, post halving, altcoins also explode to the upside, they are gearing up

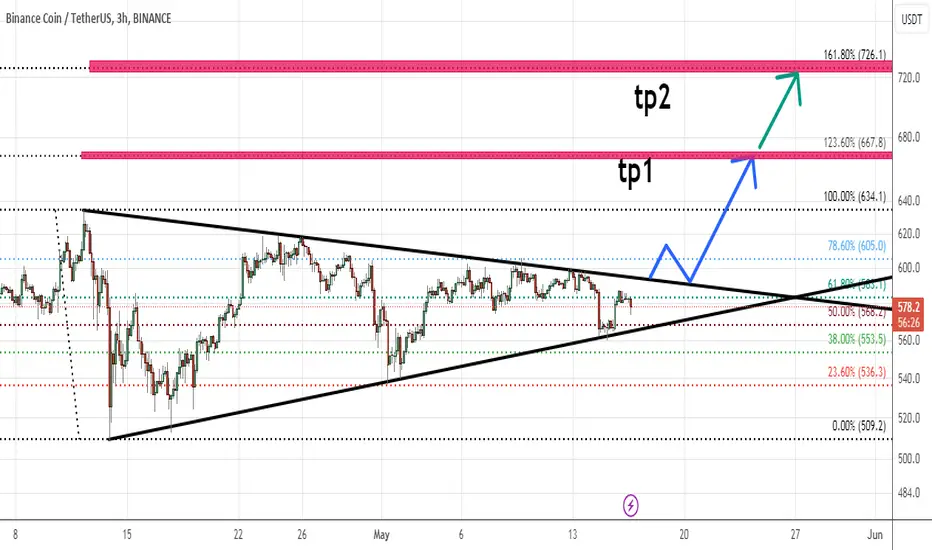
BNB is waiting for breaking upward upward break is more probable than other scenarios ,so waiting for this break for going toward its tp's .
this analysis is based on fibo level and price action and ichimikou indication .
please share your comments if you like
BNBUSDT long Potential trajectory towards 661.5, there is also a retest. In the meantime, a strong bullish candl


BNB - potentially getting out of the triangleA nice setup is currently being created on BNB. The upside exit from the triangle I marked should give a strong upward impulse. Entering riskier positions at the bottom of the triangle trend line with a fate stop below the last lows (worth the risk) or safely after a retest of exiting the triangle at the top. In both cases we are targeting the same TP of 1.618 measuring the fibo of the last correction:
TP - around $730
The negation of this analysis would be the formation of a lower low on the H4 time frame.

BNB UP to 830 or 850 rangeSymmetrical Triangle pattern clear on one day chart BNB, rising to 830 USD or 850 USD

#BNB/USDT UPDATE !!Hello friends, welcome to this BNB/USDT update from Crypto Sanders.
Certainly! Here's an update based on the recent movements and potential outlook for BNB (Binance Coin):
Resistance: The key resistance area to watch is around $610.
BNB recently bounced from the support level provided by the yellow moving average line.
The price is now approaching the critical resistance level of $610.
If BNB breaks above $610, it could signal the start of a new rally.
Traders should monitor the price action around this resistance level closely.
I have tried to bring the best possible results in this chart.
If you like it, hit the like button and share your charts in the comments section.
Thank you.

BNB, wait wait waitAll we need to wait for the price accumulate more, it needs to break the yellow range, then the trendline.
If the price break the yellow range, I will buy to catch the next wave...

BNB/USDT: Enter on Bullish Consolidation Break, Buy Stop at $625BNB/USDT has displayed a bullish consolidation pattern and is now poised for an upward breakout. A buy stop order is set at 625 to capture the breakout from this consolidation, targeting a favorable risk/reward ratio of 1:2. This strategy anticipates a significant upward movement as BNB/USDT aims to reach higher resistance levels. Monitor closely for the activation of the buy stop as it indicates strong buyer momentum, positioning for a potential rise towards our calculated target.

BNBUSDT. Trading opportunityOn the daily timeframe, the price has formed a sideways movement and reached the mandatory target of the seller's vector 7-8. The next relevant buyer's vector 8-9 has a potential target of $634. The price is currently in the middle of the sideways range on the daily timeframe.
On the hourly timeframe, the price has also formed a sideways movement. The short seller's vector 11-12 broke below the lower boundary of the sideways range at $574 and collected sellers' liquidity. Pay attention to the key volume of the last vector 11-12: the candle with the highest volume in the vector is at the bottom (marked as 'KC' on the chart). Then the buyer absorbed this volume and returned the price to the sideways range, forming a new buyer zone at the boundary of the sideways range (the blue rectangle on the chart, upper boundary at $575.5). The key volume (largest) in the emerging buyer's vector is also at the bottom (the candle on the chart is marked as 'tKC'). This setup increases the probability of realizing the buyer's vector 12-13 with a potential target on the hourly timeframe of $600.
Idea: Look for purchases as the realization of the buyer's vector 12-13 on the hourly timeframe and the buyer's vector 8-9 on the daily timeframe. The target on the hourly timeframe is $600.
The preferred option is to look for purchases from the defense by the buyer of the buyer zone at the lower boundary of the sideways range.
