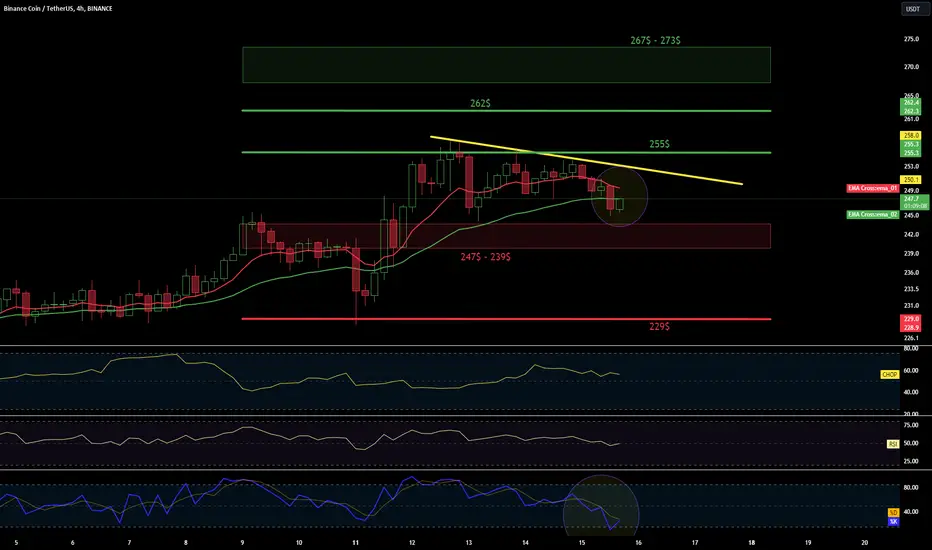
BNB/USDT 4HInterval ChartI invite you to review the chart of BNB in pair with USDT, also on a four-hour time frame. First, we will use the yellow line to determine the local downward trend under which the price is moving.
In order to determine the current supports for the BNB price, we will unfold the trend based fib extension grid, and we can see that the price is approaching a strong support zone from $247 to $239, however, if we break down from this zone, we can see the price return to the support area at $229.
Looking the other way, we can similarly mark places where the price should encounter resistance on the way up. And here, first, there is strong resistance at the price of $255, then there is resistance at the level of $262 at the golden Fib point, and then the price has to face a strong resistance zone from $267 to $273.
Please look at the STOCH indicator, where we have a strong rebound and there is room for us to go a little lower, but moving near the lower border we can observe an attempt at a rebound and small increases.
And when we look at Ema cross 10 and 30, we can see that they do not yet indicate confirmation of a return to the downward trend.
BNBUSDT trade ideas
BNBUSD, Inverse Head and Shoulder PatternBNB Inverse Head and Shoulder Pattern
TP 1 White Line
TP 2 Purple Line on top
Price above 200 moving average

✴️ Binance Coin Likely Heading Lower (EMA300 Rejection)Good Friday my fellow Cryptocurrency traders... Is this not a dead-cat bounce?
What one does, the rest follows... Still applies?
We can see EMA300 working as resistance for BNBUSDT.
A strong rejection happened below this level and after a higher low BNB moved up to challenge the same resistance again.
Today we have an early signal of rejection at the same level.
BNBUSDT closing below EMA300 ($252) works as confirmation for this bearish signal which implies lower prices.
➖ Notice the huge volume 21-Nov. (red).
➖ Notice the low volume in the last three days.
If Binance Coin fails to move higher a lower low is set to happen next.
A lower low compared to October, which would mean below $200.
Thank you for reading.
Namaste.

BNB WEEKLY SUPPORT AND RESISTANCEAreas of support and resistance on the weekly BNB chart. The channel at the top has the top, bottom and EQ in the middle.

BNB high buyer activity! LONG up to 262 ⬆️LONG #BNBUSDT from $254.5
Instrument formed a sideways movement, we see that buyer activity remains at a high level, impulse drops are quickly bought off, trading volumes are locally as high, there is an excellent price compression under the formed cascade of levels, the breakdown of which I will consider in the near future, with the acceleration of the price in the breakdown, I expect to see a continuation of the long to the two potentials marked on the graph

BNB - IN FEW HOURS - HOW I SEE IT
This is an intra or call it counter or scalp or leveraging trade against the main LONG trade I posted yesterday which is already in about double digit percentage. The opportunity of about 3 risk reward presents itself and I feel it is not bad to take it. What do you think?
(see previous analysis about BINANCE:BNBUSDT on my page or comment section for context)

BNB Long Trend Posibilitythis is not financial advice , its a analytics on patterns based on probabilities , this OCO have great chance to sky high BNB price , if supass the downtrend and flip as support could make 50% up in 2 or 3 weeks Stay up and always put stop loss people , i learned hard way folkd

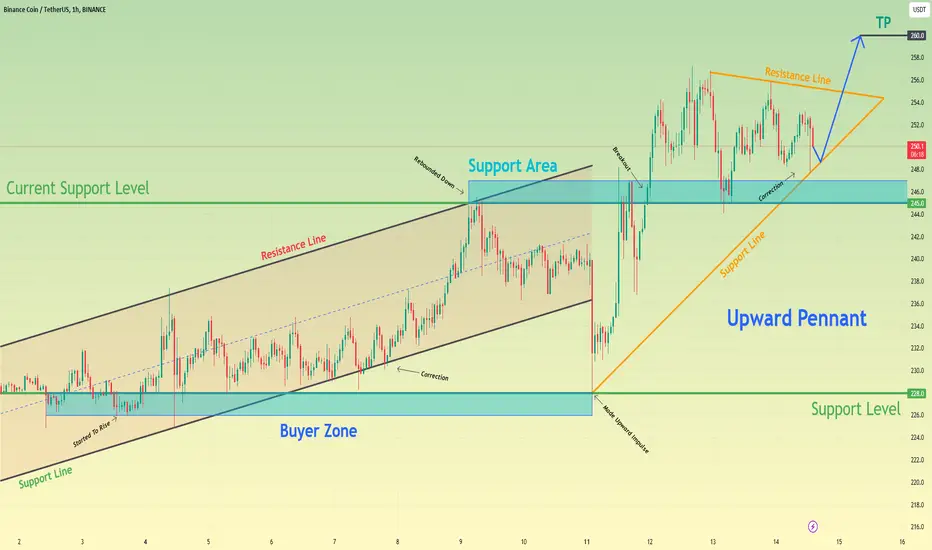
Binance Coin can rebound up from upward pennant to 260 levelHello traders, I want share with you my opinion about Binance Coin. By observing the chart, we can see that the price a few days ago started to rise in an upward channel, where it first broke the 228 support level, which coincided with the buyer zone. Some time ago, BNB made a correction to the support line of the channel and then bounced to the resistance line. After this, the price rebounded and fell to the 228 support level, which coincided with the support line of the pennant, thereby exiting from the channel. Next, the price rebounded from this line and made a strong upward impulse to the resistance line of the pennant, breaking the 245 level. Also then, BNB corrected to the support area and a not long time ago continued to rise near the support line of the pennant. And now, I think that Binance Coin can rebound from the support line and rise to the resistance line of the pennant. After this, BNB can break this line, thereby exiting from the pennant and then continuing to move up. For this case, I set up my target at the 260 level. Please share this idea with your friends and click Boost 🚀
BNBUSDT Price can exit from wedgeBNB forming a rising wedge. Divergence is seen on RSI
Trade taken according to analysis done on chart


BNBUSDT- In Trend ReversalBNBUSDT is making a double top and RSI indicator also showing divergence, indicating a trend reversal. Can take an entry by placing sell stop order on breaking of the neckline or can take instant entry of neck line is already broken.

BNBUSDT - Price can exit from wedge and fall to support levelHi guys, this is my overview for BNBUSDT, feel free to check it and write your feedback in comments👊
After the price started to trades in flat, it first declined of support level to the support area, where BNB as few time traded.
Later price broke $228 level again, rose to the top part of flat, and then started to trades higher than the support level.
Then BNB exited of flat and rose to $245 level, which coincided with the resistance line of wedge, and soon bounced down to the support line.
In wedge, the price in a short time broke $245 level and then rose to the resistance line of the wedge, but recently it fell to this level.
Now, BNB trades near the support line and I expect the price can make a little movement up and then it bounces down to $245 level, exiting from wedge.
If this post is useful to you, you can support me with like/boost and advice in comments❤️

bnbSupport and press the rocket to cheer me up
Observe the ten percent loss limit
Stay away from Bitcoins
Feel free to buy and sell and post your comments

[05-12-2023] $BNB BREAKOUT & RETEST FOR SEVERAL TIMESCRYPTOCAP:BNB chart shows a falling wedge pattern that has recently broken to the upside and already retest for several times. If the current trend continues upward following the breakout, a trend-following strategy could involve buying on pullbacks or consolidations with a stop-loss set below recent swing lows or the breakout point to minimize potential losses.

BNB → Price is showing an interesting bullish outlook BINANCE:BNBUSDT breaks the resistance of bearish trend on the background of improving fundamental situation. For the activation of the bullish phase of the market, a few more conditions must be met.
We can see that CRYPTOCAP:TOTAL capitalization, following the COINBASE:BTCUSD growth, is also moving into a bullish trend format. BNB is falling away due to regulatory and governance issues. At the moment, the fundamental environment is improving and the price is starting to show interesting prospects.
The break of the descending wedge resistance is a strong enough signal, the price is testing the MA-50 support and the bulls are confidently consolidating their positions above the moving average. At the moment, the resistance of the current consolidation - 257.8 - is holding back the market from going bullish.
A break of this resistance will be accompanied by a surge in volumes, volatility and the formation of a bullish impulse.
Support levels: 226, MA50, 203.4
Resistance levels: 257.8
I expect a breakout of the mentioned resistance after the next retest. On the background of favorable conditions it may happen rather quickly. Targets are 336.8, 439.0.
Regards R. Linda!


BNB Following my ideasBinance coin is perfectly following my ideas. 264 will be my target and i will start considering a short at this price level. We are up 8% o spot, enjoy

finally bnb preparing for massive recovery bnb looking good for solid recovery
formed symmetrical triangle in 3 days timeframe and soon expecting massive breakout incase of successful breakout expecting solid bullish rally
expecting 2 3x bullish wave incase of successful breakout

BNB Macro Wyckoff Reaccumulation The one I posted before this had the image blocking the chart.
BNB Macro Wyckoff Reaccumulation
Capo probably going to get unbelievably REKT on his short
Not financial advice

BNB Macro Wyckoff ReaccumulationBNB Macro Wyckoff Reaccumulation
Capo probably going to get unbelievably REKT on his short
Not financial advice

BNBUSDT Long (longterm posision)"I believe BNBUSDT is currently forming a triangle pattern, nearing its completion. The breakout is imminent. However, it's essential to consider the fundamental aspect as the fundamental performance of BNB is not favorable. Despite this, there is a promising long-term technical position, and I plan to trade it with approximately 2x or 3x leverage."
Follow me on X.COM --> cryptoboys2030

✴️ Binance Coin Looking BearishDaily trading volume is really high and green but to me Binance Coin is still bearish... Let's look at the reason why!
➖ The RSI peaked 6-Nov.
➖ Yesterday's candle has a long upper wick.
➖ Today's candle also has a long upper wick with a lower high compared to yesterday. This one can turn into a worrisome signal.
✔️ If the day closes low or red, it can indicate Binance Coin (BNBUSDT) is ready to crash big time.
✔️ If BNB closes above 258, we can consider this analysis invalid but bearish potential will remain in place as long as the 268.4 high holds as resistance. Only above this level can this pair be considered bullish again for varied reasons.
Generally speaking, all the technicals are bullish... But we have to read between the lines to able to spot when change is about to take place.
This is just a potential scenario and needs confirmation.
Binance Coin is set to crash!
Thank you for reading.
Namaste.

BNB / TetherUSD decision point comingLog scale: weekly RSI now at 50 and BNB-USDT is entering the narrowing edge where the chart has to decide. Down will mean lots of pain, with a potential fallback to $40.
