ESH2019 trade ideas

Weekly /ES could be forshadowing a much stronger marketI was looking at /ES on the weekly because things were looking interesting on the lower time frame charts I spend more time on. Low and behold and this chart is looking like it could be setting up for much higher prices. The recent down move gave us some rebalancing off of the crazy run we have had since late last year and the last two weeks seem to be showing us a bottom may be in for now. Price touched the 21 EMA a couple weeks ago during that OTFD but the last two weeks have been bullish and we are trying to close at the highs again this week.
One concern is that we are approaching a long term Weekly trendline (shown in White) so that may provide some resistance but if we break through and hold you can see where some of the fib extensions go. I'd be looking to long the close if we hold at or near the highs with a stop below 5015 and targets of 5320, 5410, and 5550. Best of luck in your trading!

ES UpdateNot overbought yet. Looks like Monday will be a pump and dump day.
I guess I should have more faith in the market that they'll find a way to pump AAPL on bad earnings, lol. Not feeling very bullish because earnings didn't justify valuation, and my favorite stock, PCAR, is still dropping, lol.

Trading Plan for Friday, May 3rd, 2024Trading Plan for Friday, May 3rd, 2024
Market Sentiment: Bulls maintaining a tentative lead ahead of multiple high-impact market events (Apple Earnings and Jobs Report). Expect extreme volatility and plan accordingly.
Key Supports
Immediate Supports: 5068 (major), 5054 (major trendline - note this level rises daily)
Major Supports: 5028 (major), 5001 (major)
Key Resistances
Near-term Resistance: 5081 (major), 5102 (major), 5116 (major), 5136 (major)
Major Resistances: 5155-58 (major), 5191 (major), 5208 (major)
Trading Strategy
Earnings and Jobs Volatility: Be prepared for unpredictable, potentially violent price swings triggered by the Apple earnings release (4:30 PM EST) and the jobs report (8:30 AM EST). Prioritize reacting to price action over anticipating.
Capital Preservation: Adopt a cautious approach and consider reducing position sizes or even sitting out the immediate volatility. Focus on protecting your gains from today's squeeze.
Long Opportunities: Due to the heightened risk, avoid direct bids at support. Prioritize failed breakdowns with flushes and reclaims for safer long entries. In the event of a deep flush, consider knife-catches at major supports (5028, 5001).
Short Opportunities: Look for back-tests of 5116 and 5136 for shorts, but only if markets exhibit a strong negative reaction to earnings or positive jobs data. Proceed with extreme caution.
Focus on Levels: Use the provided support and resistance levels to guide your decisions, regardless of the volatility. Pay close attention to failed breakdowns and setups, as they will be the most reliable in this environment.
Bull Case
Holding Support: Defending the 5054-50 support zone remains crucial.
Reclaiming Resistances: Bulls need to push above the 5081 resistance zone after any potential sell-off on events, working back towards 5116, then 5136 for further confirmation and a potential sustained breakout.
Bear Case
Breakdown Signals: A convincing break below 5054-50 initiates the downside move. Watch for bounces/failed breakdowns for potential short entries. Be mindful of whipsaws and traps around major events.
News: Top Stories for May 3rd, 2024
Impact of Monetary Policies:
U.S. Monetary Policy and Global Markets: Contractionary policy affects global financial conditions through various channels.
Responses to U.S. Policy Shifts: Tightening policy induces global deleveraging and affects asset prices and credit flows.
Emerging Markets' Sensitivity: EMs experience volatility and capital outflows due to U.S. policy changes.
Transmission Mechanisms: Policy changes influence dollar-denominated assets, global credit conditions, and bank behavior.
Long-Term Implications:
Global Trade Outlook: Modest rebound in 2024 challenged by interest rates, demand fluctuations, and geopolitical tensions.
Manufacturing Sector Performance: Continued uncertainty with challenges like labor shortages and supply chain disruptions.
Advances in Digital Manufacturing: Adoption of digital twins and smart tech enhances operational efficiencies.
Geopolitical Impact on Trade: Persistent tensions disrupt global trade, highlighting vulnerability of supply chains to political instability.

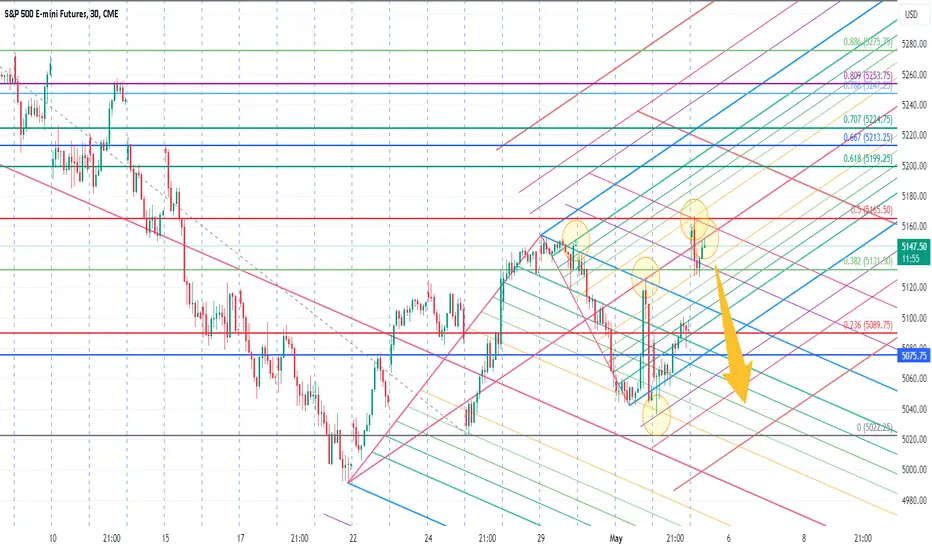
ES1! morning updateWatching UVIX break through its low of $8.37 this morning gives me confidence that market top is not in. The most bullish scenario now would see four separate impulse waves (in blue ellipses) since low of 4963.50. Pivots at 5022.25 and 5036.25 were both technical, bouncing off .618 fib levels. Bulls need to advance above 5200 with continued impulsive action, and if so, this count will most likely play out to ATHs later this month.

NFP Trading #ES #NQThis video goes over tactics and strategies on how to trade on NFP day for ES and NQ.

Lean /Prep/Lotto Friday ES Trade Plan
Inflection: 5082
Upper lvls: 5099-5109 / 5125-5127 / 5137 / 5153
Lower lvls: 5072-5074 / 5036 / 5005
NQ Trade Plan
Inflection: 17632
Upper lvls: 17776 / 17818-17838 / 17871 / 17901-17937 / 18063
Lower lvls: 17564-17573 / 17482 / 17356-17370
Stay Frosty!

Non Farm Payroll Gameplan BullishI am bullish on NFP and expect prices to drift sideways the whole night up until 6-8am until 08:30 when NFP will release. It should dump down only for it to be bought back up and continue on to new highs.
I will show the last NFP's and show how all of them were bullish.
April
March
February
January
December
November
October
September
August
July NFP
June NFP
May NFP
As you can see, the past 12 NFP's have all been bullish and had higher prices. Only a few actually sold off later on in NY session. The vast majority have all grinded higher. I will expect the same for May 3rd 2024

ES Price Action REview 4-2-24 and morning review 4-3-24We are reviewing price action from yesterday and this morning. going over the clues the market left and how we could have traded the day better.

May 3rd S&P 500 bullishthe price needs to go back up to test the high. this is election year, and the stock market will keep climbing.

Buying momentum into the weekend?Can the buyers that appeared in the S&P 500 on Thursday continue its momentum up with a stronger close on Friday. This could be a challenge with the softer opening in the Asia session.

Tradingview - How to place an OCO bracket order.In this video we will demonstrate how to place a simple bracket order with Tradingview with AMP Futures.

TradingView - How to send feedback requestIn this video we will demonstrate how to access the help center in TradingView with AMP Futures.


How to log into TradingView with AMP Futures.In this video we will show you how to link your AMP Futures trading account with TradingView.

ES UpdateLooks to me like the algos are going for the pump and dump.
Gap direction will depend on AAPL earnings though so I'll wait to see what happens. MFI probably hits overbought tomorrow either way

sp500 longToday's bullish trend is confirmed. the bear market of the past few days has been swept away and volatility is falling again. At the SP/VIX ratio today's candle shows significance and relevance, with a wide body and close on the highs. We go Long with a trickle of gas, up to 5120 points.

ES & SPY Outlook Trading Plan for NYSE:ES and AMEX:SPY based on Downtrend and Key Levels
Overall Market Context:
We are currently in a confirmed downtrend for NYSE:ES and AMEX:SPY since their respective all-time highs.
Major resistance sits at 5150, with major support at 5033 and 4965.
Trading Strategies:
Short Positions:
Primary Entry: Look for bearish price action (e.g., bearish engulfing patterns, failed breakouts above resistance) near the 5130-5140 hourly supply zone. This zone has not been tested yet and could offer a strong selling opportunity.
Secondary Entry: If the price fails to break through 5150 resistance convincingly, consider shorting on a retest of this level.
Targets: Aim for the first major support level at 5033. Aggressive traders can target the next support level at 4965.
Stop-Loss: Place a stop-loss above the 5150 resistance level to limit potential losses if the market breaks higher unexpectedly.
Long Positions:
Low-Confidence Opportunity: If the price reaches the 5025-5040 demand zone (previously tested twice), consider a long position with a tight stop-loss. This area has shown some support in the past and might offer a potential bounce.
High-Confidence Opportunity: Wait for a clear break and confirmation above the major resistance at 5150. This would signal a potential trend reversal and offer a more reliable long entry point.

ES UpdateIndicators are neutral but MFI rapidly approaching overbought.
Quite frankly, I'm bearish on AAPL earnings this afternoon anyways

Trading Plan for Thursday, May 2nd, 2024Trading Plan for Thursday, May 2nd, 2024
Market Sentiment: Uncertain, with bulls holding a precarious position at a critical support level.
Key Supports
Immediate Supports: 5048-50 (major - note that this trendline rises daily), 5032, 5028 (major)
Major Supports: 5010 (major), 4968 (major), 4938-42 (major)
Key Resistances
Near-term Resistance: 5077-82 (major), 5102 (major), 5126 (major), 5136 (major)
Major Resistances: 5155 (major), 5197-5202 (major), 5246-50 (major)
Trading Strategy
Critical Support Test: Vigilantly monitor the critical 5048-50 support zone for signs of breakdown or sustained defense.
Long Opportunities: Due to heightened volatility, avoid direct bids at support. Instead, prioritize failed breakdowns with flushes and reclaims for safer long entries, potentially around 5032 or 5028. In the event of a deep flush, consider knife-catches at major supports (5010, 4968, 4938-42).
Short Opportunities: Look for back-tests of 5126 and 5136 for shorts, but only if a strong bearish reaction to FOMC is evident. Proceed with caution.
Risk Management: Maintain disciplined risk management and tighter stops in this volatile period.
Bull Case
Holding Support: Defending the 5048-50 support zone is crucial. A failed breakdown with a quick reclaim above 5032-28 could trigger a move higher.
Reclaiming Resistances: Bulls need to push back to 5077-82, with a potential retest of that resistance, then onward to the 5126-36 zone for further confirmation and potential breakout.
Bear Case
Breakdown Signals: A convincing break below 5048-50 followed by a deeper dip through 5028 initiates the downside move. Watch for bounces/failed breakdowns for potential short entries.
News: Top Stories for May 2nd, 2024
Analysis of Stock Market Trends:
U.S. Market Performance: Mixed responses post-Fed's rate decision, with slight Dow increase and S&P, Nasdaq declines.
Interest Rates and Inflation Concerns: Persistent inflation shapes Fed policies, influencing market dynamics.
Sector-Specific Trends: Tech sector drives market, but faces valuation challenges and regulatory scrutiny.
Global Market Influences: European markets resilient; contrasting approaches to interest rates and inflation with the U.S.
Investment Strategies:
Federal Funds Rate Stability: Fed maintains high rate amid inflation concerns, impacting market expectations.
Inflation Trends and Policy: Slow decrease in inflation complicates rate cuts, influencing investment decisions.
Global Impact: Fed's policies affect global markets, especially in emerging economies and those tied to U.S. standards.
Long-term Considerations:
Geopolitical Tensions: Conflicts threaten global supplies; Middle East escalation could disrupt oil production.
Economic Slowdown: China's slowdown poses risks globally, impacting markets and economic stability.
Inflation and Interest Rates: Central banks balance inflation control without hindering growth, posing risks.
Technological Transformations: Rapid tech changes create opportunities and risks, transforming labor markets.
Environmental Risks: Growing environmental concerns pose economic consequences, impacting industries.

PacMan Trend Symbol; Guidance into PCE and Next WeekThe video explains it all a lot better, but basically, we are sitting with higher highs and lower lows on the trend timeframes that brought us here (30m-4hr), otherwise known as the Pac-Man symbol.
Trends into today are;
Last Macro Trend Signal Spots (ES Contract)
30m - 5083 Uptrend (4/25/2024) Higher High
1Hr - 5083 Uptrend (4/25/2024) Higher High
2Hr - 5131 Uptrend (4/25/2024) Higher High
3Hr - 5123 Uptrend (4/25/2024) Higher High
4Hr - 5131 Uptrend (4/25/2024) Higher High
6Hr - 5250 Downtrend (4/2/2024) Higher Low
12Hr - 5204 Downtrend (4/4/2024) Higher Low
Daily - 5166 Downtrend (4/12/2023) Higher Low
Weekly - 4769 Uptrend (12/11/2023) Higher High
Monthly - 5304 Uptrend (03/31/2024) Higher High
If we move directly higher from here, the 6hr is going to be a lower high, but it will be the lone trend calling for a lower movement, as when the 12hr and Daily strike, we will have a higher high.
I did not account for us to drop so harshly from GDP data yesterday, and certainly didn't expect that drop to fizzle out and us to push higher over after this occurred. This is why I almost never short into Earnings season.
Economic Calendar;
PCE Data is today. I foresee it pushing us lower, but not with enough confidence to blindly trade short into it.
Major next issue is the Fed Meeting on Wednesday of next week.
Overall, likely just missed opportunity from not going short at the close of Wednesday and catching most of the move back down yesterday, although I likely would have let at least half the profit reverse before I jumped out anyways.
I expect I'm going to miss out on a drop today, but without trend confirmation I just don't feel strongly enough about shorting into this PCE data at this point.
I made some good trades earlier, so I'm fine with it, and I still have Gold Long from 2305 and my Soy contracts are FINALLY starting to generate some revenue at around $1500 each.
Safe trading, and remember your risk management.

#ES_F Day Trading Prep Week 4.28 - 5.03Last Week :
Last week Globex opened inside the Value of 5086 - 4925 Range and right away found buying that started pushing us towards VAH. RTH gave us a push out of Value and holds above brought in more buyers to give us pushes to the Edge and attempts at Previous Ranges VAL/Value area but that move was sold back down towards the Edge and back under 5086 brought in the weakness needed to make a push back inside lower range towards VAH which looked promising for continuation since we were under Supply and under Settlement ranges but instead we failed to accept in Value pushed back to the Edge and end of day Spike pushed us over VAL where we spent Friday filling out that area of singles over VAL in a tighter distribution Range after failing to get back under 5112.05 - 07.50.
This Week :
Going into this week we have retail month end to finish up the month, we have new month starting and lots of data dropping this week as well. Our question this week is will we find acceptance back in this 5227 - 5066 Ranges Value ? are there actually bigger buyers in that Spike base to keep us up and start balancing here and continue filling out this VAL / Mean / VAH area ? Area over 5144 still has Single Prints above which are Supply and Volume trapped above them. Or maybe more selling will come in to give moves back under VAL to fill out that Spike Base to see if there are still buyers in that Edge or if we will start working our way under it towards the Value where we were able to transact through the whole thing and put in Time and Volume ?
Friday we tried to make a push over 5144 - 40.25 which was 5159 - 5107 Intrarange Resistance but failed the few attempts and stayed withing the ranges Mean of 5144 - 5125.
If we are to accept in this range and 5112.50 - 07.50 will keep acting as support then we can look to keep trading this current Intraday range of 5159 - 5107 and IF we continue holding over 5129 - 25 we could eventually get enough buying to try and fill out those single prints up to the Key Resistance. We would need to get through 5159.25 - 54.25 to see any higher prices with moves towards above VAH.
If the buying here is not strong and we just continue building up Supply around this current mean and can't fill the single prints up to the Key Resistance above or fill but fail to accept over then we can look for a return back towards the VAL and see a test of that 5112.50 - 07.50 area, if buying at that Spike base doesn't hold then we can see a move back towards the Edge to fill that Spike Base out and test the Edge again to see if there is still buying or if we will get back under the Edge and head for Previous Value.
With lots of news and data it could be a tricky week, Friday ended very slow after volatile action, will the slow theme continue this week ? If so need to be very patient letting things properly set up and show Failures or strength at levels before trying to catch the moves. Market is trying to find a range to start balancing in, I feel like 5086 - 4925 is the HTF Range market wants to be in and our destination is still lower but how fast or slow it will get moving there is the question and for now we are over the Edge which is telling us otherwise while we are inside 5182 - 15 Value... but just something to keep in mind if we don't find acceptance needed in here.
Levels to Watch :
Current Range 5159.25 - 5107.50
Key Levels for Continuation out 5159.25 - 54.25 // 5112.50 - 07.50
Means 5144 - 40.25 // 5129 - 25
If Accept Below Targets Spike Base and move back to Edge
Means 5095.50 - 92.50 // 5081 - 77.75
Key Area 5065.75 - 60.75
If holds current range and accepts over Key Resistance, above range is 5204.25 - 5154.25
Means 5188.25 - 84.50 // 5174.25 - 70.50
Key Resistance 5204.25 - 5199.75
IF Find ourself back under 5086 - 66 Edge watch out for continuation towards VAH / Mean and VAL of 5086 - 4925 Range.
