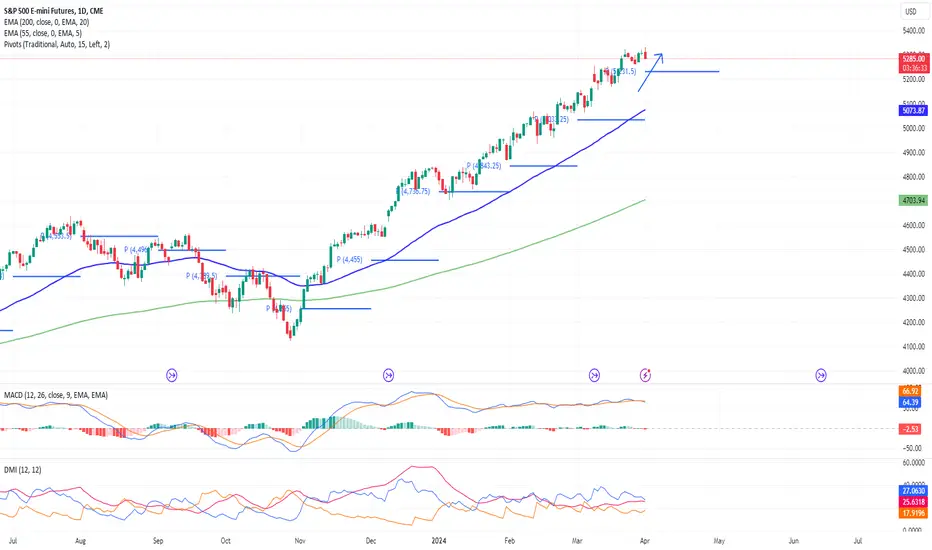
ESZ2018 trade ideas
Options Blueprint Series: Calendar Spreads - Timing the MarketIntroduction to Calendar Spreads
Calendar spreads, also known as time spreads or horizontal spreads, are advanced options strategies that involve buying and selling two options contracts on the same underlying asset, such as the S&P 500 Futures, but with different expiration dates. The strategy aims to profit from the differing time decay rates of the short-term and long-term options. Traders often deploy calendar spreads to capitalize on expected stable or sideways market conditions.
Why S&P 500 Futures Options for Calendar Spreads?
The S&P 500 index, encapsulating the performance of 500 of the largest companies listed on stock exchanges in the United States, serves as a premier gauge of U.S. equities. Its derivative products, notably the S&P 500 Futures Options, present traders with a fertile ground for executing calendar spread strategies. These options inherit the index's broad market exposure and liquidity, making them an ideal candidate for such strategies. Let's delve into the contract specifications and characteristics that make S&P 500 Futures Options and Micro Options particularly suited for calendar spreads.
Contract Specifications:
S&P 500 Futures Options (Standard): These contracts are based on the E-mini S&P 500 futures. Each contract represents an agreement to buy or sell the futures contract at a set price before the option expires. The standard option contract size typically mirrors the underlying futures contract, which is valued at $50 x S&P 500 Index.
Micro S&P 500 Futures Options: Introduced as a more accessible variant, Micro S&P 500 Futures Options are 1/10th the size of their standard counterparts. This smaller contract size reduces the capital requirement, making it more appealing for individual traders and those looking to fine-tune their market exposure. The contract size for Micro Options is $5 x S&P 500 Index, maintaining the leverage and flexibility of the standard options but at a scale more manageable for a wider range of investors.
Characteristics Beneficial for Calendar Spreads:
Liquidity: Both standard and micro contracts benefit from high liquidity, ensuring tight bid-ask spreads. This liquidity facilitates easier entry and exit from positions, a critical factor when managing calendar spreads that require precision in timing and the ability to adjust positions quickly in response to market movements.
Volatility Patterns: Understanding and anticipating volatility patterns is crucial for the success of calendar spreads. The S&P 500's inherent volatility, influenced by economic indicators, corporate earnings, and geopolitical events, can affect options pricing and the optimal structuring of calendar spreads.
Strategic Flexibility: The availability of both standard and micro contract sizes provides traders with flexibility in managing their market exposure and tailoring their strategies to match their risk appetite and investment goals.
Incorporating S&P 500 Futures Options into calendar spread strategies not only leverages these inherent characteristics but also taps into the dynamic interplay of time decay and market movements. Traders must, however, remain vigilant of the underlying market conditions and adapt their strategies to align with evolving market dynamics.
Constructing a Calendar Spread
To construct a calendar spread with S&P 500 Futures Options, a trader needs to undertake a series of thoughtful steps. Initially, one must select an appropriate strike price that aligns with their market outlook. Typically, at-the-money (ATM) or slightly out-of-the-money (OTM) options are preferred due to their sensitivity to time decay, which is a pivotal component of this strategy.
Example Setup:
Buying a Long-term Option: Consider purchasing a long-term put option on the S&P 500 Futures with an expiration date 30 days from now. The selection of a long-term option is strategic, as it retains its time value better compared to shorter-term options.
Selling a Short-term Option: Simultaneously, sell a short-term put option on the S&P 500 Futures with the same strike price as the long-term call but with an expiration date 5 days away. This option is expected to lose time value rapidly, which is beneficial for the seller.
As seen on the below screenshot, we are using the CME Options Calculator in order to generate fair value prices and Greeks for any options on futures contracts.
Underlying Asset: S&P 500 Futures (Symbol: ES1! or MES1!)
Strategy Setup:
o Buy 1 OTM put option with a strike price of 5260 (Cost: 44.97)
o Sell 1 OTM put options with a strike price of 5260 (Credit: 7.78)
Net Debit: 37.19 (44.97 – 7.78)
Maximum Profit: Achieved if prices are at 5260 at expiration.
Maximum Risk: Limited to the net debit of 37.19.
The essence of this setup lies in capitalizing on the accelerated time decay of the short-term sold option relative to the slower decay of the long-term bought option. Ideally, the underlying asset's price will be close to the strike price at the short option's expiration, maximizing the profit from its time decay while still benefiting from the long-term option's retained value.
Adjustments for Market Movements:
f the market moves significantly, the spread can be adjusted by rolling the short-term option forward to the next month, potentially locking in gains or reducing losses.
A successful calendar spread hinges on precise timing and a keen understanding of volatility. The trader must monitor the implied volatility of the options, as an increase in volatility can enhance the spread's value, while a decrease can diminish it.
Potential Market Scenarios and Responses
Optimal Market Condition : The calendar spread thrives in a market exhibiting minimal price movement, particularly around the strike price of the options involved in the spread. This stability allows the trader to exploit the differential time decay effectively.
Market Moves Against the Position : In the event of adverse market movements, the trader might need to adjust the strategy. This could involve rolling the short option to a different strike or expiration date, or possibly closing the position early to mitigate losses. Flexibility and proactive risk management are paramount, as market conditions can change rapidly.
The construction and management of a calendar spread with S&P 500 Futures Options involve a delicate balance of market prediction, timing, and risk management. By judiciously selecting strike prices, expiration dates, and adjusting in response to market movements, traders can navigate the complexities of calendar spreads to seek profit from the nuances of time decay and implied volatility in the options market.
Risk Management
Effective risk management is crucial when trading calendar spreads, particularly with S&P 500 Futures Options, due to the potential for rapid changes in market conditions. Identifying and mitigating potential losses involve several strategies:
Position Sizing: Keeping each trade to a reasonable proportion of the total portfolio reduces the impact of any single trade's loss. Diversification across different strategies and assets can also help manage systemic risks.
Stop-Loss Orders: Implementing stop-loss orders for the position can help limit losses. This is especially important if the market moves sharply in an unexpected direction, affecting the spread unfavorably.
Continuous Monitoring and Adjustments: The calendar spread requires regular monitoring and potential adjustments to respond to changes in the underlying asset's price or volatility. This may involve rolling out the short position to a further expiration date or adjusting strike prices to better align with the market conditions.
Hedging: In some scenarios, traders might consider using additional options strategies or the underlying futures contracts themselves to hedge against significant market moves. This approach can help protect the portfolio from large, unexpected shifts in the market.
Conclusion
Calendar spreads offer a sophisticated strategy for traders looking to profit from the nuances of time decay and volatility in the options market, particularly with S&P 500 Futures Options. This strategy suits those with a nuanced understanding of market movements and the patience to monitor and adjust their positions over time. While calendar spreads can offer attractive opportunities for profit, especially in sideways markets, they also require diligent risk management and an active trading approach.
Encouraging further education and risk-aware trading practices is essential for success in options trading. Traders should continually seek to expand their knowledge of market conditions, options strategies, and risk management techniques to refine their trading approach and better navigate the complexities of the financial markets.
By embracing a disciplined approach to trading calendar spreads, investors can explore the potential of this strategy to enhance their trading arsenal, leveraging the dynamic nature of S&P 500 Futures Options to tap into market opportunities while managing the inherent risks of options trading.
When charting futures, the data provided could be delayed. Traders working with the ticker symbols discussed in this idea may prefer to use CME Group real-time data plan on TradingView: www.tradingview.com This consideration is particularly important for shorter-term traders, whereas it may be less critical for those focused on longer-term trading strategies.
General Disclaimer:
The trade ideas presented herein are solely for illustrative purposes forming a part of a case study intended to demonstrate key principles in risk management within the context of the specific market scenarios discussed. These ideas are not to be interpreted as investment recommendations or financial advice. They do not endorse or promote any specific trading strategies, financial products, or services. The information provided is based on data believed to be reliable; however, its accuracy or completeness cannot be guaranteed. Trading in financial markets involves risks, including the potential loss of principal. Each individual should conduct their own research and consult with professional financial advisors before making any investment decisions. The author or publisher of this content bears no responsibility for any actions taken based on the information provided or for any resultant financial or other losses.

RTH gap closes ESLarge RTH gaps have a tendency to be closes quickly! This is the third time I seen a gap close in the last week.
Remember check the RTH after before the NY open.

Breakout & RetracementIn overnight action ES gives us another example of retracement after a breakout.
don't give in to FOMO

Double Distribution Entry On SP500 [ESM24]LVN entry in-between double distribution of the SP500 .
This entry has a 2.51 RR potential with just 10 point SL and 103 points TP.
Trade will be executed on both ESM24 and MESM24.
Most ideal place for and early exit or TP1 would be the top of the VRVP
If trade fails and price gaps down through the Low volume area, then the next potential good entry will be around the POC of the lower distribution at 5285.25.
If that fails as well, then the chance for a bigger dump down to the next LVN below goes up.

ES: will the bottom half of the year see turmoil?So far, S&P 500 is playing out the way it should. Wave 3 of 3 of 3 should be nearly complete. It can top out here or can hit 5400- 5450 before the minute wave 4 correction. End of April and early May should see the minor degree wave 4 correction that could bring a decent 5% to 7% downturn. But, the big one could be in the bottom half of the year. depending on where things get topped out for primary wave 3, we could see a near recession or even a slight recession style 18% to 25% downturn that could last up to a year. It will be really interesting to see how rate cuts play into the narrative and how the crypto markets react during this downturn. If we are indeed in a massive ending diagonal pattern to end the super cycle for S&P 500, then we should see another all time high after the big correction that could take things to 7000 to 7200 before heading into the lost decade. My guess is late 2026. We shall see....

ES 4H AnalysisNYSE:ES is currently stronger than NQ, consistently making higher highs and higher lows. Typically, after each high and low, ES retraces within that range, finds more buyers, and continues the trend. At present, we haven't retested the previous higher high at 5257, so I'm not interested in longs until we have a defined retest of the prior higher high, or zones below it within the bullish structure. If we surpass 5322 and maintain it as support, this could present favorable long opportunities.

LEARN MARKET PROFILE WITH NEW TPO CHARTSThe newish TPO charts are a great representation of the thory of Market Profile. TPO charts give you an idea of when buyers are stepping in and when a move up or down is running out of steam. Here is my take on last week's ES and how I will go into Monday.
Since the spike on 3/20 Fed meeting, the market has been in a balance from 5322.75 down to 5263 and all of last week occured in this range, establishing an inside week. When using Market Profile methodology, inside days (or weeks) are like a spring and when it breaks out in either direction its an actionable event. The charts are telling me the way we are going is up and I'll explain why.
Within this chart we have three spikes, which are telling when viewed through the context of Market Profile. A "spike" is a move at the end of the day that doesnt have enough time to establish itself as an accepted level or not. When a market trades for two periods at one price level it is considered "acceptance" and infers that the market participants have agreed on that level as a fair price. In terms of spikes, this acceptance or rejection of price levels happens the next day. The 3/20 spike up was accepted on 3/21 and prices have not returned to below the spike since. In fact, we had a chance to go down when we spiked lower on Tuesday the 26th. The next day we traded in the spike for a while so there was a chance at acceptance. But it never filled the spike and in fact went above it. When the price moves away from the spike the level is rejected. The move above the spike base is rejection and a buy signal. After this rejection on the 27th we had a spike up as demand was strong in the afternoon. Thursday the 28th we accepted the spike, signifying fair value at the higher levels.
Going into Monday, we have accepted prices near the all time highs and we are primed to break out of the inside week. As time accrues at the higher levels the base continues to be strengthened. If we break above the old high and stay up there for multiple periods, it's bullish and we should look for range extension to the upside.
Many traders are not familiar with Market Profile or TPO charts, but now that they are officially on Tradingview, give them a chance. I think they have a lot of value. They don't tell always tell you exactly when to trade but they improve your knowledge of the structure of the market. I am planning on putting up charts and observations from time to time on here, so if you are looking to learn Market Profile give me a follow or visit my website. I welcome feedback or if you just want to connect and share ideas.

S&P500 Analysis of June contracts , Monthly buyside liquidity has been taken in past weeks . Daily FVG is still holding the bullish scenario. number of news events occuring this week will keep the market volatile.

ES1! morning updateBull vs. bear counts for ES1!. Bull count has ES1! in wave 5 of 3 of 3 of 3 of 5. Wave 5 should (or has already) complete below 5443.75, with expected pullback towards 5100-5200 area. Bear count has ES1! in wave 5 of C of Y of B, with market top below 5443.75 and wave C of primary wave 4 incoming (bottom projected below October 2022 low, above 3000).

Expanded Flat Consolidation Fun little thesis i denoted with fib extensions that would lead us up to november election

Trading Plan for Monday, April 1st, 2024Trading Plan for Monday, April 1st, 2024
Market Sentiment: Cautious, price discovery ahead of reopening after long weekend
Weekly Volatility Risk: High (price discovery holiday, heightened with geopolitical backdrop)
Supports to Watch:
Immediate Supports: 5307 (major), 5299-5302 (major), 5293, 5287 (major), 5280, 5275 (major), 5270, 5261, 5267, 5252 (major), 5245-47 (major), 5234, 5230, 5222 (major), 5217, 5212 (major), 5207, 5202, 5186-5191 (major), 5176, 5165-67 (major).
Resistances to Monitor:
Key Resistances: 5311, 5316 (major), 5321, 5326, 5329-30 (major), 5337, 5342, 5347 (major), 5351, 5355, 5358 (major), 5362, 5372, 5382 (major), 5389, 5396-5400 (major), 5407 (major), 5412, 5425, 5430, 5435-38 (major), 5445, 5451 (major)
Trading Strategy:
Price Discovery: After the long weekend, anticipate market moves as price discovery unfolds. Prioritize patience and focus on reacting to price action rather than predicting.
Consolidation Range: Be aware that the 5300-5320 zone is a new consolidation range, likely to see choppy price action. Overtrading in this zone can be detrimental.
Long Opportunities: Exercise caution with long entries over the weekend. If 5299-5302 is retested, consider bids, or, for additional confirmation, wait for the failed breakdown setup (below overnight and daily lows, then reclaim) Below that, only the major levels are of interest for longs.
Short Opportunities: Counter-trend shorting on strength carries significant risk. Use extreme caution if considering shorts near major resistances. Watch for signs of a breakdown or retracement for better risk/reward entries.
Focus on Reactions: Don't force trades, be patient, and react to price action.
Bull Case
Support Holds: As long as supports like 5299-5302 hold, bulls maintain short-term control.
Range Trading: ES could consolidate within the 5302-5320 range, potentially ping-ponging within it.
Breakout Continuation: A decisive break and hold above 5320 could lead to a surge towards 5329-30, then 5347. Reclaims of 5307 are areas to potentially add to longs, with disciplined profit-taking.
Bear Case
Breakdown Signals: Breakdown below 5299-5302 could trigger selling pressure. Watch for shorting opportunities on failed breakdowns or bounces. Exercise patience as these setups often involve traps.
News: Top Stories for March 29th, 2024
Global Humanitarian Crises: Focus on the UNHCR appeal for aid for South Sudanese refugees, the ICJ measures for Israel, the humanitarian situation in Haiti, and the youth mobilization around the UN Summit of the Future.
Climate Change Impacts: Examine the effects of climate change on Nepal's biodiversity and the resilience of communities in Madagascar despite gender-based violence.
Economic Updates: Analyze the latest inflation data from the Fed's preferred PCE price index, Huawei's financial results, and Syngenta's cancellation of its Chinese IPO.
Fed Policy Outlook: Consider Fed Chair Powell's commentary and the impact of the LEI on potential economic growth and the Fed's approach to interest rates.
Market Sentiment: Assess market volatility surrounding the PCE report and potential risks.
Remember: The market is undergoing price discovery. Be adaptable, manage risk, prioritize capital preservation, and always prioritize reacting to price action over any predictions.

a daily price action after hour update - sp500Good evening and i hope you are well.
sp500 e-mini futures
bull case: Bulls got the more up but barely. The high today was 3 points below the ath and that qualifies as a double top. Do we trade down from here? I don’t know. If bulls can keep it above 5300, it’s as bullish as it gets. Many support lines below on the chart and bears not doing enough to make bulls take profit. If bulls can close this quarter at the highs again, consider me dumbstruck again.
bear case: Pullback was shallow as expected. Unexpected was the selloff into the close again. My thesis was, this is profit taking end of quarter and i expect more trading range price action tomorrow. If the low probability case happens and we see bigger profit taking, it could actually become a big pullback from near the ath. But i will only look for shorts when we close a 1h big red candle below 5300.
short term: Neutral going into last trading dax of the quarter. Absolutely everything is on the table for tomorrow, from melt up 5400 to big profit taking to 5280.
medium-long term: Below 5200 i keep my bearish thesis as drawn (weekly outlook). above we can go much higher before down. we could also range above 5000 for many months without going nowhere. I expect earnings to become weak in this quarter but could take next one as well. —unchanged
trade of the day: Buy near 5300 and sell above 5312 , worked since yesterday late in US session.

AMDX OR XAMDThe market can be viewed in cycles.
A- Accumulation
M- Manipulation
D- Distribution
x- R/C reversal or contiuation
then it repeats.

ES updateInflation numbers tomorrow, MFI will go overbought Monday regardless of which way it gaps.
Staying cash for now, since I missed the big pump yesterday afternoon.

Trading Plan for Thursday, March 28th, 2024Trading Plan for Thursday, March 28th, 2024
Market Sentiment: Cautious
Weekly Volatility Risk: High
Supports to Watch:
Immediate Supports: 5307, 5302, 5296-5299 (major), 5293, 5288 (major), 5284, 5280, 5274 (major), 5268-70 (major), 5265, 5258 (major), 5245-47 (major), 5240, 5235 (major), 5230, 5217, 5213-16 (major), 5208 (major), 5203, 5190-93 (major), 5178-76 (major), 5171, 5165 (major), 5155-58 (major), 5147, 5143, 5136, 5123-26 (major).
Resistances to Monitor:
Key Resistances: 5311, 5316 (major), 5320, 5326, 5336, 5342 (major), 5346, 5351 (major), 5360, 5364, 5372 (major), 5380-83 (major), 5388, 5395, 5403 (major), 5413, 5425-30 (major), 5445 (major)
Trading Strategy:
Price Discovery: After a strong surge, the market is in price discovery mode. Prioritize patience and focus on reacting to price action rather than predicting.
Long Opportunities: Exercise caution with after-hours long entries: prioritize profit preservation on your existing long runner. Consider bids at 5296-5299 for a backtest, or, for additional confirmation, wait for the 5274-70 zone to be tested and reclaimed. Below that, only the major levels are of interest for longs.
Short Opportunities: Counter-trend shorting on strength after a strong move carries significant risk. Use extreme caution if considering shorts near major resistances. Watch for signs of a breakdown or retracement for better risk/reward entries.
Focus on Reactions: Don't force trades, be patient, and react to price action.
Bull Case
Support Holds: As long as supports like 5299-96 and the crucial 5274-70 zone hold, bulls maintain short-term control.
Breakout Continuation: A decisive hold and test of 5299-96 could lead to a surge towards 5316, 5320, 5326, with 5342 as the first major target.
Bear Case
Breakdown Signals: Breakdown below 5267-70 could trigger selling pressure. Watch for shorting opportunities on failed breakdowns or bounces. Exercise patience as these setups often involve traps.
News: Top Stories for March 28th, 2024
U.S. Economy Outlook: Analysts provide insights on the U.S. economy's resilience, potential for soft landing, and the Fed's possible rate adjustments in late 2024.
Stock Market Performance: The S&P 500's recent gains, fueled by strong corporate earnings and optimistic investor sentiment.
Global Economic Updates: Updates on the economic conditions of the Eurozone, the U.K., and emerging markets, including growth projections from Vanguard.
Corporate Earnings Updates: Focus on financial results and guidance from companies like Sharecare, Janover Inc., and Medigene AG.
Stock Market Trends: Wall Street's positive reaction to the Fed's recent dovish comments and expectations for continued market gains. Review Indian equity market performance.
F&O Ban List: Securities facing F&O ban and their potential impact on trading activity.
Market Forecasts: Analyze market sentiment, gold and Bitcoin price trends, and potential cybersecurity investments.
Remember: The market is undergoing price discovery. Be adaptable, manage risk, prioritize capital preservation, and always prioritize reacting to price action over any predictions.

ES - Ying YangDollar index correlation with ES does not hold the same weight as euro and cable but occasionally, when Dollar rallies, ES struggles to trend upwards.
5285 highest FVG displacement is me going for a lowest hanging fruit with 5287.25 being my overall target for the week.
5311.75 intermediate term highs is where I will draw the boundaries with my short bias. I expect 5285 to be met before (if any) retracement to 5311.75
My philosophy is simple...
Fortify Michael J Huddlestone's concepts that I have studied to consistently predict where the market is more likely to go.
This includes;
- Market Structure
- Buyside/Sellside Liquidity
- Order Blocks
- Liquidity Voids
- Fair Value Gaps
- Optimal Trade Entry
- Premium/Discount Array
- SIBI/BISI
- Many More!
The strategies mentioned here are some of many that I use to implement into my analysis and over time, with consistency I aim to achieve a high degree of accuracy in the markets with the foresight and understanding to assess what went wrong when my bias is negated.
Credits;
- Michael Joe HUDDLESTONE
- Shawn Lee POWELL
- Toray KORTAN

$spx geometric progressionpotential geometric progression for $spx since 2009 rally with flat 2018/2020 as mid point

New Trade on SP500 Using Same StrategyHere is an example of a trade setup with this system that I am taking.
It took 4 days for market to enter trade alert zone at 50% retracement level.
Market open 6:00p EST check charts found trade setup.
buy 5266
stop 5230
This is not financial advice and remember always use risk management!
Trade Well,
Clifford

RTH DAILY OPENNG GAPThe Market tries to maintain balance. So remember to check the RTH Range in the morning. Large gaps have a tendency to be filled quickly,

ES UpdateCrazy market, Euros with the pump again. Bailed on my AAPL puts for a loss, made it back day trading AFRM puts.
I think I'm just gonna day trade for a few days, there's just crazy rotations everywhere. Today AAPL is up and NVDA is down, lol. QQQ went red. Nuts.
I have no idea what the market is doing, not gonna post until inflation numbers come out Friday. Note that Friday is a holiday.


Trading Plan for Wednesday, March 27th, 2024Trading Plan for Wednesday, March 27th, 2024
Market Sentiment: Cautious
Weekly Volatility Risk: High
Supports to Watch:
Immediate Supports: 5266 (major), 5258, 5247 (major), 5242, 5233-36 (major), 5221, 5213, 5206-10 (major), 5198, 5188-91 (major), 5181, 5172, 5167-69 (major), 5162, 5153-55 (major), 5146, 5137, 5126 (major), 5119 (major), 5109
Resistances to Monitor:
Key Resistances: 5274 (major), 5281, 5286-88 (major), 5293, 5299 (major), 5305 (major), 5311, 5315, 5318-20 (major), 5328, 5336-38 (major), 5345 (major), 5354, 5365 (major), 5372, 5380 (major), 5392, 5399 (major), 5408 (major), 5416 (major), 5425, 5432, 5440-44 (major), 5448, 5457 (major)
Trading Strategy:
Support & Resistance: Watch for potential bounces on support levels 5266, 5247 (triangle backtest), or a deeper pullback to 5242. For shorts, look higher towards 5286-88 or the 5299 zone after a strong move up.
Long Opportunities: Consider longs only on strong reactions to support levels, ideally with confirmed failed breakdowns for added safety.
Short Opportunities: If considering shorts, strong moves up followed by signs of weakness near resistance zones could be potential areas.
Focus on Reactions: Be adaptable – volatility can create opportunities and traps with equal measure.
Bull Case
Support Holds: As long as supports like 5266, then particularly the triangle backtest at 5247 hold, bulls maintain short-term control.
Breakout potential: A decisive breakout above the flag pattern's resistance around the 5300 zone could lead to a surge towards 5318-20 and potentially new highs.
Bear Case
Breakdown Signals: Breakdown below 5266 followed by continued selling could trigger a move downwards. Look for potential shorting opportunities on failed breakdowns or bounces with extremely tight stops due to FOMC volatility. .
News: Top Stories for March 27th, 2024
Regulatory Response to Bank Runs: Federal Reserve and regulatory officials prepare to announce new rules designed to prevent future bank crises, addressing lessons learned from last year's turmoil.
Economic Outlook: Recent CPI data, comments from industry leaders and analysts provide insights into inflation trends, monetary policy expectations, and the global economic outlook.
Market Performance and Expectations: A cautious outlook for 2024 due to various factors including geopolitical risks and monetary headwinds.
Corporate News: Updates on legal settlements, management changes, and stock market debuts affecting companies like Visa, Mastercard, Boeing, and Truth Social.
Legal Issues in Crypto: U.S. prosecutors file criminal charges against KuCoin exchange and its founders.
Currency and Interest Rates: Tracking movements in the Japanese Yen and potential actions by the Swedish Riksbank.
