ES1 to $5,500An inverse head and shoulder has been completed, and I will be expecting a price change to around $5,500.
ESZ2014 trade ideas

Could we have bottomed early?Local maximums don't tend to follow the pattern of respecting overextensions like minimums do. This is mostly based on the positive bias people have of the future. Seeing a close this strong is a strong enough sign for the indicator of short term trend to become positive. If this is true then we should start pushing to new high, but if the market does so it risk overextending again but with the coming elections one could expect for the incumbent party to try to inflate stocks to have strong image heading into the polls. But by doing so it creates a high risk of over estimulation which could result in a time of euphoria followed by a crash. It's been 4 years since the 2020 crisis. The mode for recessions is every 3 to 4 years. If technicals begin to overextended and fundamentals to keep up, we might be headed to a new crisis. Technicals need to reset before going forward.

S&P 500 $ES EoM ReviewAll-time highs booked @ $5,368.25 before a minor retracement below the 13th May 24 lows.
Area of interest:
Buystops: $5,368.25
Sellstops: $5,205.50, $5,166.50

Lean and Prep 6.5.24ES Trade Plan
Inflection: 5297
Upper lvls: 5325 / 5344 / 5358
Lower lvls: 5272-5280 / 5252 / 5226
NQ Trade Plan
Inflection: 18656
Upper lvls: 18831-18859 / 18916-18951 / 19049
Lower lvls: 18596 / 18570-18591 / 18471 / 18310-18341
Stay Frosty!

Live Trade Analysis on MNQ Using PO3, FRVP, Goldbach and ICTHello traders,
Today, I'm excited to share a detailed analysis of a live trade I executed on the Micro E-mini Nasdaq 100 (MNQ) futures market. This trade exemplifies the fusion of several advanced trading concepts: PO3, Fixed Range Volume Profile (FRVP), Goldbach, Inner Circle Trader (ICT) methodologies, and Fair Value Gaps (FVG). Let's dive into the trade, the rationale behind it, and the results.
Setting the Stage
PO3 (Power of Three)
PO3 is a concept that identifies three key phases in market movements: Accumulation, Manipulation, and Distribution. Recognizing these phases helps traders anticipate market moves and identify optimal entry and exit points.
Fixed Range Volume Profile (FRVP)
The FRVP is a powerful tool that shows the volume distribution over a specific range of price data. It helps in identifying high volume nodes (HVNs) and low volume nodes (LVNs), which serve as potential support and resistance levels.
Goldbach
Goldbach's trading strategy revolves around statistical probabilities and mathematical models to identify high-probability trade setups. It complements other technical analysis tools by adding a layer of probabilistic insight.
Inner Circle Trader (ICT) Concepts
ICT concepts emphasize understanding market structure, liquidity, and order flow. Key elements include liquidity pools, market maker buy/sell models, and institutional order flow.
Fair Value Gaps (FVG)
FVGs occur when there is a price gap between consecutive bars, indicating areas of potential liquidity. These gaps often serve as magnets for price, offering opportunities for reversals or continuations.
The Trade
Market Context
Today's trade setup began with a thorough analysis of the MNQ market during the pre-market hours. Using the PO3 concept, I identified the accumulation phase as the market consolidated within a tight range. This was followed by a brief manipulation phase, marked by a false breakout to the downside, which quickly reversed.
Volume Profile Analysis
Using the FRVP, I identified significant volume clusters that aligned with the accumulation zone. The highest volume node (HVN) within this range acted as a critical support level. Conversely, the low volume nodes (LVNs) highlighted potential areas of resistance where the market might struggle to break through.
Goldbach and ICT Confluences
I overlaid Goldbach's probability models onto the existing market structure, which provided additional confirmation of the high-probability zones identified by the FRVP. ICT concepts further reinforced these levels by highlighting liquidity pools and likely institutional activity.
Identifying the Fair Value Gap (FVG)
During the manipulation phase, a noticeable FVG formed as the price swiftly moved down and then reversed. This gap indicated an area where price was likely to return, providing a prime entry opportunity.
Execution
Entry
I entered the trade as the price retraced to the FVG, aligning with the HVN identified by the FRVP. The confluence of these factors—volume profile support, FVG, and the probabilistic edge from Goldbach—provided a robust entry signal.
Management and Exit
The trade was managed using a trailing stop approach, initially set below the HVN to protect against adverse moves. As the price moved in favor of the trade, I adjusted the stop to lock in profits, eventually exiting at a significant resistance level identified by the LVN on the FRVP.
Results and Reflection
The trade concluded with a solid profit, showcasing the power of combining multiple advanced trading concepts. The integration of PO3, FRVP, Goldbach, ICT, and FVG provided a multi-faceted approach that significantly enhanced the trade's success probability.
Key Takeaways
Confluence is Key: Combining multiple concepts and tools increases the reliability of trade setups.
Volume Profile Insight: The FRVP is invaluable for identifying support and resistance levels based on actual market participation.
Liquidity Awareness: Understanding liquidity pools and gaps helps anticipate market movements and avoid traps.
Mathematical Edge: Goldbach's probabilistic models add a quantitative layer to traditional technical analysis.
This trade is a testament to the effectiveness of a well-rounded trading strategy that leverages diverse methodologies. I encourage fellow traders to explore these concepts further and integrate them into their own trading plans for enhanced performance.
Happy trading,
Lord MEDZ

ES OverNight Price Action REview 6-5-24Going over Price Overnight sEession. we are basing in a 20 pt range. not much to do but wait for the market to put in a setup. no setup/no trade Wednesday. keep working hard. always remember to eliminate what isnt working and double down on what is working.

ES poised to go higherIt looks like are going into a 5th wave complex, in trend, and impulsive.
looks at this time that the 4th wave i s complets, sideways correction
we will see

#ES_F Day Trading Prep Week 06.02 - 06.07Last Week :
Last week market opened up outside of Value, build some more supply then started the correction lower, we were able to move down to VAL where we found our first Support where we were able to do some covering but eventually we broke, held under and go continuation towards the Lower Edge, we were able to test its bottom where we ran out of Supply and got a sharp reversal back inside Value for a big move from VAL to VAH.
This Week :
Going into this week if we look at Structure we can see we did a look below VAL and fail which gave a return trip to VAH which we tagged, build more supply under and Failed which gave another round trip back to VAL and this time we tagged Key Support at 5249.75 - 44.75 and it acted as proper Key Support giving another big bounce all the way back towards Key Area and as we can see end of day push over 5295.50 - 90.25.
Globex consolidated over Key Area but was not able to hold and we got a flush back inside the Means of 5295.50 - 44.75 Range. This to me screams balance, and I think market will want to stay around these areas going forward until we will build up enough supply to accept under VAL or get stronger buyers to give us acceptance over VAH.
My bias is that we might not see higher prices over 5320-40s for some time but of course we never know and have to trade what market gives, for now I believe this current intraday range can finally become our balance range which we haven't gotten in some time, we have been moving ranges back and forth without spending too long in each and I think its about time we get some good balance action that can last a while.
The way I will be trading this we have our intraday range means at 5279.25 - 75.25 // 5264.75 - 60.75 this is the area where price might want to keep returning back into, pushes out of them can go towards the Key Edges of 5295.50 - 90.25 as our Resistance and 5249.75 - 44.75 but this is the time to be careful with looking perfect tags or too much continuation outside of Key Edges because if we have found balance we will look for any pushes out of the Means to return back either from failures at/above/below Key Support/Resistance or we could even see pushes out of means that will consolidate above/below without tagging Key Edges and then return back in, and when price is between this will be our balance/build up area.
Will continue trading this range until we can see clear acceptance Over or Under Key Support/Resistance and holds over/under VAH/VAL.
Levels to Watch :
Current Range 5295.50 - 5244.75
Means 5279.25 - 75.25 // 5264.75- 60.75
Key Resistance 5295.50 - 90.25
Key Support 5249.75 - 44.75
IF we do happen to leave balance and accept under/over the ranges would be
Above :
5341 - 36 Key Resistance
5324.75 - 20.75 // 5310.50 - 06.50 Means
5295.50 - 90.25
Below :
5234.25 - 30.25 // 5219.75 - 15.75 Means
5204.25 - 5199.75 Key Support

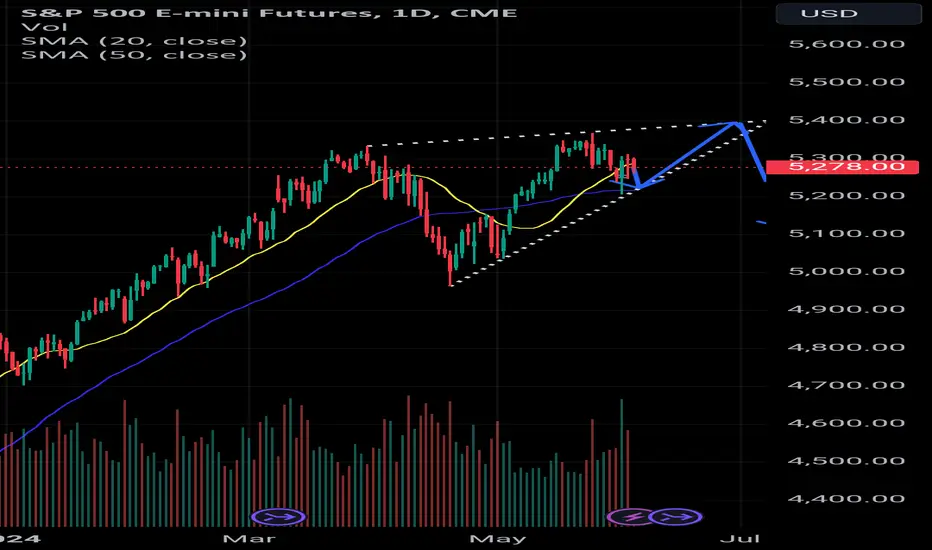
Watching for Make or Break?Watching carefully the blue horizontal line. If it doesn't break, I am almost certain to claim that a downtrend will be begin.


Rising wedge on the S&PWith the rejection of lower prices at the trend line, the S&P appears to be in a rising wedge at what I assume is the end of the uptrend. With FOMC meeting on the 12th, it could be the catalyst for more volatility. But with the VIX broken and a seemingly endless bull run, it is prudent to expect another wrench to be thrown into the fray before July. I'm watching for the pattern to complete by July 5th as of now.

AMP Futures - Volume Footprint Chart typeIn this video we will demonstrate how to use the NEW Volume footprint chart type.

AMP Futures - Volume Candles Chart typeIn this video we will demonstrate how to access the NEW Volume candles chart type with TradingView.

Hey traders, it's Lord MEDZ here! In today's videoI'm excited to walk you through a fantastic trade I executed earlier on the Micro Nasdaq Futures (MNQ). Utilizing the ICT Fair Value Gap (FVG), Order Block (OB), and Market Structure Shift (MSS) strategies, I managed to achieve an impressive 11:1 risk-reward ratio within just 20 minutes, all during the New York power hour. We'll dive deep into the 15-second timeframe to break down every detail of this trade. Stay tuned to see how I leveraged these powerful tools to maximize my gains. Let's get into it!

AMP Futures - Time Price Opportunity (TPO) chart typeIn this video we will demonstrate how to access the NEW Time Price Opportunity (TPO) chart type using TradingView.

ES1! afternoon updateThree examples of the .618 fib holding support since the low of 4963.50.
Bulls certainly seem intent on getting SPX to 6000. I think that as long as buyers are entering at and holding support at technical levels, no reason to doubt we see 6000 by the end of the year.

The Mechanics Of Trading - Part X - EOD 2 Min ES RecapPart X - End Of Day 2 Min ES Recap
I started this video because a friend asked me for help determining trends on multi-interval (time frames) and asked how I look at trading across multiple intervals. Asking how to best setup/use price trends to capture the best trade setups.
Essentially, it comes down to three key components...
A. Initial reversal/impulse waves should be traded lightly (if at all). They are the "potential price reversal setups" that are usually the most dangerous for traders (and often fairly short in length).
B. Looking for the second wave to form provides traders with the opportunity to catch the bigger Wave-3. This wave forms after the impulse (Wave-1) and a corrective wave (Wave-2), which must stay below any previous ultimate high or above any previous ultimate low.
C. Wave-3, and Wave-5 if applicable, are where traders can flex their muscles related to trade size using the techniques I present to try to capture the MEAT (Sweet Spot) of any trend.
Remember, after Wave-3, you must prepare for the potential end of a trend setup where volatility is likely to increase and risks become a bit more elevated.
I go over multiple techniques in this video.
Fibonacci techniques and Fibonacci Price Theory
Anchor Bars (breakaway bars)
Using Fibonacci Retracements to identify key support/resistance levels for trending
Stochastics
RSI
Wave formations (ZigZag)
and Others
This video is designed as an instructional video to help you incorporate usable techniques into your own trading style.
Hope you enjoy.

The Mechanics Of Trading - Part IX - ES Breakdown To SupportPart IX
I started this video because a friend asked me for help determining trends on multi-interval (time frames) and asked how I look at trading across multiple intervals. Asking how to best setup/use price trends to capture the best trade setups.
Essentially, it comes down to three key components...
A. Initial reversal/impulse waves should be traded lightly (if at all). They are the "potential price reversal setups" that are usually the most dangerous for traders (and often fairly short in length).
B. Looking for the second wave to form provides traders with the opportunity to catch the bigger Wave-3. This wave forms after the impulse (Wave-1) and a corrective wave (Wave-2), which must stay below any previous ultimate high or above any previous ultimate low.
C. Wave-3, and Wave-5 if applicable, are where traders can flex their muscles related to trade size using the techniques I present to try to capture the MEAT (Sweet Spot) of any trend.
Remember, after Wave-3, you must prepare for the potential end of a trend setup where volatility is likely to increase and risks become a bit more elevated.
I go over multiple techniques in this video.
Fibonacci techniques and Fibonacci Price Theory
Anchor Bars (breakaway bars)
Using Fibonacci Retracements to identify key support/resistance levels for trending
Stochastics
RSI
Wave formations (ZigZag)
and Others
This video is designed as an instructional video to help you incorporate usable techniques into your own trading style.
Hope you enjoy.

The Mechanics Of Trading - Part VIII - Learning PatiencePart VIII
I started this video because a friend asked me for help determining trends on multi-interval (time frames) and asked how I look at trading across multiple intervals. Asking how to best setup/use price trends to capture the best trade setups.
Essentially, it comes down to three key components...
A. Initial reversal/impulse waves should be traded lightly (if at all). They are the "potential price reversal setups" that are usually the most dangerous for traders (and often fairly short in length).
B. Looking for the second wave to form provides traders with the opportunity to catch the bigger Wave-3. This wave forms after the impulse (Wave-1) and a corrective wave (Wave-2), which must stay below any previous ultimate high or above any previous ultimate low.
C. Wave-3, and Wave-5 if applicable, are where traders can flex their muscles related to trade size using the techniques I present to try to capture the MEAT (Sweet Spot) of any trend.
Remember, after Wave-3, you must prepare for the potential end of a trend setup where volatility is likely to increase and risks become a bit more elevated.
I go over multiple techniques in this video.
Fibonacci techniques and Fibonacci Price Theory
Anchor Bars (breakaway bars)
Using Fibonacci Retracements to identify key support/resistance levels for trending
Stochastics
RSI
Wave formations (ZigZag)
and Others
This video is designed as an instructional video to help you incorporate usable techniques into your own trading style.
Hope you enjoy.

The Mechanics Of Trading - Part VII - 2 Min ES TrendingPart VII - Applying Success/Failure & Fibonacci Price Theory
I started this video because a friend asked me for help determining trends on multi-interval (time frames) and asked how I look at trading across multiple intervals. Asking how to best setup/use price trends to capture the best trade setups.
Essentially, it comes down to three key components...
A. Initial reversal/impulse waves should be traded lightly (if at all). They are the "potential price reversal setups" that are usually the most dangerous for traders (and often fairly short in length).
B. Looking for the second wave to form provides traders with the opportunity to catch the bigger Wave-3. This wave forms after the impulse (Wave-1) and a corrective wave (Wave-2), which must stay below any previous ultimate high or above any previous ultimate low.
C. Wave-3, and Wave-5 if applicable, are where traders can flex their muscles related to trade size using the techniques I present to try to capture the MEAT (Sweet Spot) of any trend.
Remember, after Wave-3, you must prepare for the potential end of a trend setup where volatility is likely to increase and risks become a bit more elevated.
I go over multiple techniques in this video.
Fibonacci techniques and Fibonacci Price Theory
Anchor Bars (breakaway bars)
Using Fibonacci Retracements to identify key support/resistance levels for trending
Stochastics
RSI
Wave formations (ZigZag)
and Others
This video is designed as an instructional video to help you incorporate usable techniques into your own trading style.
Hope you enjoy.

Day Trade Using Event Contracts - E-mini S&P Futures Discover trading techniques with Anthony Crudele! 📈 Learn how to leverage CME Group's Event Contracts like 0DTE Options for day trading E-mini S&P Futures on the month's first trading day.

The Mechanics Of Trading - Part VI - 2 Min ES ChartPart VI
I started this video because a friend asked me for help determining trends on multi-interval (time frames) and asked how I look at trading across multiple intervals. Asking how to best setup/use price trends to capture the best trade setups.
Essentially, it comes down to three key components...
A. Initial reversal/impulse waves should be traded lightly (if at all). They are the "potential price reversal setups" that are usually the most dangerous for traders (and often fairly short in length).
B. Looking for the second wave to form provides traders with the opportunity to catch the bigger Wave-3. This wave forms after the impulse (Wave-1) and a corrective wave (Wave-2), which must stay below any previous ultimate high or above any previous ultimate low.
C. Wave-3, and Wave-5 if applicable, are where traders can flex their muscles related to trade size using the techniques I present to try to capture the MEAT (Sweet Spot) of any trend.
Remember, after Wave-3, you must prepare for the potential end of a trend setup where volatility is likely to increase and risks become a bit more elevated.
I go over multiple techniques in this video.
Fibonacci techniques and Fibonacci Price Theory
Anchor Bars (breakaway bars)
Using Fibonacci Retracements to identify key support/resistance levels for trending
Stochastics
RSI
Wave formations (ZigZag)
and Others
This video is designed as an instructional video to help you incorporate usable techniques into your own trading style.
Hope you enjoy.
