RTH DAILY OPENNG GAPThe Market tries to maintain balance. So remember to check the RTH Range in the morning. Large gaps have a tendency to be filled quickly,
ESZ2019 trade ideas

ES UpdateCrazy market, Euros with the pump again. Bailed on my AAPL puts for a loss, made it back day trading AFRM puts.
I think I'm just gonna day trade for a few days, there's just crazy rotations everywhere. Today AAPL is up and NVDA is down, lol. QQQ went red. Nuts.
I have no idea what the market is doing, not gonna post until inflation numbers come out Friday. Note that Friday is a holiday.


Trading Plan for Wednesday, March 27th, 2024Trading Plan for Wednesday, March 27th, 2024
Market Sentiment: Cautious
Weekly Volatility Risk: High
Supports to Watch:
Immediate Supports: 5266 (major), 5258, 5247 (major), 5242, 5233-36 (major), 5221, 5213, 5206-10 (major), 5198, 5188-91 (major), 5181, 5172, 5167-69 (major), 5162, 5153-55 (major), 5146, 5137, 5126 (major), 5119 (major), 5109
Resistances to Monitor:
Key Resistances: 5274 (major), 5281, 5286-88 (major), 5293, 5299 (major), 5305 (major), 5311, 5315, 5318-20 (major), 5328, 5336-38 (major), 5345 (major), 5354, 5365 (major), 5372, 5380 (major), 5392, 5399 (major), 5408 (major), 5416 (major), 5425, 5432, 5440-44 (major), 5448, 5457 (major)
Trading Strategy:
Support & Resistance: Watch for potential bounces on support levels 5266, 5247 (triangle backtest), or a deeper pullback to 5242. For shorts, look higher towards 5286-88 or the 5299 zone after a strong move up.
Long Opportunities: Consider longs only on strong reactions to support levels, ideally with confirmed failed breakdowns for added safety.
Short Opportunities: If considering shorts, strong moves up followed by signs of weakness near resistance zones could be potential areas.
Focus on Reactions: Be adaptable – volatility can create opportunities and traps with equal measure.
Bull Case
Support Holds: As long as supports like 5266, then particularly the triangle backtest at 5247 hold, bulls maintain short-term control.
Breakout potential: A decisive breakout above the flag pattern's resistance around the 5300 zone could lead to a surge towards 5318-20 and potentially new highs.
Bear Case
Breakdown Signals: Breakdown below 5266 followed by continued selling could trigger a move downwards. Look for potential shorting opportunities on failed breakdowns or bounces with extremely tight stops due to FOMC volatility. .
News: Top Stories for March 27th, 2024
Regulatory Response to Bank Runs: Federal Reserve and regulatory officials prepare to announce new rules designed to prevent future bank crises, addressing lessons learned from last year's turmoil.
Economic Outlook: Recent CPI data, comments from industry leaders and analysts provide insights into inflation trends, monetary policy expectations, and the global economic outlook.
Market Performance and Expectations: A cautious outlook for 2024 due to various factors including geopolitical risks and monetary headwinds.
Corporate News: Updates on legal settlements, management changes, and stock market debuts affecting companies like Visa, Mastercard, Boeing, and Truth Social.
Legal Issues in Crypto: U.S. prosecutors file criminal charges against KuCoin exchange and its founders.
Currency and Interest Rates: Tracking movements in the Japanese Yen and potential actions by the Swedish Riksbank.

looking for shortsprice seems to be looking for liquidity to gain strength to push down. I am using the fib to find optimal trade discounts.

ES1! evening updateBullish count (in green) has us working on wave 5 of 3 of 3 of 3. Bear count (in red) has us completing wave 5 of C of Y of B. Both counts have upper limit of 5443.75 for validity. Bullish count would have wave 4 of 3 of 3 complete in the 5100-5200 area. Bearish count is looking for a market top.

ES updateIndicators neutral, not much of an MFI pump so far. Maybe RSI needs to hit oversold before we get the next pump.
Market appears more afraid of missing the next pump than it is of the next dip. I don't recommend shorting anything. If in doubt, just go cash, and buy when RSI hits oversold. BTFD, don't fight the Fed, Powell is in complete pump mode.
Lots f garbage stocks up today, BYND and PTON are at the top of my board along with crap like W, NET, AFRM, LPSN. That pretty much tells you everything you need to know.
I only recommend doing options when indicators hit oversold or overbought, right now indicators are neutral. I suppose you could gamble on a garbage stock and hope for a short squeeze, like maybe BYND. Not really my thing though (but I have done it before).


Trading Plan for Tuesday, March 26th, 2024Trading Plan for Tuesday, March 26th, 2024
Market Sentiment: Cautious, consolidation after rally
Weekly Volatility Risk: High
Supports to Watch:
Immediate Supports: 5274-76 (major), 5267, 5263 (major), 5257, 5247-51 (major), 5243, 5235, 5228 (major), 5221, 5217, 5212, 5200-03 (major), 5194, 5190 (major), 5179, 5171, 5167 (major), 5163, 5152-55 (major), 5147, 5137, 5126 (major), 5115 (major).
Resistances to Monitor:
Key Resistances: 5281, 5288 (major), 5292, 5299-5303 (major), 5307, 5311, 5316 (major), 5320, 5329, 5337 (major), 5346, 5351, 5356 (major), 5364, 5371, 5380, 5386 (Major), 5392, 5408 (major), 5416, 5426, 5434-37 (major), 5443-5446 (major).
Trading Strategy:
Tight Range: Be prepared for continued choppy trading within the range defined by the multi-day flag structure. Trade with caution and focus on range-bound strategies or consider sitting out.
Flag Structure: Observe the bull flag structure with support around 5274-76 and resistance near 5288 and the 5300 zone. A decisive breakout or breakdown could provide a clearer directional signal.
Long Opportunities: Look for potential long entries at 5274-76, particularly after a retest and reclaim. If this level fails, be extremely cautious about longs and consider bids only at major support levels like 5263 and 5247-51 (triangle back-test). Watch for failed breakdowns for added confirmation.
Short Opportunities: Counter-trend shorting on strength carries significant risk, particularly within the flag structure. Use extreme caution if considering shorts near 5288 or the 5300 zone. Watch for signs of a breakdown or retracement for better risk/reward entries.
Focus on Reactions: Don't force trades, be patient, and react to price action. Let price discovery unfold within this consolidation pattern.
Bull Case
Flag Breakout: A breakout above the bull flag resistance around 5288 and further above 5300 could signal a continuation of the uptrend, targeting 5316, 5338, and ultimately 5350+.
Support Holds: As long as 5274-76 holds, the bulls remain in short-term control. Look for potential add-on points if a breakout occurs, preferably after acceptance or a failed breakdown.
Bear Case
Breakdown Signals: Breakdown below 5274-76 could trigger selling pressure. Watch for shorting opportunities on failed breakdowns or bounces. Exercise patience as these setups often involve traps.
News: Top Stories for March 26th, 2024
GameStop Earnings: Focus on the GameStop earnings report and its potential impact on the stock market and meme stock sentiment.
Federal Reserve Updates: Stay informed about the Federal Reserve's interest rate plans and their impact on market sentiment, particularly concerns about a potential market crash.
Global Economic Developments: Monitor updates on economic conditions in Germany, the U.S. housing market, and the China-U.S. trade dispute.
U.S. Economy: Analysis of the U.S. economy's resilience, and the implications for the Fed's possible rate cut plans.
Stock Market Performance: Track stock market movements, including updates on the Sensex, the Nifty, and the impact of new home sales data in the U.S.
Banking and Regulations: Examine the impact of Basel III regulations on the APAC banking sector and the outlook for emerging markets.
U.S. Fiscal Policy: Consider the CBO's warnings about rising U.S. federal debt and the increasing cost of debt servicing.
Remember: The market is consolidating after a strong rally. Be adaptable, manage risk, prioritize capital preservation, and always prioritize reacting to price action over any predictions.

a daily price action after hour update - sp500 e-mini futuresGood evening and i hope you are well.
I was totally already writing the update with the most annoying small trading range price action in mind (obviously not the dax) but then the bears used the power hour to extend the range downwards. If anything i’d guessed we close near the open. Interesting going into tomorrow and if bears can generate follow through or at least keep bulls below the lower highs.
sp500
bull case: Still a rather weak bear flag and daily 20ema is still 50 points away. If the bulls are still eager and strong, they wont let the gap close to 5250 or let the market reverse Wednesday’s breakout. If we trade below, i expect them to buy more strongly around the lower bull trend line 5220ish. I do think the sell off into the close today was unexpected.
bear case: If bears fail to generate follow through tomorrow, market for sure will retest 5324. If we get follow through, next targets are 5250 and 5220. There is a less than 5% chance that the market will break this bull trend line on the next touch. Best bears can probably get is a trading range 5250 - 5324. Measured move from the bear bar into the close is around 5240, which is also where the trend line could be, depending on the time we arrive there.
short term: Neutral - means sideways. If bears won’t step it up, we retest 5300 and higher. Invalid below 5220. Then next would be the bull trend line (depending when we reach 5230) and below that is 5200. —unchanged
medium-long term: Below 5200 i keep my bearish thesis as drawn (weekly outlook). above we can go much higher before down. we could also range above 5000 for many months without going nowhere. i expect earnings to become weak in this quarter but could take next one as well.
trade of the day: Deadly price action for your account if you gamble and are not comfortable with small trading ranges. I think the odds from bar 17 to today’s 7, were clearly bullish and bar 8-11 was just a pullback. I think market was expecting to trade above 13+14 again because the range was so tight and the bull leg before was strong enough for a retest 5300+. That could be a reason why 17 was so strong, many traders cought on the wrong side and quickly gave up. How do you trade it? Either you are good a small scalps or don’t trade it at all. Other possibility could have been, you were short from bar 8 or at least short from above 5290, then you could have hold just into close. But who is short from there, when market is clearly bullish.

Possible downward channel MESI like this look here on the 15 minute chart short at the top of this downward channel could bring in a nice bit of profit

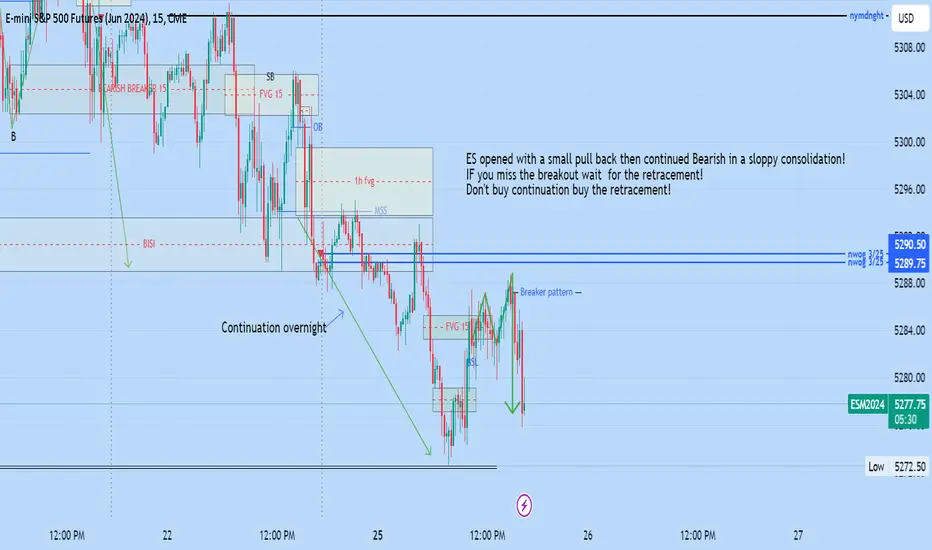
Wait for the retracementIf your late or miss the breakout be patience and wait for the retracement.
don't chase price.1

bullisj Shift in ESICT's Market Structure Shift
the shift is created by the when 2 short term lows (stl) form with an Intermediate low (itl) in between.
Anticipate higher prices.

NY AM Session Silver Bullet NY AM Session Silver bullet setup!
8:30 candle displaces creating a market structure shift
and creating a FVG on the 5 min chart.
Price then retest the 5 min. FVG (time distortion)
until 9:45 then displaces offering 10 handles.
Textbook 2022 model setup.

ES continues Bearish ES continued bearish after reaching the breaker target friday afternoon. NY AM session provided a retracement and another breaker for a late afternoon short.

compare two chartsThis is a tripple thrust pattern. After 5 waves UP, we get a series of lower highs, then a bear 5th wave down.

Trading Plan for Monday, March 25th, 2024Trading Plan for Monday, March 25th, 2024
Market Sentiment: Cautious, watching key support levels after the rally
Weekly Volatility Risk: High
Supports to Watch:
Immediate Supports: 5284-88 (major), 5276, 5259 (major), 5245-48 (major), 5236, 5230, 5219-21 (major), 5213, 5208, 5200-5197 (major), 5191, 5186, 5177, 5168-71 (major), 5163, 5155, 5145 (major)
Resistances to Monitor:
Key Resistances: 5295, 5302 (major), 5307 (major), 5313, 5320, 5328 (major), 5338, 5348 (major), 5355, 5363-66 (major), 5380, 5389, 5396-5400 (major), 5412, 5428 (major), 5438-42 (major), 5450, 5460-63 (major)
Trading Strategy:
Choppy Range: Be prepared for potential choppiness within the 5302-5288 range. Trade with caution and focus on range-bound strategies if this pattern persists.
Flag Structure: Observe the bull flag structure that has formed since Thursday. A decisive breakout or breakdown could provide a clearer directional signal.
Long Opportunities: Look for potential long entries at 5284-88, particularly after a retest and reclaim. If this level fails, be extremely cautious about longs and consider bids only at major support levels like 5259 and 5245-48 (triangle back-test).
Short Opportunities: Counter-trend shorting on strong up moves carries significant risk. Use extreme caution if considering shorts near major resistances. Watch for signs of a breakdown or retracement, and focus on 5307 and potentially 5348 if we get that far.
Focus on Reactions: Don't force trades, be patient, and react to price action. Let price discovery unfold after the rally.
Bull Case
Flag Breakout: A breakout above the bull flag resistance around 5307 could signal a continuation of the uptrend, targeting 5320, 5338, then 5348.
Support Holds: As long as 5284-88 holds as support, the bulls remain in short-term control. Look for potential add-on points if 5307 breaks out, preferably after acceptance or a failed breakdown.
Bear Case
Breakdown Signals: Breakdown below 5284 could trigger selling pressure. Watch for shorting opportunities on failed breakdowns or bounces. Exercise patience as these setups often involve traps.
News: Top Stories for March 25th, 2024
Federal Reserve Updates: Analysis of the Fed's latest interest rate decision, economic projections, and implications for future monetary policy. Focus on how market expectations for rate cuts in 2024 may have shifted, and the continued focus on inflation data.
Inflation and Economic Data: Discussion of the latest CPI figures, job market data, and their potential impact on the Fed's approach to managing inflation.
Market Reactions: Examine how global markets have reacted to the Fed's decisions, including equity indices, treasury yields, and the dollar's performance.
Global Economic Outlook: Updates from Vanguard on economic expectations, contrasting the U.S. with trends in the Eurozone and U.K.
Lessons from Bank Failures: Reflect on the lessons learned from recent stress in regional banks and discuss implications for the financial system's overall stability.
Energy Transition: Analysis of the challenges and opportunities in the electrification of energy markets.
Stock Market Sentiment: Review market sentiment after the Fed decision and the potential for near-term changes.
Remember: The market might be consolidating after a strong rally. Be adaptable, manage risk, prioritize capital preservation, and always prioritize reacting to price action over any predictions.

S&P Now Retraced 50% of the FOMC Breakout The index has now retraced 50% of the FOMC daily breakout... The 50-61% retracement is typically considered the buy zone.
Do buyers step in here, or will price offer a full retest of the prior breakout point near 5255?
That is the main watch early this week.

Buckle Your Seatbelt for a Market CorrectionCME: E-Mini S&P 500 Options ( CME_MINI:ES1! )
Last week, investors cheered as the Fed Chair reinforced that interest rate cuts are coming despite hot inflation readings in the last two months. For the full week, the Dow was up by nearly 2% in its best week since December 2023. The S&P was higher by 2.3% and the Nasdaq jumped 2.9%. The three major US stock indexes are on track to positive gains five months in a row.
Bull Market Carries on Despite Fed Hold
This is the fifth time that the Federal Reserve kept the Fed Funds rate unchanged at the 5.25%-5.50% range. The last of 11 consecutive rate hikes occurred in July 2023.
There are only eight FOMC meetings left in 2024. However, investors are pricing in at least three rate cuts by the end of the year.
According to CME Group’s FedWatch Tool, the probability of a 25-bp cut in June is 75.5%. There is a 77% chance that Fed Funds move to 4.50%-4.75%, indicating three rate cuts. Four rate cuts, which will be a full percentage point lower, is priced at 43% probability.
(Link: www.cmegroup.com)
Bullish investors pushed major assets up in the first three months of 2024:
• Bitcoin is up 48% year-to-date, while Ethereum is up 44%;
• S&P 500 gained 10.5% YTD, while Nasdaq 100 advanced 11.1%;
• Gold broke new record and was up 4.7% YTD;
• Dollar Index is up 2.2% YTD.
In my opinion, rate cut assumptions are too aggressive. This Fed is known to be highly data dependent. The Fed Chair had said that upticks of CPI data two months in a row did not change his assessment of inflation trending lower. However, if CPI continues to beat expectations, the Fed Chair may very likely correct his assumptions.
The timing of the first rate-cut is highly uncertain. CPI data in March could be a breaking point, setting the direction for interest rates for the rest of the year. Even if rate cut occurs as expected, the Fed would likely take it slowly, pausing to evaluate the lagging impact.
Therefore, the number of rate cuts could also be significantly fewer than market expectations. Recall that a few months ago, investors were pricing in six to eight rate cuts in 2024. Even though their expectations have been halved, I think they are still too aggressive. In my opinion, we could see one or two rate cuts this year. Any upticks in inflation could push rate cut into 2025.
Trading with E-Mini S&P Options
The Bureau of Labor Statistics (BLS) is scheduled to release March CPI data on April 10th. We could build an event-driven strategy focusing on this data release. If CPI data comes in strong, US stocks could face a major correction as investors lower their expectations for Fed cuts.
CME Group E-Mini S&P 500 Options provide leverage and capital efficiency. Options are based on futures contracts. Contract notional is $50 x S&P 500 Index.
On March 22nd, the June futures contract (ESM4) is quoted 5,289.75. The out-of-the-money (OTM) call strike 5,100 represents a 3.6% discount on the current market price. It is quoted at 63. To purchase put options, a trader would need to pay a premium upfront for $3,150 (= 63 x 50). Hypothetically, if the index moves down to 5,000, the put strike would be 100 points in-the-money (= 5100 – 5000). The trade will gain $5,000 (= 100 x 50). Considering the upfront premium, the theoretical return on our put strategy will be 58.7% (= 5000/3150 – 1).
If the market moves against the trade, with the index value staying above the strike, the trade will lose money, limited to the upfront premium.
Options traders could find CME’s Options Calculator a valuable tool in structuring their options strategies. The best part, it is free.
www.cmegroup.com
Happy Trading.
Disclaimers
*Trade ideas cited above are for illustration only, as an integral part of a case study to demonstrate the fundamental concepts in risk management under the market scenarios being discussed. They shall not be construed as investment recommendations or advice. Nor are they used to promote any specific products, or services.
CME Real-time Market Data help identify trading set-ups and express my market views. If you have futures in your trading portfolio, you can check out on CME Group data plans available that suit your trading needs www.tradingview.com

ES Weekly Levels (Mar25-28)Encouraged by a positive economic outlook and dovish signals from the FOMC, investors are diversifying beyond tech giants like NVDA & META. Confidence in the economy's resilience and the Fed's inflation management has broadened the market rally. Although the Mag 7 stocks continue to dominate XLF and XLE are near ATH and XLI remains strong. Small caps, which have lagged brutally look poised to play catchup. The SPX has gained 27% since late October, while NDX has gained 30%. We have a shorted trading week ahead with markets closed on Good Friday. Traders will look for clues for market direction from some Fed head speeches and PCE data at the end of the week
SUMMARY
ES posted a weekly gain of 2.05% after trading in a wide range of 141 pts.
ES recovered the previous 2 weeks losses with a 121 rally and made a new ATH.
R2 = ATH (5322)
R1 = HTF 1.13 Fib X (5294)
S1 = 9 ema (5247)
S2 = 21 ema (5198)
Bias remains long but potential for rejection at ATH and 1.13 Fib X
Break below upward trendline would signal potential trend change.
Positive reation to FOMC. Dovish Fed + OK economy
Mag 7 had strong week minus AAPL & TSLA
XLE & XLF near ATH and XLI continuing to showing strength.
All dips are being bought
Shortened trading week & end of month
PCE on Thurs/Fri
Small caps on breakout watch again
RSI 65.65| VIX at 13.05 | 10 year 4.20%

ES Bearish Breaker reaches initial target STD 1The ES bearish breaker pattern that setup during the PM NY session. Began its run down at 12:30 and continued into the close. After consolidating during the Asian and London sessions overnight. ES continued it's bearish run during the NY AM session offering 2 textbook ICT entries.
1st opportunity = OTE entry pattern. Entering the OTE strike zone @ 6:45 am and then offering a short for 17 handles.
2nd entry - ICT's 2022 model (silver bullet) during the NY am session. Price retraces the 6:30 run into the FVG at 9:30 am and runs down reaching the bearish breaker target of 5289. (offering 12 handles)

ES UpdateMFI heading down but RSI isn't moving much. That's an indication of a melt up. Closed my AAPL puts right after open, I was hoping for a gap down and didn't get it.
Anyways, just a dip today, and small caps made a much bigger dip. Will go long when MFI hits oversold, probably Monday
