Buyers showed up on FridayBuyers return to the market on Friday in the S&P 500. The challenge is can they follow through on Monday. This is the action that you would be looking for if indeed momentum is building on the buy side.
ESZ2014 trade ideas

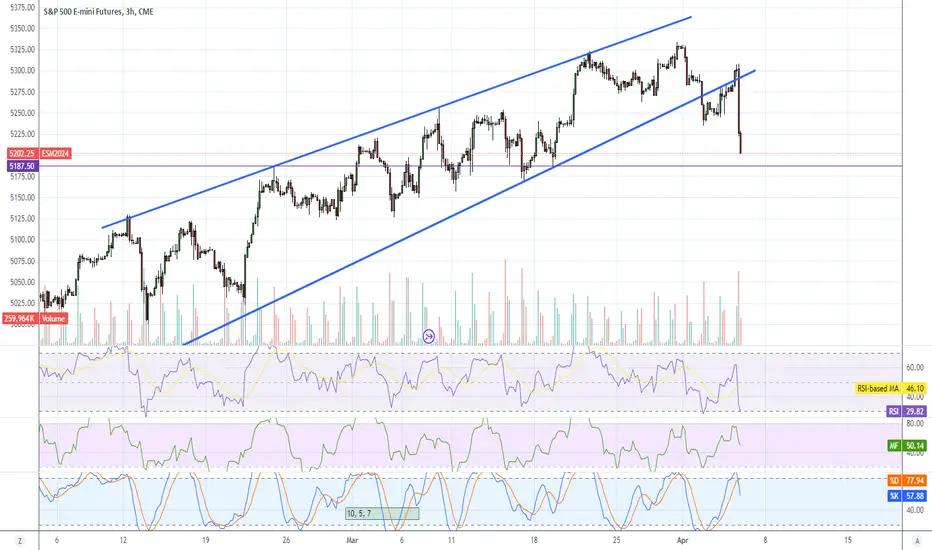
ES1! S&P500 PREPARE NEXT WEEK - IMPORTANT PRICE POINTS - DAILYThanks a lot you the likes, really appreciate! It is not financial advice just recreational trading idea sharing
____________________________________________________________________
- 5332.5: price point identified as potential optimal entry for short direction trade. Depends on the velovity of the market when if hitting that price point again.
- 5168.75 to 5190.75: probable important zone where the price can pullback up or break with strength.
- 4938.25: Possible down important price point as we can only look behind and in prices lower than the actual price. Above the actual price it is not possible to see where the market can go. So market will do what it has to do if evolving above 5332.5 .
- Some other zone down there but it is not to analyze yet has there is too many important price points above it.
Probably observing what the market does from Monday to Wednesday and see which entries can be done on Thursday/Friday for next week.

current charting of es hourlyi look for break out and break down lines. these are identified by pivot points below a line that support and ultimately a large break out, or pivot points above a line that support followed by ultimate large failures when the line breaks. these lines become resistance and support.
note todays plunge on nfp and where it found support. the light blue lines are all break down lines with origin at nov lows. i expect these break down lines are at play now with the two larger selling events.

Market Recap: Trading The AntiIn this video, I go over the possible trades in the day. I also discussed why I didn't take some trades and what trades I did take. Spoiler alert, the one I took was an Anti setup. Below are some characteristics on the day
Yesterday's monster sell-off, price moved toward and sold off at the 50% retracement of yesterday's sell-off.
Slow consolidation in overnight, pre-market action
A bullish pullback setup
A bearish failure test at or near the 50% retracement.
The failure test was followed by 3 strong bearish candles
Anti-pattern setup following the 3 bear candles.

The Pullback Has BegunFor the first time in 2024 the US Stock Market's S&P 500 has shown TWO bearish signs at once this week.
In any given year statistically one can expect 2 or 3 corrections of -5% to -10%. It is now month 4 of 2024 and we are due.
In this video I talk about the two signs (False Breakout Monday, Break and Hold Resistance Thursday) that came together to signal the first possible pullback of 2024.
Get ready!

DAy Review ES NFP 4-5-24Going over the price action after the NFP report. looking for clues and how we should have traded the price action. trying to take our emotions out of the process and using our Brain Power.

SPX500 Futures Mastery: Risk On Market, Risk On ManagementHey Traders,
When you have equity bulls piling into assets like this, your approach has to change.
Taking shorts has further Inherent risk as price is going with momentum.
Therefore, everything has to change within your risk strategy.
Tech/Fund Analysis included.

Don't Short SupportYTD VPOC held nicely as support... A main LOI we had on watch for today
So far price has retraced >61% of yesterday's sell

5204 is a major trend support to watchJob data this morning caused a movement exactly as I anticipated and discussed yesterday. The move lower I suspected came yesterday as I anticipated, so now I'm just looking to see if we can move below this 5204 12hr support line. To date, the 12hr has been the major support level to stop any movement down since November which is why we have not seen a Daily trend change for nearly 6 months.
Trends into today;
Last Macro Trend Signal Spots (ES Contract)
30m - 5248 Downtrend (4/4/2024) Lower Low
1Hr - 5226 Downtrend (4/4/2024) Lower Low
2Hr - 5226 Downtrend (4/4/2024) Lower Low
3Hr - 5197 Downtrend (4/4/2024) Lower Low
4Hr - 5260 Downtrend (4/2/2024) Higher Low
6Hr - 5250 Downtrend (4/2/2024) Higher Low
12Hr - 5204 Downtrend (4/4/2024) Higher Low
Daily - 4378 Uptrend (11/3/2023) Higher High
Weekly - 4769 Uptrend (12/11/2023) Higher High
Monthly - 5304 Uptrend (03/31/2024) Higher High
Overall, I will link my video from yesterday if you want an in-depth analysis on why I predicted we would move lower.
Major thing I've heard, is people are no discussing only 2 rate cuts this year. So again, we went into the year with 6 rate cuts priced into the market. We dropped to 3 rate cuts even though we never REALLY priced out the 3 extra rate cuts, and now we are discussing only 2 rate cuts this year, and the potential of them not coming in June.
Safe trading, and remember your risk management.

Morning Price ACtion Review ES 4-5-24 NFPReviewing the morning Price Action from NFP and looking for clues to what the market is telling us and how we could have managed better.

breaker breaker trade love this setup on the daily.. you can take this setup with your stop right above that high and be content with the trade.

Trading Plan for Friday, April 5th, 2024Trading Plan for Friday, April 5th, 2024
Market Sentiment: Extreme volatility expected due to the recent selloff and NFP data release. Caution and adaptability are crucial.
Important Note: Nonfarm Payrolls (NFP) was released at 8:30 AM (EST). Expect outsized moves and volatility. Avoid predictions, and look for failed breakdowns as potential trade entry points.
Key Supports
Immediate Supports: 5203, 5196, 5190, 5181-84 (major), 5177, 5171 (major), 5163, 5155 (major), 5146, 5142 (major), 5136, 5127 (major), 5115, 5102 (major).
Major Supports: 5171, 5142 (important for long positions), and 5102 (major).
Key Resistances
Near-term Resistance: 5212 (major), 5221 (major), 5230, 5235, 5240 (major), 5250, 5257, 5266 (major), 5274, 5279, 5288 (major), 5294 (major), 5302.
Major Resistances: 5257, 5266 (major), 5288 (major), and 5310 (major).
Trading Strategy
Knife-Catch Mode: Exercise extreme caution and use small position sizes. Longs ONLY at major supports, prioritizing 5181-84, 5171, and especially 5142. Consider longs after a failed breakdown and reclaim.
Bullish Reclaims: If bulls regain 5212, watch for acceptance above this level before adding longs. Target level-to-level profits.
Short Opportunities: Look for back-tests of the 5235-40 zone as potential shorting areas, as it hasn't been fully retested from below.
Bull Case
Support Holds: Bulls need to reclaim 5241 to maintain control and set the low. Moves towards 5265 and 5288 are possible if this occurs. Short-term, reclaiming 5212 is essential.
Downside Magnet: If bulls make a strong move, 5143 is a significant downside target to watch.
Bear Case
Resistance Rejections: If bulls fail to retake 5212, expect a retest and rejection. This could open up a move towards 5194 for potential short entries (only if a bear flag establishes between 5212-5196).
News: Top Stories for April 5th, 2024
U.S. Jobs Report
Strong March jobs report with 303,000 positions added.
Unemployment rate down to 3.8% shows continued labor market resilience.
Impact on Fed's rate decisions uncertain, as wage growth easing.
Corporate News
Johnson & Johnson's $13.1 billion acquisition of Shockwave Medical announced.
Updates on Telecom Italia financing and China Oilfield Services operations.
Market Performance
S&P 500 hits all-time highs in March, strong Q1.
Nasdaq-100 projections point to good performance for 2024, with specific stock highlights.
Global Economic Indicators
Japan monitors volatile Yen movements.
Disappointing German factory data raises slowdown concerns.
India's strong economy leads to stable interest rates.
Energy Sector
Oil dividend stock recommendations for April.
Shell's gas output exceeds guidance.
Monetary Policy & Inflation
Fed remains inflation-focused, considering mid-2024 rate cut.
Developed market inflation expected to ease toward 2024 end.
Geopolitical Concerns
Questions emerge about reliance on U.S. nuclear capabilities.
U.S. strategic moves in managing China's growing power.
Technology & Disinformation
Chinese AI-powered campaigns targeting U.S. voters & Taiwan.
Market Outlook
J.P. Morgan sees a challenging 2024 ahead due to economic slowdown potential.
Overall positive 2024 outlook for U.S. stocks, experts discuss valuations and rate forecasts.
Reminder: Expect high volatility tomorrow due to NFP data and the recent sell-off. Adapt your trading size accordingly (1/4 size recommended). Focus on reacting to price action over any predictions.

Breakfast and PrepMy plan today for SPX levels:
my main pivot point is 5164.
If we open above 5164 and stay above 5164 we can test 5180 with 5185 and 5200. (this is my preferred move at opening, then adjust).
If we open below 5164 and stay below 5164 we can test 5151 with 5145 and 5134.
Stay Frosty!

First Sell/Short Signals since January - TrendsLonger video but hopefully it clarifies my position in the market. I do NOT have a short position yet, but I am looking for one at this point. I might wait until either the close of the day depending on where we are OR take a short position if the overall day goes negative.
Trends into today;
Last Macro Trend Signal Spots (ES Contract)
30m - 5724 Uptrend (4/3/2024) Lower High
1Hr - 5277 Uptrend (4/3/2024) Lower High
2Hr - 5278 Uptrend (4/3/2024) Lower High
3Hr - 5291 Downtrend (4/1/2024) Higher Low*
4Hr - 5260 Downtrend (4/2/2024) Higher Low
6Hr - 5250 Downtrend (4/2/2024) Higher Low
12Hr - 5087 Uptrend (2/22/2024) Higher High
Daily - 4378 Uptrend (11/3/2023) Higher High
Weekly - 4769 Uptrend (12/11/2023) Higher High
Monthly - 5304 Uptrend (03/31/2024) Higher High
In order to try and keep on point I actually wrote some notes for this video (yes, in spite of the length, I felt I really tried to keep on point). What I will do instead of rewriting any of the video is just copy and paste my notes into here.
NYFANG / MAG 7 still pulling market up (down day even though they had gone up .6%)
Economic Calendar
JOLTs was uneventful
NonFarm Employment is up - Job Growth seems good
ISM Non Manufacturing Prices lower - Includes pay being lower
Powell Speaks - Nothing really new
- Wants to cut rates (already priced in)
- Data will drive decision (says that every time)
Today - Jobless Claims (No expectation other than strong job market)
Tomorrow - Unemployment (Not expecting anything new)
- Even if it does, how do you price in this news? Is good bad, or bad good? Good is good?
Trends;
30m, 1hr, 2hr all in lower highs
3hr had a higher low but if uptrend hits, will now be lower high
So 30m to 3hr trends call for lower
4hr, 6hr, 12hr - call for rebound up
Daily is still sitting massively overbought
Weekly is normal bull market signal even if we go lower
Monthly just hit uptrend, but Monthly has NEVER done anything but higher highs and higher lows back to the 80s (no data past that)
For that to change we would have to go below 3846
- EVEN IF THAT HAPPENED, no historical data to explain what that could mean (Must like we saw with the lower low of a weekly trend)
Sell Signals
The shorter term trends are calling for lower movements
Daily uptrend is well, well, well overcooked
MACD Momentum (Daily) has crossed below zero line. Last time we had that was January when I traded shorts several times and made money. Has historically been MOSTLY accurate.
MACD Momentum had a sell signal 3/26 but it was after down days so uneventful
Weekly Overbought RSI/MFI
Buy signals (or at least cautionary flat moving signals)
Trends of 4hr and above call for
MACD itself is not below the zero line (so not a prime bearish / shorting environment)
Hope you found the information helpful. Safe trading, and remember your risk management plan.

ES Price ACtion Review 4-4-24We had a massive Price Move today. Lets review and look for the clues the market was giving us and what we should look for next.

MES Pickup! Solo Miny Chart Wrightdouble down on your MA to get better vission.
The vision is yours as is the world of knowledge. Consider all time frames when making a decision.

MES BUY ZONE? SoloMiny TEMPLATE FTW!Dress up our charts for better vision!
Utilize Both MA to get more analytics.

ES1! evening update(Possible) temporary top looks in. Bulls (in green) looking at zigzag to complete wave 4. Bears (in red) looking for formal impulse wave down.

The stage is setThe stage is set in the S&P 500 for Friday's job report. On Thursday the S&P 500 overreacted to comments made by the Fed presidents. When you have this type of report on Friday, the market reaction on Friday is 50-50.

ES - 15 min chartI talk about pump and dumps all the time, you can see that they did a low volume premarket pump and dumped on volume today.
It's too bad my 3 hr indicator didn't hit overbought on the pump, I was waiting for tomorrow to buy puts, lol.
It's funny how I said yesterday that I had no clue what was gonna happen today. Well, today would've been really hard to predict, that was the largest midday swing in over a year.

Spy/spx heading toward pervious supportSpy heading toward pervious support with the confluence of 200 moving average very good spot in term of risk and reward ratio
Buy weakness sell strength
Keep it simple

ES UpdateWow, RSI hit oversold already. I couldn;t figure out what was gonna happen yesterday, and there's really no way to have predicted this, lol.
We could see a bounce, but I'm not playing it. Staying cash.
ES UpdateSorry, slept in and missed all the fun.
Appears the algos are indeed doing the pump and dump regardless of intraday action. Why pump the market during the day when it's so much easier to do premarket on low volume? (Kinda reminds me of those meme stocks, lol)
Not gonna short anything until it gets overbought on RSI which should happen tomorrow on Ponzi Friday. Just keep in mind that there isn't any rule that says it has to get overbought on RSI, so not going long.
Basically I have no idea which way it gaps tomorrow, foreign markets didn't do much last night, this was mostly a premarket pump. I would assume pump and dump since it's Ponzi Friday tomorrow, but not confident enough to bet on it.
