ES mid day updateRapidly approaching oversold, lol.
Really odd market though, gold and oil gave up the morning pump, it;s like everyone's just going cash, bonds are up. Also, PCAR got the gap fill despite the market, didn't play it because I didn't think the risk was worth a buck movement.
MESU2020 trade ideas

ES UpdateCrap. Reversed at the top channel line and MFI is now overbought.
Rumor is Iran is supposed to start shit this weekend, Europe went up then sold off.

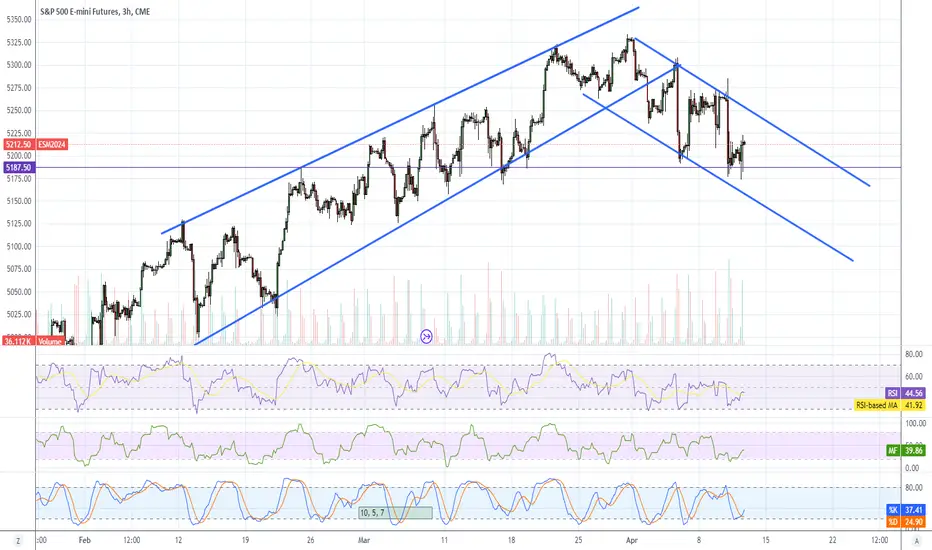
ES breaks IPDA20 LowIPDA (intraday price delivery algo) is yused to anticipate future shifts in the market. The Ipda 20/40 /60 day ranges can predict the seasonal shifts in the market. Today at 12:30 the ES broke the IPDA 20 Day Low. Next target IPDA 40

SPX /ES/NQ Friday ES Trade Plan
Inflection: 5240-5244
Upper lvls: 5287 / 5292-5297 / 5310-5312
Lower lvls: 5220-5232 / 5194 / 5183-5185
NQ Trade Plan
Inflection: 18418
Upper lvls: 18522 / 18605-18610 / 18760-18774
Lower lvls: 18326-18394 / 18265-18274 / 18202
Stay Frosty!

Market Recap: This was a recap for 4/11/2024I completely forgot to record my market recap. My trading journal entries got deleted to the computer restarted. I lost all of my trade entries because I did not save them. Then I proceeded to lose two more trades today. Which is very frustrating.
Anyway, in this video I cover the trades that I took and the one possible setup outside of all of the news.

Trading Plan for Friday, April 12th, 2024Trading Plan for Friday, April 12th, 2024
Market Sentiment: Uncertain, with bulls and bears battling over the key support at 5191 in the red flag pattern.
Key Supports
Immediate Supports: 5200, 5191 (major), 5184, 5178, 5171 (major), 5162.
Major Supports: 5157, 5147, 5123-26 (major), 5103, 5096 (major), 5050-53 (major).
Key Resistances
Near-term Resistance: 5207, 5212 (major), 5230 (major), 5243-46 (major), 5269 (major).
Major Resistances: 5287 (major), 5302-04 (major), 5321 (major), 5352 (major), 5392 (major).
Trading Strategy
Defending the Flag: The red flag pattern with support at 5191 or 5184 remains the key focus. Bulls must defend this zone.
Long Opportunities: Prioritize 5191 bids, but only after reading reactions for signs of defense (ideally, grabs below). A test and reclaim of 5184 could also signal potential for longs. If 5191 fails, consider longs at 5171 or 5157, especially after failed breakdowns of today's lows.
Short Opportunities: If a rally occurs, potential backtests of breakdown levels like 5243-46 and 5269 could be shorting areas. Exercise extreme caution with counter-trend shorts in highly volatile conditions.
Chop Zone Caution: The 5191-5212 zone is currently considered high-risk for overtrading.
Bull Case
Support Holds: Bulls need to defend 5191, ideally with any dips below 5184 quickly reclaimed.
Backtesting Breakdowns: A strong rally could lead to retests of today's breakdown levels of 5230 and 5243-46. A push to flag resistance at 5269 is possible for a breakout.
Adding on Strength: In this choppy environment, it's difficult to identify reliable adding points. Consider 5207 reclaims with acceptance above.
Bear Case
Breakdown Signals: A convincing failure of 5191 opens the door for a deeper downside move. As with ALL breakdowns, be wary of traps – look for a bounce/failed breakdown first, then consider shorts at 5188 (ideally within a trendline structure). Target 5157 on this move, stick to level-to-level profit-taking.
News: Top Stories for April 12th, 2024
Economic Data & Interest Rates
Mortgage rates rise above 7% due to inflation concerns.
High-yield savings accounts offer some protection against inflation.
Mixed signals on the timing of Fed rate cuts.
Earnings & Bank Stocks
Big banks report Q1 results, providing insights into the financial sector.
Focus on JPMorgan Chase, Citigroup, and Wells Fargo.
Market Outlook & Analysis
S&P 500 hits new highs, strong Q1 performance.
April historically a bullish month.
Corporate profits and analyst ratings in focus.
Global Markets
Japan's 5-year bond yield surges.
Singapore's GDP growth remains modest.
Rising concern over global financial fraud and scams.
Reminder: The market remains volatile. Prioritize risk management and adapt your trading strategy accordingly!

CHoCH, BOS(Break of Structure), and Pullback ExamplesCHoCH, BOS(Break of Structure), and Pullback Examples
Multi Timeframe Analysis
Daily ----> 4H
4H ----> 1H
1H ----> 15 min
30m ----> 5m
Market Structure Simplified
"Ultimate Market Structure Course - Smart Money Concepts" by Smart Money Concepts
1. First Step: Find Valid Pullbacks
- Signal Trends
- Valid Breaks
- Reversals
Pullbacks are defined by when a low of a candle is below previous candle low
2. Identify deepest point of pullback
- That will be the unconfirmed low/high
3. Look for BOS or CHoCH to confirm valid lower/higher high or low

SPX futures consolidatingBy the morning and open of regular market friday we should have a new gap down in indices due to futures pullback according to ai projection

But can they follow through?With improving PPI data, buyers returned to the S&P 500 on Thursday. The challenge now will be can they follow through and maintain an upward movement going into the weekend which would be a sign of confidence.

Futures Day Trading with Volume ProfileToday was yet another amazing trade off a long term volume profile level for over 50 points on the CME_MINI:ES1! S&P500 E-mini futures.
I want to document these trades as teachable moments because I think Volume Profile is an absolutely amazing tool that should be in ever trader's toolbox!

ES UpdateLooks to me like it;s headed up for a day at least. PPI numbers were good.
Remember how I said yesterday that it'll be a much easier trade if teh market gaps down? The gap up sold off then the market bounced back. FDAX is oversold so went long but cashing out tomorrow.
PPI Price Action REview ES 4-11-24Going over the price action from the PPI report. looking for clues and trying to listen to what the market is telling us vs imposing our bias's

Trading Plan for Thursday, April 11th, 2024Trading Plan for Thursday, April 11th, 2024
Market Sentiment: Uncertain, as the market continues to digest the hotter-than-expected CPI report and its implications for the Federal Reserve's actions.
Key Supports
Immediate Supports: 5200, 5191 (major), 5184, 5178, 5171 (major), 5162.
Major Supports: 5157, 5147, 5123-26 (major), 5103, 5096 (major), 5050-53 (major).
Key Resistances
Near-term Resistance: 5207, 5212 (major), 5230 (major), 5243-46 (major), 5269 (major).
Major Resistances: 5287 (major), 5302-04 (major), 5321 (major), 5352 (major), 5392 (major).
Trading Strategy
Flag Structure in Focus: The red flag pattern established since the March 31st ATH remains crucial, with support at 5191 (ideal hold) or 5184 being key for bulls to defend.
Long Opportunities: Prioritize 5191 bids, but only after reading reactions for signs of defense (ideally, grabs below). A test and reclaim of 5184 could also be a long signal. If 5191 fails, consider longs at 5171 or 5157, especially after failed breakdowns of today's lows.
Short Opportunities: If a rally occurs, potential backtests of breakdown levels like 5243-46 and 5269 could be shorting areas. Exercise extreme caution with counter-trend shorts in these conditions.
Chop Zone Caution: The 5191-5212 zone is currently considered high-risk for overtrading.
Bull Case
Support Holds: Bulls need to defend 5191 or at least 5184 to maintain control. Spikes below 5184 with rapid reclaims could signal buying strength.
Backtesting Breakdowns: A strong rally could lead to retests of today's breakdown levels of 5230 and 5243-46. A push to flag resistance at 5269 is possible, triggering a breakout.
Adding on Strength: In this choppy environment, it's difficult to identify reliable adding points. Consider 5207 reclaims with acceptance above.
Bear Case
Breakdown Signals: A failure of 5191 opens the door for a deeper downside move. As with ALL breakdowns, be wary of traps – look for a bounce/failed breakdown first, then consider shorts at 5188 (ideally within a trendline structure). Target 5157 on this move, with level-to-level profit-taking.
News: Top Stories for April 11th, 2024
Interest Rates & Inflation
Market adjusts to potential year without Fed rate cuts.
Larry Summers suggests the Fed might raise rates further.
Hotter CPI boosts the US dollar to a 5-month high.
Oil, China & Global Markets
Oil prices on the rise, Bank of America predicts potential $100 per barrel.
China's inflation slows, while US inflation exceeds expectations.
Swiss government proposes tighter bank regulation; concerns remain.
US Labor Market & Stock Performance
Strong US jobs report for March highlights economic resilience.
S&P 500 posts strong Q1 gains.
Banking Regulations & Debt Relief
UBS benefits from less-stringent Swiss banking regulation plans.
US Treasury calls for action on debt relief for developing countries.
ECB Policy & Corporate Earnings
ECB moves closer to a rate cut.
Earnings season focus on big banks and consumer spending.
Reminder: The CPI report has fueled volatility and uncertainty. Prioritize risk management and adapt your trading strategy accordingly!

ES Sp500 DemandES and the sp500 reach a potential pivot zones towards the weekly demand zone. Previously I had drawn the demand zone last year thinking we would never hit it again but we took a little nibble then bounced. I believe this might happen again here with a small zone, not as deep. A touch of 5130 is likely, potentially as deep as 5090.
-I am only buying value stocks in these markets right now
-My larger winners Coin and HMDPF I am letting them simply ride the wave

Eventually, Most Indexes Go to the Same Moving AveragesWith the DJT,RUT,NDX and DJIA at, or under their daily 50 SMA. I would expect the SPX do go down to at least the daily 50 SMA.

Overnight Price Action REview ES 4-11-24Going over the price action Overnight ES looking for clues to what the market is telling us and plan for the day. PPI today @ 830

S&P 500 INDEX UP 9% SINCE THE BEGINNING OF THE YEAR!S&P 500, the key stock index comprising shares of the 500 largest publicly traded companies in the US, showed a growth of 23% in 2023, and has already added 9% since the beginning of this year, as can be clearly seen on the chart.
FreshForex analysts have highlighted the following growth factors:
Stable economic growth in the US and significant corporate earnings.
Shares of the "Fabulous Seven" (companies strongly influencing the index such as #Apple, #Amazon, #Google, #Meta(Facebook), #Microsoft, #Nvidia, and #Tesla) are rising due to the implementation of artificial intelligence. The "Fabulous Seven" represent an interesting idea for long-term investments.
The Fed has again confirmed its readiness for three interest rate cuts, supporting growth in the American stock markets. Investors are eagerly awaiting new signals about the dynamics of interest rates in the US.
Last month, analysts at HSBC and BofA Global Research forecasted that by the end of 2024, the index would reach 5400, while Oppenheimer estimated it at 5500.
Wells Fargo, one of the largest financial companies in the US, forecasted that the #SP500 index will rise to 5535 points by the end of this year. This is the highest forecast among all brokerage firms on Wall Street.
Thus, investors around the world seem to be ignoring the possibility that stock valuations have risen too high against the backdrop of the overall market rally, providing even more opportunities for growth. At the same time, professionals will be monitoring whether Wall Street giants can justify the huge rise in stock prices seen over the past three months.

Fibonacci AnalysisSo after recent volatility in the markets, I decided to plot out a Phi Channel on the Daily HTF and a fib retracement from the low on the daily chart to the most recent high.
5250 is a very sticky psychological level that needs to be broken by the bulls.
I give both my bearish and bullish potential projections here. What the range may look like over the next couple of weeks, I do know that it will be volatile and I expect some consolidation and sideways movement. I am long a SPY Calendar spread at the 525 strike with 9 dte on the short and the next expiration date for the long.
I expect short sellers to take profits on Thursday giving the market a lift, along with retail likely buying the dip, being the Permabulls that they are, at least as represented by wall street bets.
I expect volatility to remain elevated but come down a bit for a day. I think we will consolidate and grind slowly to the upside into the gap on the market profile, I inserted a TPO type chart from ThinkorSwim in an image which shows where the last distributions would indicate a high probably of a slow burn to the upside. Though I predict more downside to come as I believe earnings expectations for some of the largest stocks will be much too high and they will surprise with lower figure than anticipated.

Market Recap: Measure Move Objective Hit But, Nothing To TradeThe market hit that measured move objective that I mentioned in yesterday's market recap. There was a ton of news today with CPI, 10-year Bond auctions, and FOMC members speaking. The market just consolidated after the MM was met. Unless you were a range trader then there wasn't much to trade.

ES Daily UpdateI might play the bounce if we get a big gap down tomorrow with my 3hr chart going oversold, but I think the next big bounce doesn't happen until the daily indicators go oversold.
If you like to play it safe, and you don't watch the market on a daily basis, I suggest waiting a couple of weeks, maybe 3. CPE numbers don't come out until April 26th, which happens to be my birthday so i won't be trading that day, lol.

Catching its breathAfter the dramatic move lower in the S&P 500 on Wednesday, the expectation would be for this market to catch its breath on Thursday. This means another large move lower would not be expected. However, it's important to keep in mind that on Thursday PPI will be released and this could create more dramatic volatility to the downside.

ES Price Action Review CPI 4-10-24Going over the CPI price Action ES looking for clues and what the market is telling us vs imposing our biases on the market.

ES UpdateExpecting indicators to go further oversold before a real bounce. You figure all the idiots that bought yesterday have to sell.
Also, I'm convinced the drop last week was because the numbers leaked out. How hard is it to bribe govt statisticians?
Was tempted to do a gap fill play on PCAR but will wait until tomorrow to go long.
