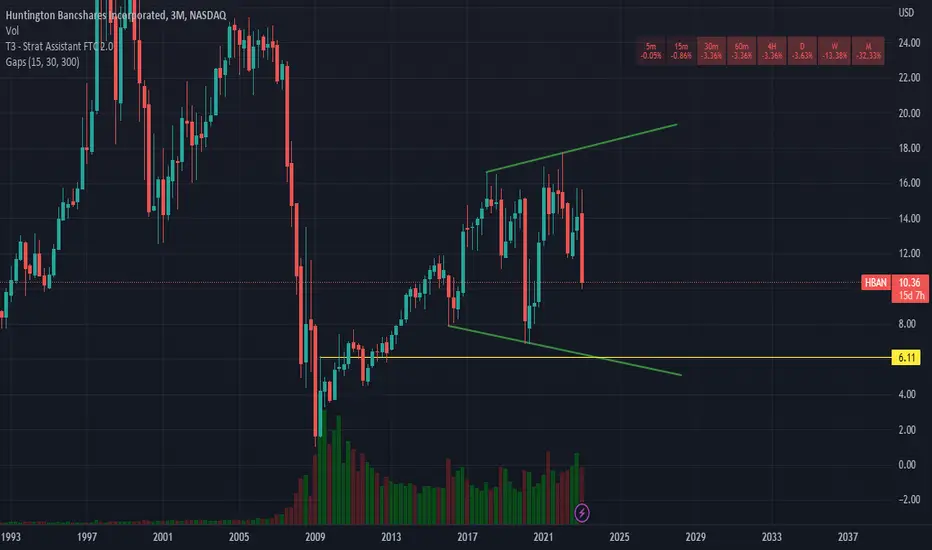
Big Triangle Breakout For Huntington Bank!Nice break out of a long forming triangle. This breakout left a weekly measured move objective and ton of compression with a 2nd entry long setting up.
Next report date
—
Report period
—
EPS estimate
—
Revenue estimate
—
1.05USD
1.95 BUSD
10.78 BUSD
1.43 B
About Huntington Bancshares Incorporated
Sector
Industry
CEO
Stephen D. Steinour
Website
Headquarters
Columbus
Founded
1866
FIGI
BBG000BKWSR6
Huntington Bancshares, Inc. is a bank holding company, which engages in the provision of full-service commercial and consumer deposit, lending, and other banking services. It operates through the following segments: Consumer and Regional Banking, Commercial Banking, and Treasury and Other. The Consumer and Regional Banking segment provides a wide array of financial products and services to consumer and business customers including deposits, lending, payments, mortgage banking, dealer financing, investment management, trust, brokerage, insurance, and other financial products and services. The Commercial Banking segment is involved in expertise through bankers, capabilities, and digital channels, and includes a comprehensive set of product offerings. The Treasury and Other segment focuses on technology and operations, other unallocated assets, liabilities, revenue, and expense. The company was founded in 1866 and is headquartered in Columbus, OH.

$HBAN with a neutral outlook following its earnings #StocksThe PEAD projected a neutral outlook for NASDAQ:HBAN after a negative under reaction following its earnings release placing the stock in drift D with an expected accuracy of 77.78%.

HBAN BULLISH TRIANGLE The daily chart of Huntington Bancshares Incorporated (HBAN) shows a well-formed ascending triangle pattern, indicating potential for further bullish movement, especially if the stock can break through its current resistance zone around $15.00. Here's a detailed analysis based on the key technical s

New Support for Huntington Bank?Huntington Bancshares isn’t an actively traded name, but its chart may have some potentially interesting patterns this week.
First is the level around $12.19, its highest weekly close last summer. HBAN jumped above that price in mid-December before testing it in January and again this month. Old re

$HBAN: Navigating Challenges, Paving the Way for Growth
Huntington Bancshares Incorporated (NASDAQ: NASDAQ:HBAN ) has weathered the challenges of the past year and emerged with a strategic vision for growth. In the recent fourth-quarter earnings call, the financial institution reported a year of increased deposits and loans, showcasing resilience in ma

HBAN Target $11.7A break of the bearish channel could see HBAN test it's long term horizontal resistance at $11.7

HBAN Huntington Bancshares Incorporated Options Ahead of EarningAnalyzing the options chain and the chart patterns of HBAN Huntington Bancshares prior to the earnings report this week,
I would consider purchasing the 110usd strike price in the money Puts with
an expiration date of 2023-10-20,
for a premium of approximately $0.87.
If these options prove to be p

$HBAN Inside broadening formationNot financial advice.
$HBAN Inside broadening formation heading to the lower part of it. Possible support around area of $6
Thank you!
Alex.
Not financial advice.
HBAN looks bullish ☑Beautiful breakout - let's see how this plays out.
For questions feel free to use the comment section down below ... ⬇

$HBAN with a Bullish outlook following its earnings #Stocks The PEAD projected a Bullish outlook for $HBAN after a Positive Under reaction following its earnings release placing the stock in drift A with an expected accuracy of 44.44%.

See all ideas
An aggregate view of professional's ratings.
Displays a symbol's price movements over previous years to identify recurring trends.
H
HBAN5502854
Huntington National Bank 5.699% 18-NOV-2025Yield to maturity
5.70%
Maturity date
Nov 18, 2025
HBAN5411509
Huntington Bancshares Incorporated 5.023% 17-MAY-2033Yield to maturity
5.38%
Maturity date
May 17, 2033
H
HBAN5502855
Huntington National Bank 5.65% 10-JAN-2030Yield to maturity
5.10%
Maturity date
Jan 10, 2030
HBAN4943706
Huntington Bancshares Incorporated 2.55% 04-FEB-2030Yield to maturity
5.09%
Maturity date
Feb 4, 2030
HBAN5455646
Huntington Bancshares Incorporated 4.443% 04-AUG-2028Yield to maturity
4.79%
Maturity date
Aug 4, 2028
HBAN5411508
Huntington Bancshares Incorporated 4.552% 17-MAY-2028Yield to maturity
4.74%
Maturity date
May 17, 2028
Explore more bonds
Frequently Asked Questions
The current price of HBAN is 15.59 USD — it has decreased by −0.95% in the past 24 hours. Watch Huntington Bancshares Incorporated stock price performance more closely on the chart.
Depending on the exchange, the stock ticker may vary. For instance, on NASDAQ exchange Huntington Bancshares Incorporated stocks are traded under the ticker HBAN.
HBAN stock has fallen by −0.38% compared to the previous week, the month change is a 6.71% rise, over the last year Huntington Bancshares Incorporated has showed a 62.23% increase.
We've gathered analysts' opinions on Huntington Bancshares Incorporated future price: according to them, HBAN price has a max estimate of 19.00 USD and a min estimate of 15.00 USD. Watch HBAN chart and read a more detailed Huntington Bancshares Incorporated stock forecast: see what analysts think of Huntington Bancshares Incorporated and suggest that you do with its stocks.
HBAN reached its all-time high on Jun 4, 1999 with the price of 30.89 USD, and its all-time low was 0.59 USD and was reached on Dec 18, 1974. View more price dynamics on HBAN chart.
See other stocks reaching their highest and lowest prices.
See other stocks reaching their highest and lowest prices.
HBAN stock is 1.64% volatile and has beta coefficient of 0.74. Track Huntington Bancshares Incorporated stock price on the chart and check out the list of the most volatile stocks — is Huntington Bancshares Incorporated there?
Today Huntington Bancshares Incorporated has the market capitalization of 22.86 B, it has increased by 1.16% over the last week.
Yes, you can track Huntington Bancshares Incorporated financials in yearly and quarterly reports right on TradingView.
Huntington Bancshares Incorporated is going to release the next earnings report on Jan 17, 2025. Keep track of upcoming events with our Earnings Calendar.
HBAN earnings for the last quarter are 0.33 USD per share, whereas the estimation was 0.30 USD resulting in a 10.94% surprise. The estimated earnings for the next quarter are 0.30 USD per share. See more details about Huntington Bancshares Incorporated earnings.
Huntington Bancshares Incorporated revenue for the last quarter amounts to 1.89 B USD, despite the estimated figure of 1.86 B USD. In the next quarter, revenue is expected to reach 1.87 B USD.
HBAN net income for the last quarter is 517.00 M USD, while the quarter before that showed 474.00 M USD of net income which accounts for 9.07% change. Track more Huntington Bancshares Incorporated financial stats to get the full picture.
Yes, HBAN dividends are paid quarterly. The last dividend per share was 0.16 USD. As of today, Dividend Yield (TTM)% is 3.94%. Tracking Huntington Bancshares Incorporated dividends might help you take more informed decisions.
Huntington Bancshares Incorporated dividend yield was 4.87% in 2023, and payout ratio reached 50.09%. The year before the numbers were 4.40% and 42.75% correspondingly. See high-dividend stocks and find more opportunities for your portfolio.
Like other stocks, HBAN shares are traded on stock exchanges, e.g. Nasdaq, Nyse, Euronext, and the easiest way to buy them is through an online stock broker. To do this, you need to open an account and follow a broker's procedures, then start trading. You can trade Huntington Bancshares Incorporated stock right from TradingView charts — choose your broker and connect to your account.
Investing in stocks requires a comprehensive research: you should carefully study all the available data, e.g. company's financials, related news, and its technical analysis. So Huntington Bancshares Incorporated technincal analysis shows the buy rating today, and its 1 week rating is buy. Since market conditions are prone to changes, it's worth looking a bit further into the future — according to the 1 month rating Huntington Bancshares Incorporated stock shows the buy signal. See more of Huntington Bancshares Incorporated technicals for a more comprehensive analysis.
If you're still not sure, try looking for inspiration in our curated watchlists.
If you're still not sure, try looking for inspiration in our curated watchlists.