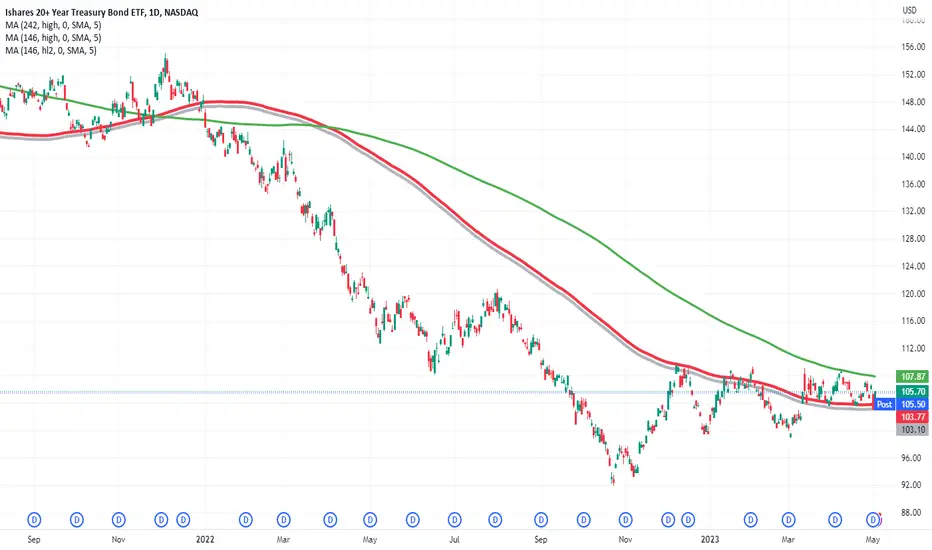
TLT moving averagesThis chart of TLT the long term US treasury bond ETF uses moving averages to attempt to see potential support and resistance. This uses 10 month, 200 day, 100 day and 20 day. My interpretation of this chart is bearish and potentially a good place to short it.
TLT trade ideas

Update On Interest RatesRate Update!
The United States, being the world's largest economy, often sets the tone for global interest rate trends. The Federal Reserve, the country's central bank, has been carefully monitoring economic indicators and inflationary pressures. Recent data have shown signs of rising inflation, prompting the Fed to adopt a more hawkish stance. While no immediate rate hikes have been implemented, market participants anticipate that the Fed may increase rates in the near future to curb inflation and maintain price stability.

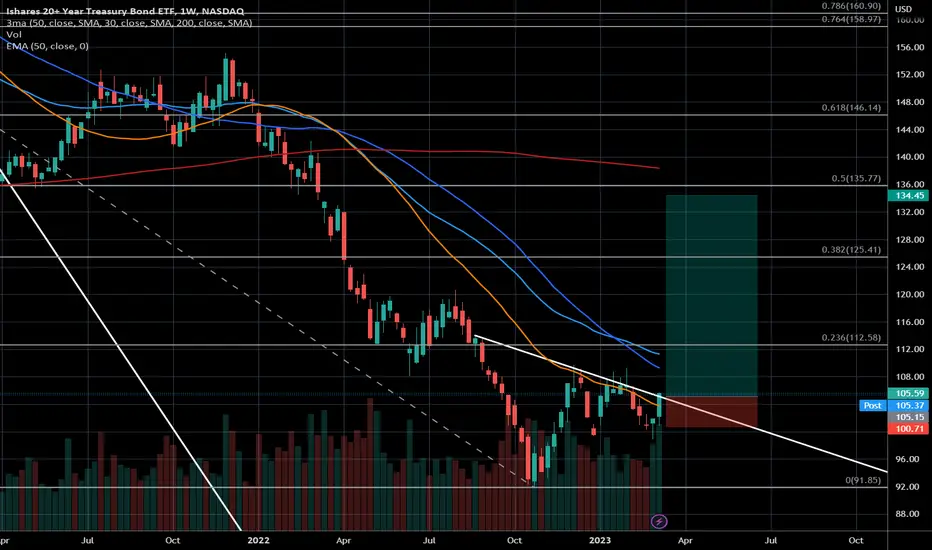
TLTAfter breaking down out of the triangle, price is now retracing to the 0.618 of the recent down move as well as AVWAP from the 52 week low. I like puts at this price.

TLT: UNDERVALUED, OVERVALUED OR JUST OVER? (INVERTED CHART)While doing some research for this chart I noticed this article titled: Noteworthy ETF Inflows: TLT.
Being that the charts generally tell you what is going on before the news does, this made a lot of sense
and what I would be expecting to see, given the broader economic conditions of the Earth realm.
Looking at an inverted chart illustrates quite clearly, what kind of price action we can, most likely,
anticipate from the TLT ETF. I have much more to add to this chart but my time has run out this
morning. So look for updates moving forward.

Da bondsThis is the NASDAQ:TLT I'm long the AMEX:TMF and going to be long the AMEX:ZROZ as well with this good debt ceiling news.
On the chart I'm seeing a bottoming candle in a demand zone on the weekly chart.
I'm also seeing high volume maintaining.
Furthermore, those moving averages are close together, so I think the extraordinary signal will be NASDAQ:TLT above $110 and those moving averages crossing.
I could hold this trade for years and not care while collecting dividends.
Another thing, in 2011 we got a deal and the day of the vote everything freaked out then our debt got downgraded and bonds rocketed.
This is a great RR imo.

BITO, FXE, GLD, TLTThe markets BITO, FXE, GLD, TLT are all under extreme downleg compressions. A resolution or resolution failure could cause an extreme reaction in any or all of these markets. If there is a marked retracement in any of these markets an out of the money call position could offer an exceptional opportunity even if only one of these markets complies, IMHO.

TLT Bottoming? TLT may be forming a basing pattern here after breaking down from the triangle pattern. Could be a good time to scale in here.

#TLT H4 Range Trading OpportunityIn this update we review the recent price action in TLT and identify the next high probability trading opportunity and price objectives to target

$TLT longSee chart image. I wish this breakout was a bit higher but according to my rules we have no a breakout. So let's see how this setup unfolds. According to fundamentals I see the prices for this kind of instruments rather rising.
Good trades!
TLT / TBT Ratio - a bonds long and short oscillatorOn the daily chart- I have plotted the TLT (Long Bond Leveraged) ETF vs the TBT (Short
Inverse) as a ratio. The ratio is running on a cycle between high and low. On the chart for
reference is a Hull Moving Average of 20 days. A more frequency cyling could be achieved
with a paid Tradingview subscription and a charting time frame of 2 or 4 hours.
For the trading idea, when the hull moving average is upgoing and the price is above it, the TLT
can be bought while when the moving average of the ratio is decreasing and price is under it,
the TBT can be bought. At a high pivot point, all TLT is liquidated and a TBT trade is taken .
For a low pivot point, TBT positions are closed and TLT long trades are taken. The best trades
are at the pivot points and when a doulble top or bottom are put onto the chart.


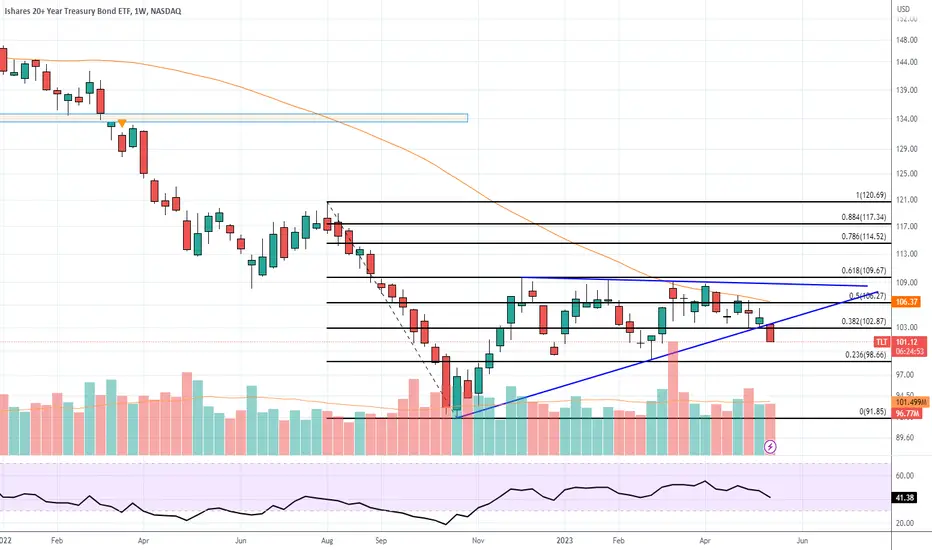
TLTMultiple rejections off 0.618 retracement & weekly 50 sma. Now breaking down out of the triangle. Just as everyone starts to get bullish, looks like rates are going to be going up again. Seems like it will be an interesting summer imo.
$29.99 by Aug-Sept 2023? Impossible.Treasuries are falling and nobody seems to care. The comparison to the Titanic is very valid. That scene from the movie, when the ship has already hit an iceberg, the engines brought to a halt, but the rich kids just keep playing with chunks of ice on the upper deck. Close-up on a bar table.. and a glass of whisky slides off, falls on the deck and breaks into smithereens. End of part One.
I will tell you what's going to happen next. First, we will see TLT at 88-92. This will mark the end of wave 1 of the sell-of in green wave 5. Once the correction is over, the sell-off will continue, and when we break below 88, it's all gone: we will almost immediately see 40..45. This will mark the end of wave 3 of green wave 5. The downtrend will continue after a brief correction in wave 5 of 5. I will dare make a prediction that TLT will reach below 30 at the tip of wave 5 of 5.
$29.99 anyone?
By the time TLT reaches 29.99:
- SPX will be at 1500,
- EURUSD will be at 0.75
- USDJPY will be at ~100
- EURJPY will break below 88
- 10Y will to my great delight break above 10%.
Oh, and Ukraine will start peace talks with Russia on Russia's terms..


The Titanic of Treasuries has just hit an icebergThe triangle is now 100% completed, and wave 5 is imminent. And nobody seems to care. As it should be.

TLT - Intermediate BUY Set-UpHere is my road map for TLT... T-Bonds
This will have significant ramifications across many correlated markets. Think ES, DXY, Gold etc...
I believe we close to embarking on a C wave move up to the opposing upper channel line. This could take on a variety of shapes/slopes. Time will tell.
The bigger move ahead is down... although the move ahead will be worth participating in.
See my published ideas linked below covering TBonds yields and ES/SPX pathways related to this supposition.
Weekly view of TLT here:

TLT - All debts, public and privateTo even imagine the US defaulting on any of its debt is just unthinkable. But here are my pivot points for it coming true or fearing that it might come true and the relief when the recurring debt default silliness is behind us once again. The move in either direction might be rather significant and I would be happy to be on board for either direction.
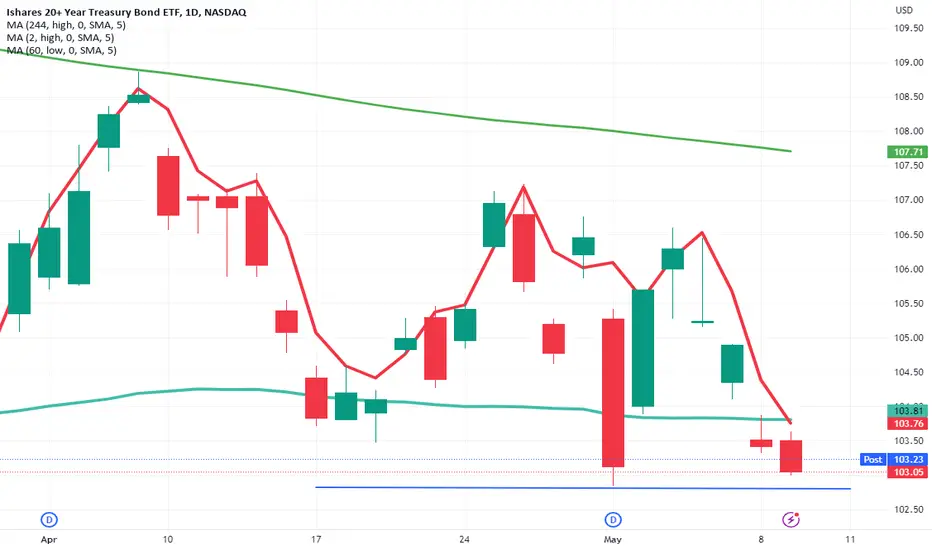
TLTBearish below $103. Bullish above $110. Consensus seems to be that the Fed is done raising rates. What if they aren't?

Hard to see this break downThis looks like it could break below trend, which could be because of the strong jobs market… but rates have nowhere to go but down. I will be buying 3 month calls on TLT Monday morning.

Wave 4 continues to evolveThe triangle continues to evolve, and is not finished yet. Ideally I would like to see one last upswing to 108...109, and then the triangular wave 4 will be completed.
The completion of wave 4 is what separates the calm from the true storm. The crash of Treasuries in wave 5 will produce a worldwide market crash not even comparable to those of 1929, 1987, 2000, or 2008.

Latest Rate Trend
The current probability of interest rates, as depicted in the chart, indicates an improvement rather than a decline, with the expectation of this trend emerging shortly. Presently, I am opting to float rather than lock rates, at least until next week. The Federal Reserve's modest increase of 25 basis points suggests a potential deceleration or cessation of rate hikes. The imminent failure of PacWest Bank highlights the impact of the Fed rate hikes on the economy, necessitating a pivot or reversal to prevent widespread failures.

TLT TimeLong term bond trade. Might be early to the ride here and I'm going to be a little more loose with the stop on this one.

TLT - a long slide and now ???Are we done? Lower long rates with a recession? Or a collapse with default fears or other economic reasoning? I have my MA levels and will wait and watch.