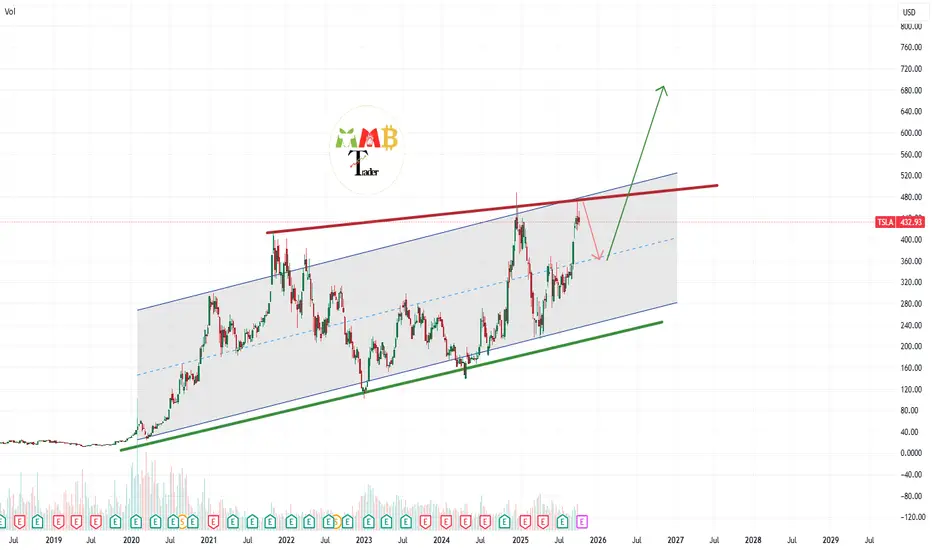
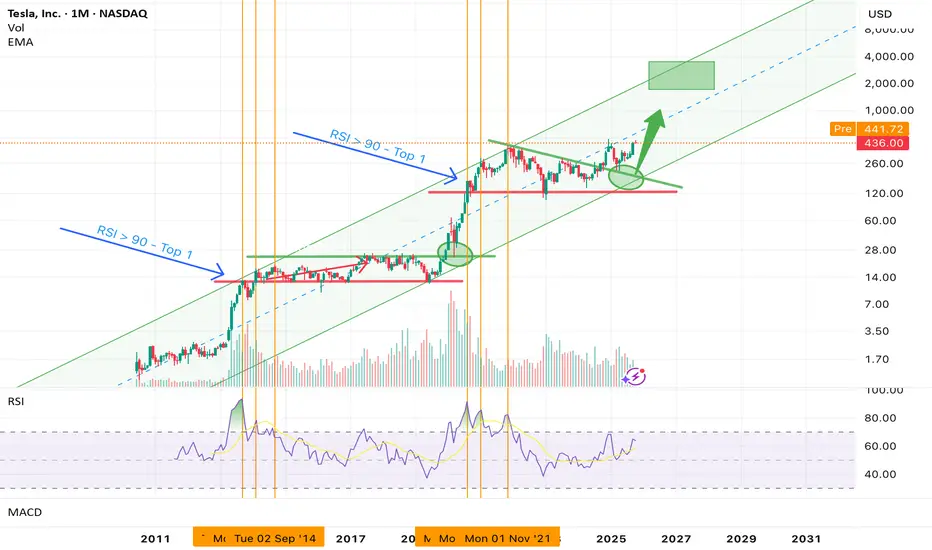
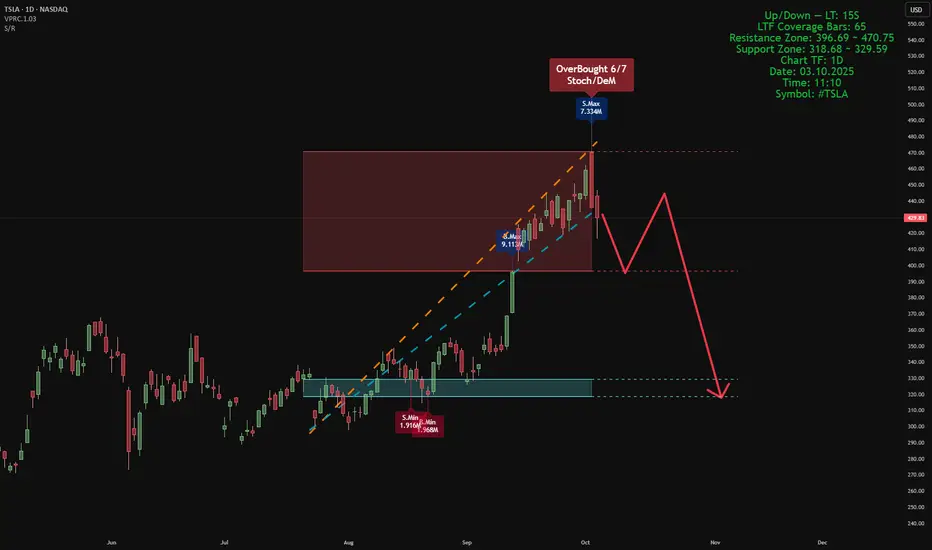
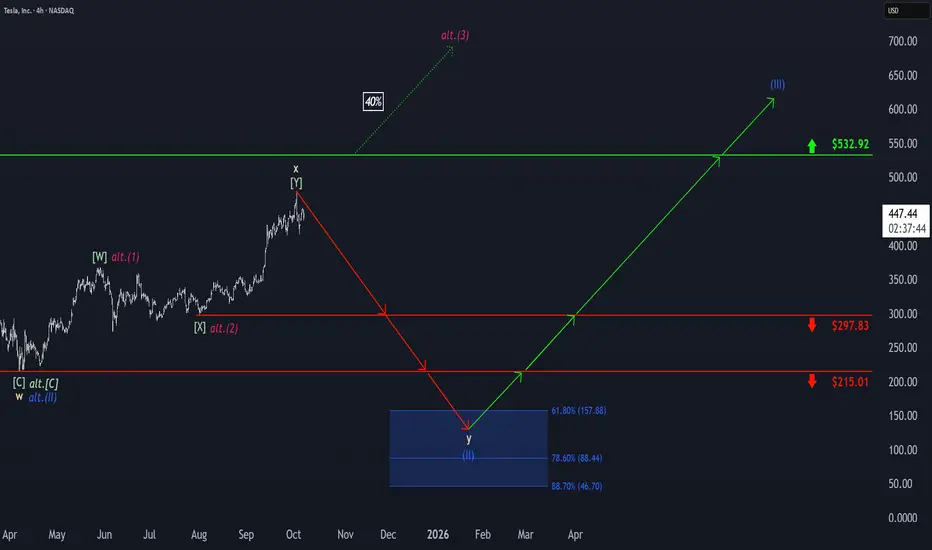
Tesla - Breaking literally all support here!🚨Tesla ( NASDAQ:TSLA ) created a monster breakdown:
🔎Analysis summary:
For over five years, Tesla has overall been trading in a clear triangle consolidation. And with this monthly candle, Tesla is actually breaking the major triangle support trendline. If Tesla confirms this bearish breakdown
Compare with Tesla
Key facts today
Tesla (TSLA) and SpaceX will build a ~100 million sq ft Terafab in Grimes County, TX to produce over 1 terawatt of AI compute hardware yearly for Tesla custom chips used in Optimus. 1
NHTSA opened a probe into ~1.2M Tesla (TSLA) 2018–2020 Model 3 and 2021–2023 Model Y for possible front lower lateral link detachments; no crashes, injuries or deaths reported so far. 1
Tesla (TSLA): China accounts for roughly 20% of annual sales; Shanghai factory is a major producer. Splitting or divesting Chinese assets would be complex due to shared software, AI and data. 1
1.18 USD
3.79 B USD
94.83 B USD
2.82 B
Next report date
—
Report period
—
EPS estimate
—
Revenue estimate
—
Details
Sector
Industry
CEO
Elon Reeve Musk
Website
Headquarters
Austin
Founded
2003
IPO date
Jun 29, 2010
ISIN
US88160R1014
CUSIP
88160R101
FIGI
BBG000N9MNX3
Identifiers
ISIN US88160R1014
Tesla, Inc. engages in the design, development, manufacture, and sale of electric vehicles and energy generation and storage systems. The company operates through Automotive and Energy Generation and Storage. The Automotive segment includes the design, development, manufacture, sale, and lease of electric vehicles as well as sales of automotive regulatory credits. The Energy Generation and Storage segment is involved in the design, manufacture, installation, sale, and lease of stationary energy storage products and solar energy systems, and sale of solar energy systems incentives. The company was founded by Jeffrey B. Straubel, Elon Reeve Musk, Martin Eberhard, and Marc Tarpenning on July 1, 2003 and is headquartered in Austin, TX.
TSLA Price Action: Order Block Recovery Toward Liquidity🔹 TSLA price action continues to reflect a bearish market structure after a strong decline from the previous swing high. Following the formation of a fresh lower low, price has reacted from a highlighted bullish order block, suggesting that buying interest may be emerging from this demand zone. The
TSLA Descending Triangle — Bearish Breakdown Toward $300
Tesla (TSLA) is showing a **bearish descending-triangle structure** on the 1-hour chart. Price has been making lower highs while repeatedly testing the major support zone around **$295–$300**. The recent recovery toward **$333–$340** is facing resistance, keeping the broader setup bearish.
A con
Tesla: Can This Support Zone Halt the Sell-Off?A Major Confluence of Support
Tesla has fallen into an important long-term support zone, where the 0.618 Fibonacci retracement, 200-Week EMA, and previous swing lows all converge around $323. This confluence could prove pivotal after the sharp decline from January's all-time high.
ABC Correction
Opening: TSLA September 18th 265/275/365/375 Iron Condor... for a 3.54 credit.
Comments: A basic bet that TSLA stays between 275 and 365 through September opex.
Metrics:
Max Profit: 3.54 ($354)
Max Loss: 6.46 ($646)
ROC at Max: 54.8%
ROC at 50% Max: 27.4%
Will generally look to take profit at 50% max, roll in untested side on approaching worthless
Multi-Year Rising Wedge Breakdown Shifts Focus to Major DemandTesla has confirmed a breakdown from its multi-year rising wedge, signaling a potential shift in the higher-timeframe structure after an extended bullish cycle. Price is now trading below the former wedge support, which has turned into dynamic resistance, while the broader supply zone continues to c
Tesla (TSLA) — Bullish Continuation | Upside Target $410Tesla is showing a constructive bullish structure, with buyers maintaining control and the overall price action favoring further upside. The current setup suggests that bullish momentum can continue as long as the key demand structure remains intact.
According to my analysis, TSLA has the potential
See all ideas
Summarizing what the indicators are suggesting.
Neutral
SellBuy
Strong sellStrong buy
Strong sellSellNeutralBuyStrong buy
Neutral
SellBuy
Strong sellStrong buy
Strong sellSellNeutralBuyStrong buy
Neutral
SellBuy
Strong sellStrong buy
Strong sellSellNeutralBuyStrong buy
An aggregate view of professional's ratings.
Neutral
SellBuy
Strong sellStrong buy
Strong sellSellNeutralBuyStrong buy
Neutral
SellBuy
Strong sellStrong buy
Strong sellSellNeutralBuyStrong buy
Neutral
SellBuy
Strong sellStrong buy
Strong sellSellNeutralBuyStrong buy
Displays a symbol's price movements over previous years to identify recurring trends.
Maturity dateMar 19, 2030
Coupon5.45% (Fixed)
Maturity dateApr 23, 2030
Coupon5.45% (Fixed)
See all TSLA bonds
Frequently asked questions
The current price of TSLA is 332.81 USD — it has increased by 0.70% in the past 24 hours. Watch Tesla, Inc. stock price performance more closely on the chart.
Depending on the exchange, the stock ticker may vary. For instance, on NASDAQ exchange Tesla, Inc. stocks are traded under the ticker TSLA.
TSLA stock has risen by 6.41% compared to the previous week, the month change is a −19.39% fall, over the last year Tesla, Inc. has showed a −0.65% decrease.
We've gathered analysts' opinions on Tesla, Inc. future price: according to them, TSLA price has a max estimate of 600.00 USD and a min estimate of 24.86 USD. Watch TSLA chart and read a more detailed Tesla, Inc. stock forecast: see what analysts think of Tesla, Inc. and suggest that you do with its stocks.
TSLA reached its all-time high on Dec 22, 2025 with the price of 498.83 USD, and its all-time low was 1.00 USD and was reached on Jul 7, 2010. View more price dynamics on TSLA chart.
See other stocks reaching their highest and lowest prices.
TSLA stock is 2.02% volatile and has beta coefficient of 2.13. Track Tesla, Inc. stock price on the chart and check out the list of the most volatile stocks — is Tesla, Inc. there?
Today Tesla, Inc. has the market capitalization of 1.31 T, it has decreased by −17.80% over the last week.
Yes, you can track Tesla, Inc. financials in yearly and quarterly reports right on TradingView.
Tesla, Inc. is going to release the next earnings report on Oct 28, 2026. Keep track of upcoming events with our Earnings Calendar.
TSLA earnings for the last quarter are 0.33 USD per share, whereas the estimation was 0.53 USD resulting in a −38.13% surprise. The estimated earnings for the next quarter are 0.46 USD per share. See more details about Tesla, Inc. earnings.
Tesla, Inc. revenue for the last quarter amounts to 28.24 B USD, despite the estimated figure of 26.42 B USD. In the next quarter, revenue is expected to reach 27.66 B USD.
TSLA net income for the last quarter is 1.12 B USD, while the quarter before that showed 477.00 M USD of net income which accounts for 0.00% change. Track more Tesla, Inc. financial stats to get the full picture.
No, TSLA doesn't pay any dividends to its shareholders. But don't worry, we've prepared a list of high-dividend stocks for you.
As of Aug 12, 2026, the company has 134.78 K employees. See our rating of the largest employees — is Tesla, Inc. on this list?
EBITDA measures a company's operating performance, its growth signifies an improvement in the efficiency of a company. Tesla, Inc. EBITDA is 11.25 B USD, and current EBITDA margin is 11.60%. See more stats in Tesla, Inc. financial statements.
Like other stocks, TSLA shares are traded on stock exchanges, e.g. Nasdaq, Nyse, Euronext, and the easiest way to buy them is through an online stock broker. To do this, you need to open an account and follow a broker's procedures, then start trading. You can trade Tesla, Inc. stock right from TradingView charts — choose your broker and connect to your account.
Investing in stocks requires a comprehensive research: you should carefully study all the available data, e.g. company's financials, related news, and its technical analysis. So Tesla, Inc. technincal analysis shows the sell today, and its 1 week rating is sell. Since market conditions are prone to changes, it's worth looking a bit further into the future — according to the 1 month rating Tesla, Inc. stock shows the neutral signal. See more of Tesla, Inc. technicals for a more comprehensive analysis.